
- Price actions staged a bullish breakout from a three-month descending range.
- Daily MACD trend indicator rose to a five-month high reading above the zero centreline which reinforces a medium-term uptrend condition of the Hang Seng Index.
- In the shorter term, a minor pull-back cannot be ruled out due to an extremely overbought reading seen in the hourly RSI oscillator.
- Key short-term support to watch will be at 19,700.
One of China’s proxies benchmark stock indices, the Hang Seng Index staged a bullish breakout last Friday, 28 July on the backdrop of more upcoming consumer-related stimulus measures, and private sector-friendly rhetoric from China’s top policymakers announced in the past two weeks to reverse the current weak internal demand environment in China.
Medium-term bullish breakout from descending range in place since April 2023
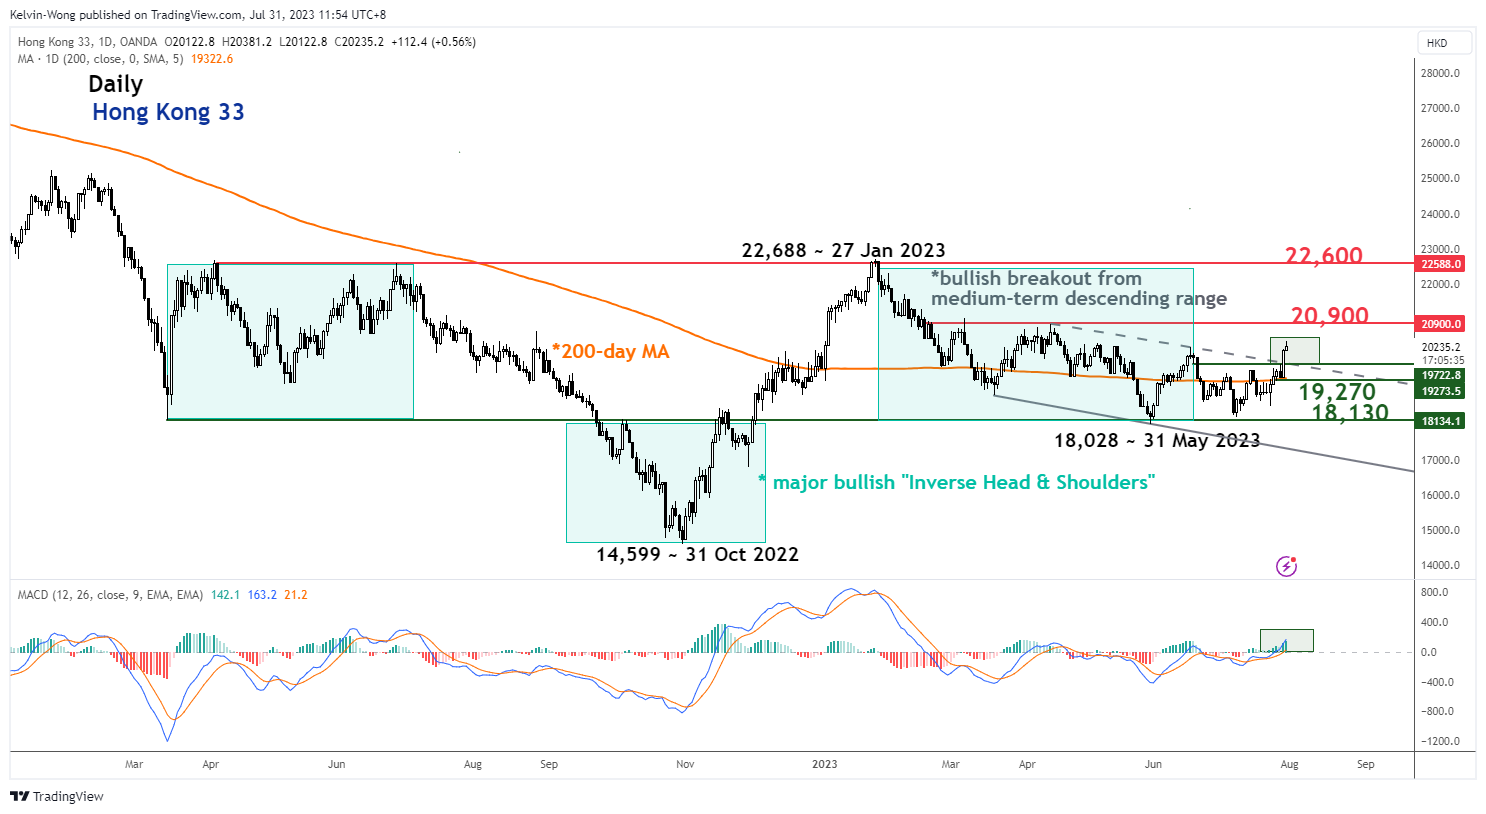
Fig 1: Hong Kong 33 medium-term trend as of 31 Jul 2023 (Source: TradingView, click to enlarge chart)
Price actions of the Hong Kong 33 Index (a proxy for the Hang Seng Index futures) have broken above the medium-term descending range resistance in place since the 17 April 2023 high now turns pull-back support at 19,700. Additionally, in the past week, the Index has recorded a weekly gain of +6.25% which was its best weekly performance seen in the past six months.
The daily MACD trend indicator has pierced above the zero line and recorded a five-month high of 162.9 at this time of the writing which reinforces a medium-term uptrend condition for the Index.
Minor uptrend hit overstretched condition, at risk of a minor pull-back
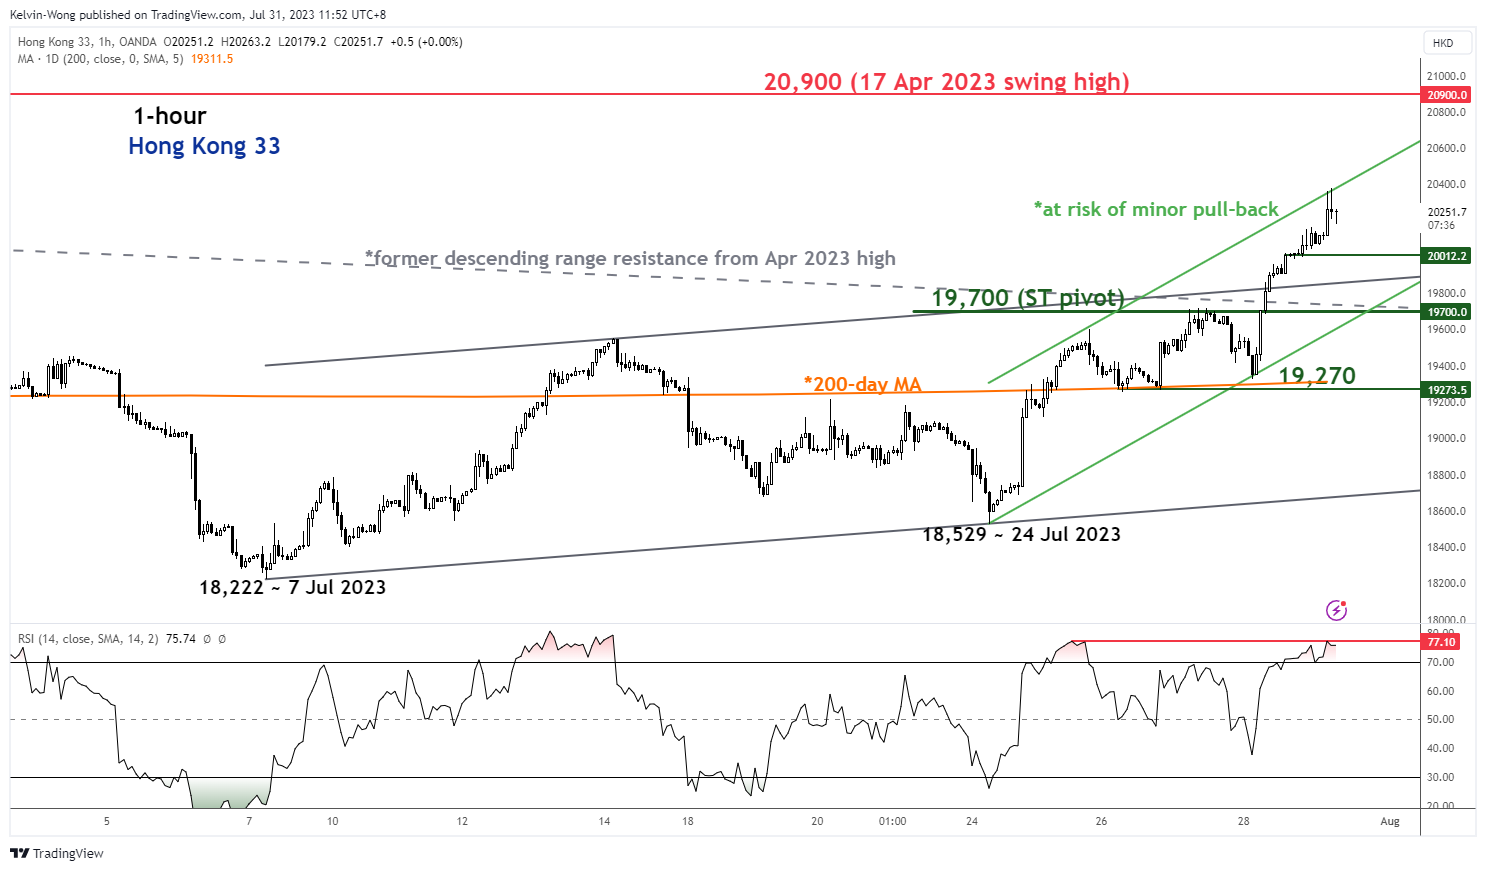
Fig 2: Hong Kong 33 minor short-term trend as of 31 Jul 2023 (Source: TradingView, click to enlarge chart)
In the shorter-term (see 1-hour chart), the price actions of the Index have reached the upper boundary of a minor ascending channel in place since the 24 July 2024 low of 18,529 coupled with an extreme overbought condition reading of 77.10 seen on the hourly RSI oscillator.
These short-term technical elements suggest that the current short-term burst up in price actions is overstretched, and a minor pull-back may occur within its short to medium-term uptrend phases with near-term support at 20,010.
The key short-term pivotal support will be at 19,700 to maintain the short-term uptrend phase from the 24 July 2023 low with the next resistance coming in at 20,900.
However, a break below 19,700 sees a deeper pull-back to expose the next support at 19,270 (also the 200-day moving average).


