
- Yesterday’s daily “Shooting Star” candlestick coupled with today’s long-body daily bearish candle increases the odds of a bearish breakdown below the 50-day moving average.
- Ongoing minor decline from the 1 August high of 33,490 high has reached an oversold condition, an imminent minor bounce may occur first before a potential new down leg.
- Key short-term resistance will be at 33,490.
The price actions of the Japan 225 Index (a proxy of the Nikkei 225 futures) have staged the expected up move and reached the 33,200 resistance (printed an intraday high of 33,494 yesterday, 1 August).
Thereafter, it declined by -2.75% to hit an intraday low of 32,544 in today, 2 August Asian session at this time of the writing.
The current weakness of the Index has been mainly attributed to the negative feedback loop triggered by US sovereign debt credit downgrade to AA+ from AAA by Fitch Ratings that also spread to other major Asian benchmark stock indices intraday today; Hang Seng Index (-2.40%), Hang Seng TECH Index (-3.60%), CSI 300 (-0.90%), KOSPI 200 (-2.05%), ASX 200 (-1.29%), and Straits Times Index (-1.50%).
At the risk of breaking down below the 50-day moving average
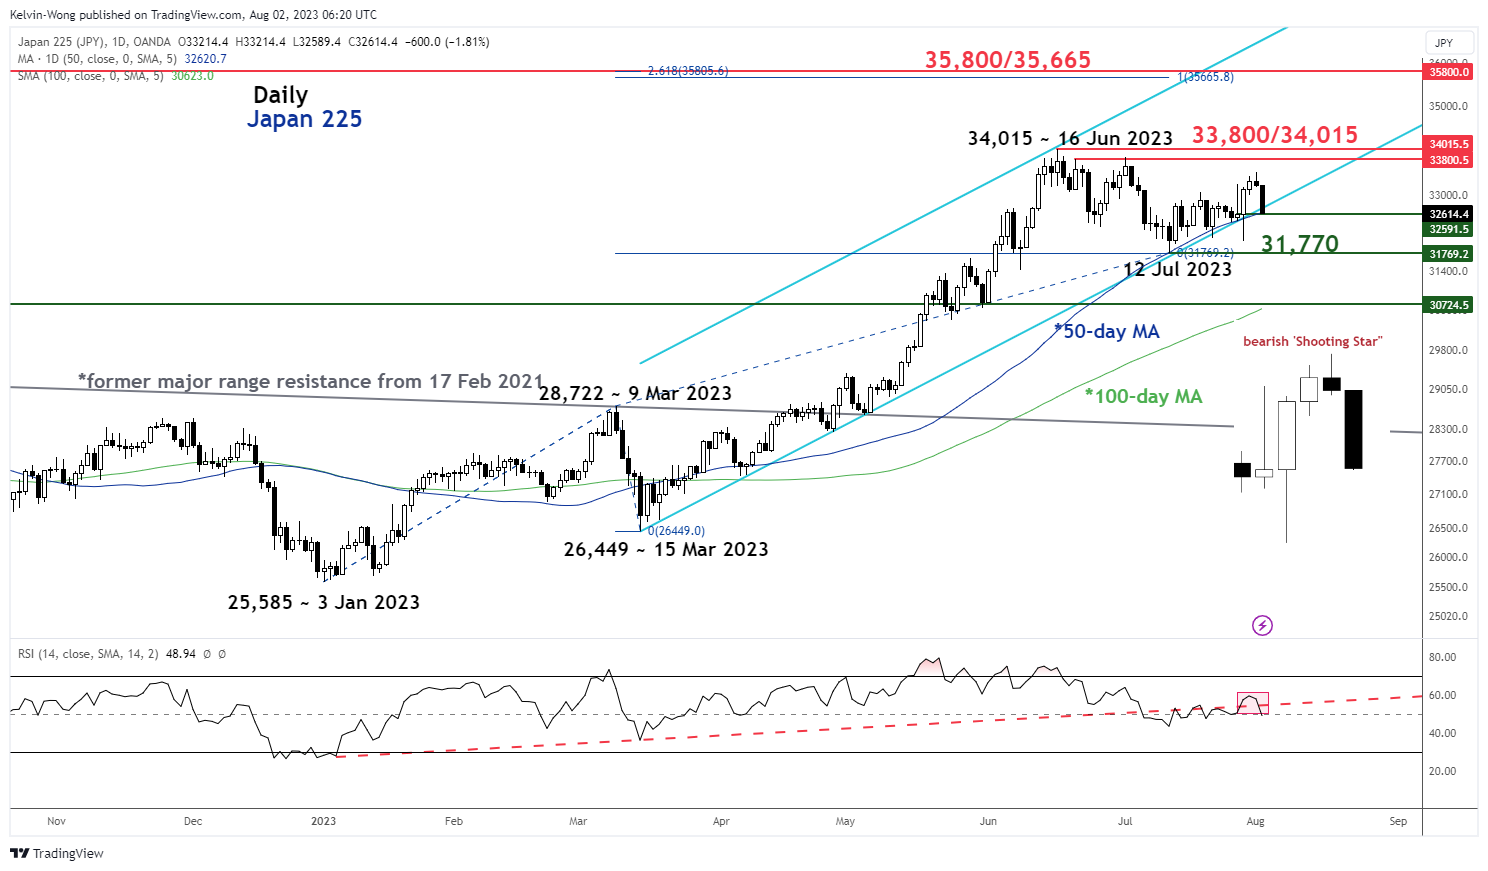
Fig 1: Japan 225 medium-term trend as of 2 Aug 2023 (Source: TradingView, click to enlarge chart)
Several medium-term negative elements have surfaced in the price actions of the Japan 225 Index. Yesterday’s price action has formed a daily “Shooting Star candlestick pattern that indicates the risk of a bearish reversal in sentiment.
Today’s longed-body bearish candlestick follow-through has increased the odds of such a bearish reversal that may see the Index break below its 50-day moving average (now at 32,590) that has supported the Index since 27 March 2023.
The potential break below the 50-day moving average may unleash a multi-week corrective decline within a major uptrend phase of the Index.
Minor decline from the 1 August high of 33,490 reached an oversold condition
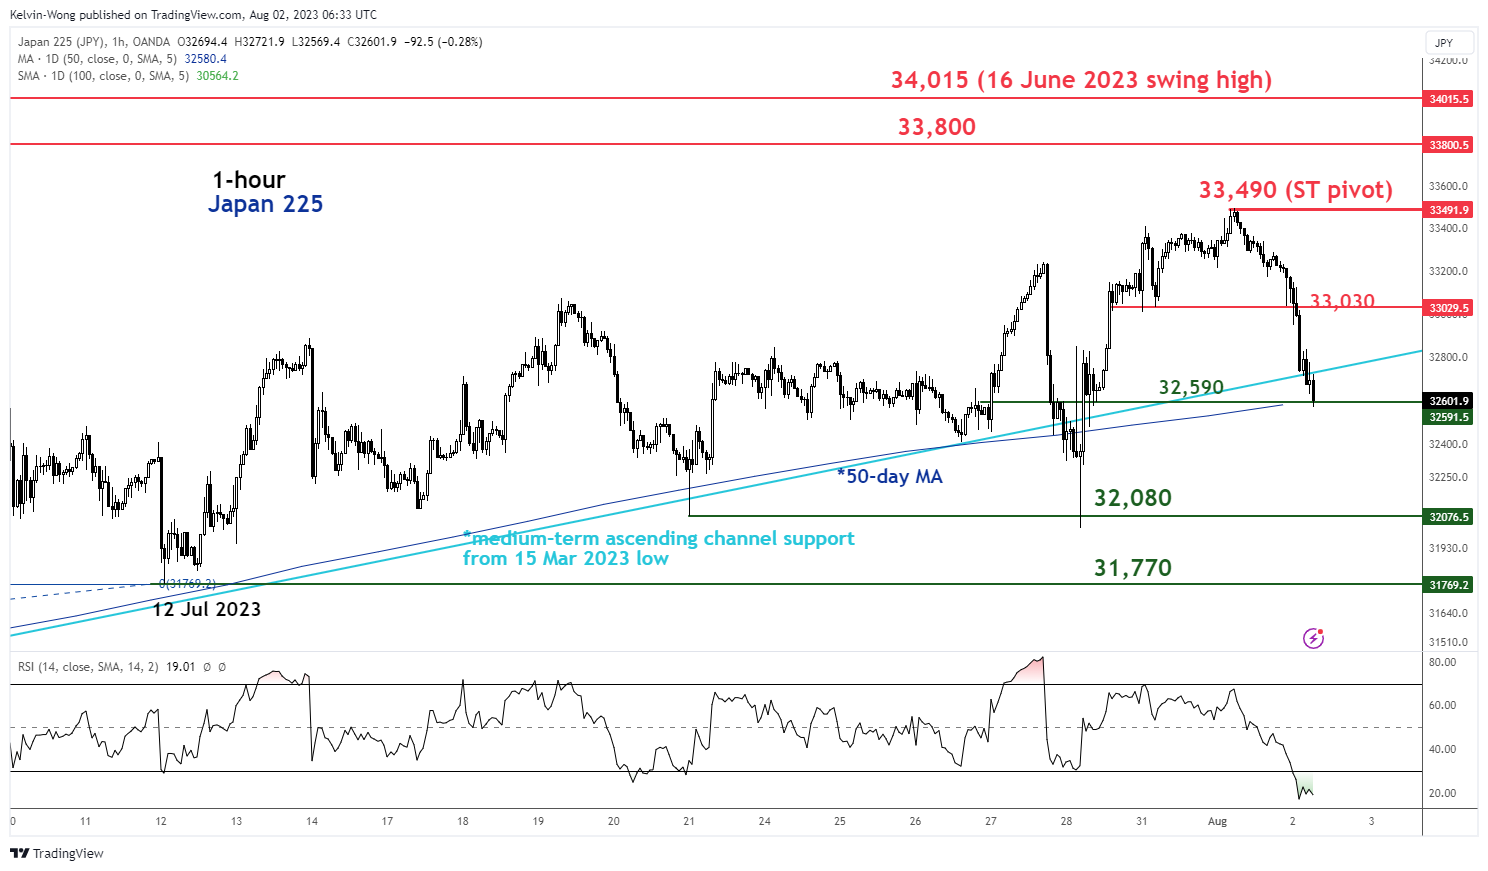
Fig 2: Japan 225 minor short-term trend as of 2 Aug 2023 (Source: TradingView, click to enlarge chart)
The ongoing minor decline from yesterday, 1 August high of 33,490 has led the hourly RSI oscillator to reach its oversold region that indicates a potential imminent bounce may take shape due to overstretched price actions in the short-term.
Watch the 33,030 intermediate resistance (close to 50% Fibonacci retracement of the current minor decline from the 1 August high of 33,490 to today’s current intraday low of 32,544).
33,490 key short-term pivotal resistance to maintain the short-term bearish tone with the next supports coming in at 32,080, and 31,770 (12 July 2023 swing low).
On the flip side, a clearance above 33,490 invalidates the bearish tone to see the next resistances at 33,800 and 34,015 in the first step.


 have staged the expected up move and reached the 33,200 resistance (printed an intraday high of 33,494 yesterday, 1 August).)