
- The recent weakness seen in the GBP is due to a broad-based strength in the US dollar as a short-term safe haven refuge triggered by global risk-off behaviour.
- The accumulated 462 pips decline seen in the GBP/USD since the 14 July high of 1.3142 has almost reached the key medium-term support of 1.2630.
- A clearance above 1.2740 on the GBP/USD may negate the current bearish tone.
The GBP/USD has shed an accumulated 462 pips in the past three weeks from its current 52-week high of 1.3142 reached on 14 July 2023. The losses seen so far this week have been accentuated by across-the-board US dollar strength triggered by a global risk-off behaviour yesterday, 2 August in the aftermath of Fitch’s US sovereign debt credit rating downgrade to AA+ from AAA.
Later today, the Bank of England (BoE) will announce its latest monetary policy decision and the consensus is calling for a 25 basis point hike to bring the policy interest rate to 5.25%, its highest level since the 2008 Great Financial Crisis.
Since the latest UK core inflation data for June has remained elevated at 6.9% year-on-year, the highest among G7, and nearly 3.5 times above BoE ‘s 2% target, most market participants think that BoE is not at or near their interest rate tightening cycle, in contrast with the US Federal Reserve and the European Central Bank.
The consensus is expecting a peak rate of 5.75% or 6% later in 2023 or early 2024 which implies another potential two to three hikes of 25 bps hike each by BoE after today’s meeting.
Hovering right above 1.2630 key medium-term support
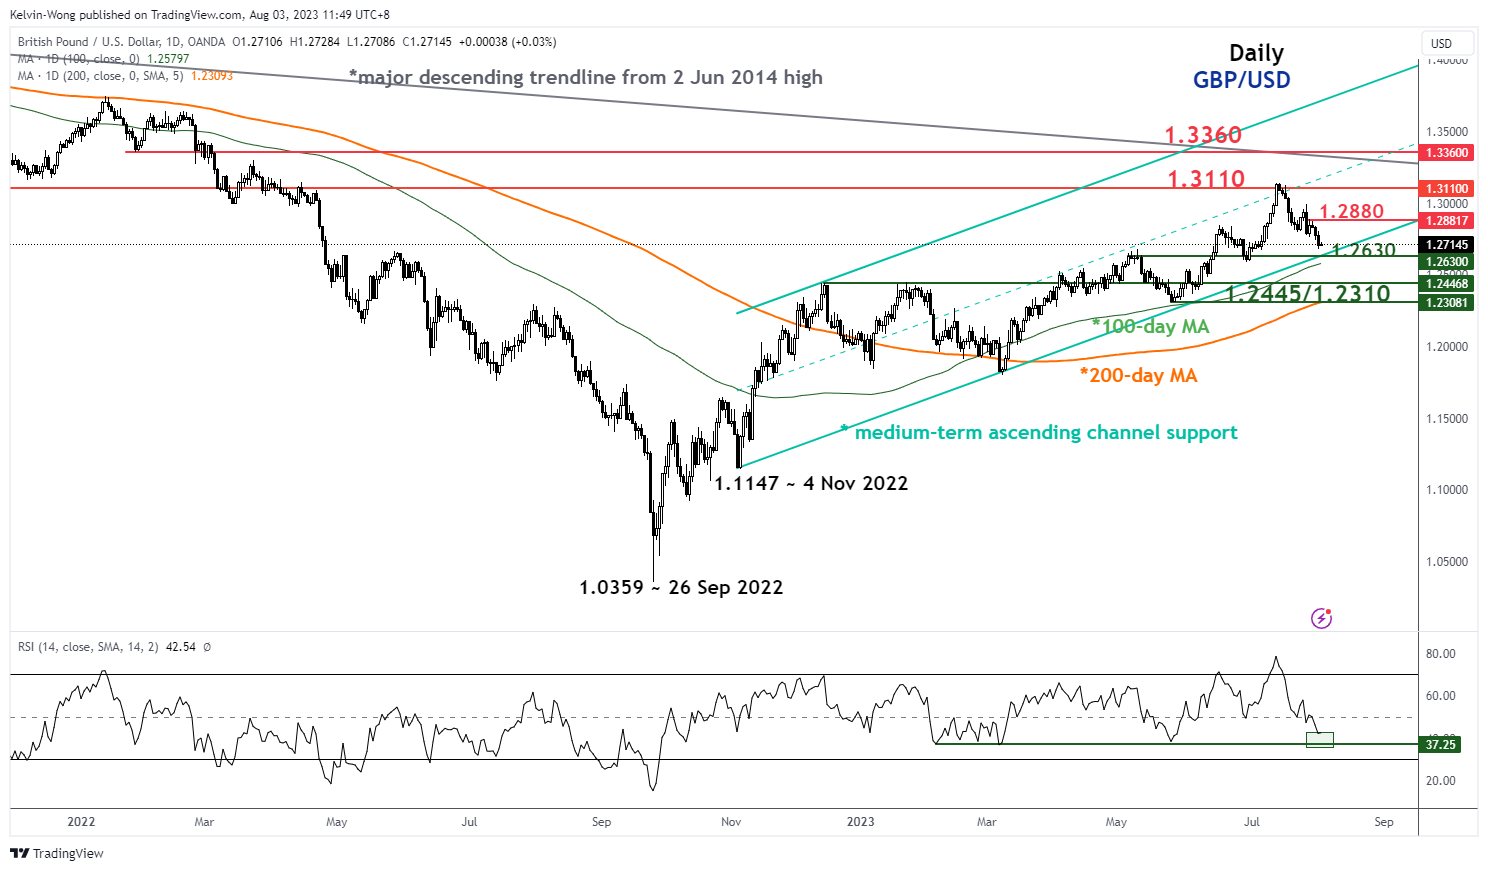
Fig 1: GBP/USD medium-term trend as of 3 Aug 2023 (Source: TradingView, click to enlarge chart)
Interestingly, yesterday’s intraday low of 1.2680 has almost reached a key medium-term support of 1.2630 which is being confluence by the lower limit of the medium-term ascending channel in place since 4 November 2022 low of 1.1147 and the upward sloping 100-day moving average.
Short-term downside momentum has reached an oversold condition
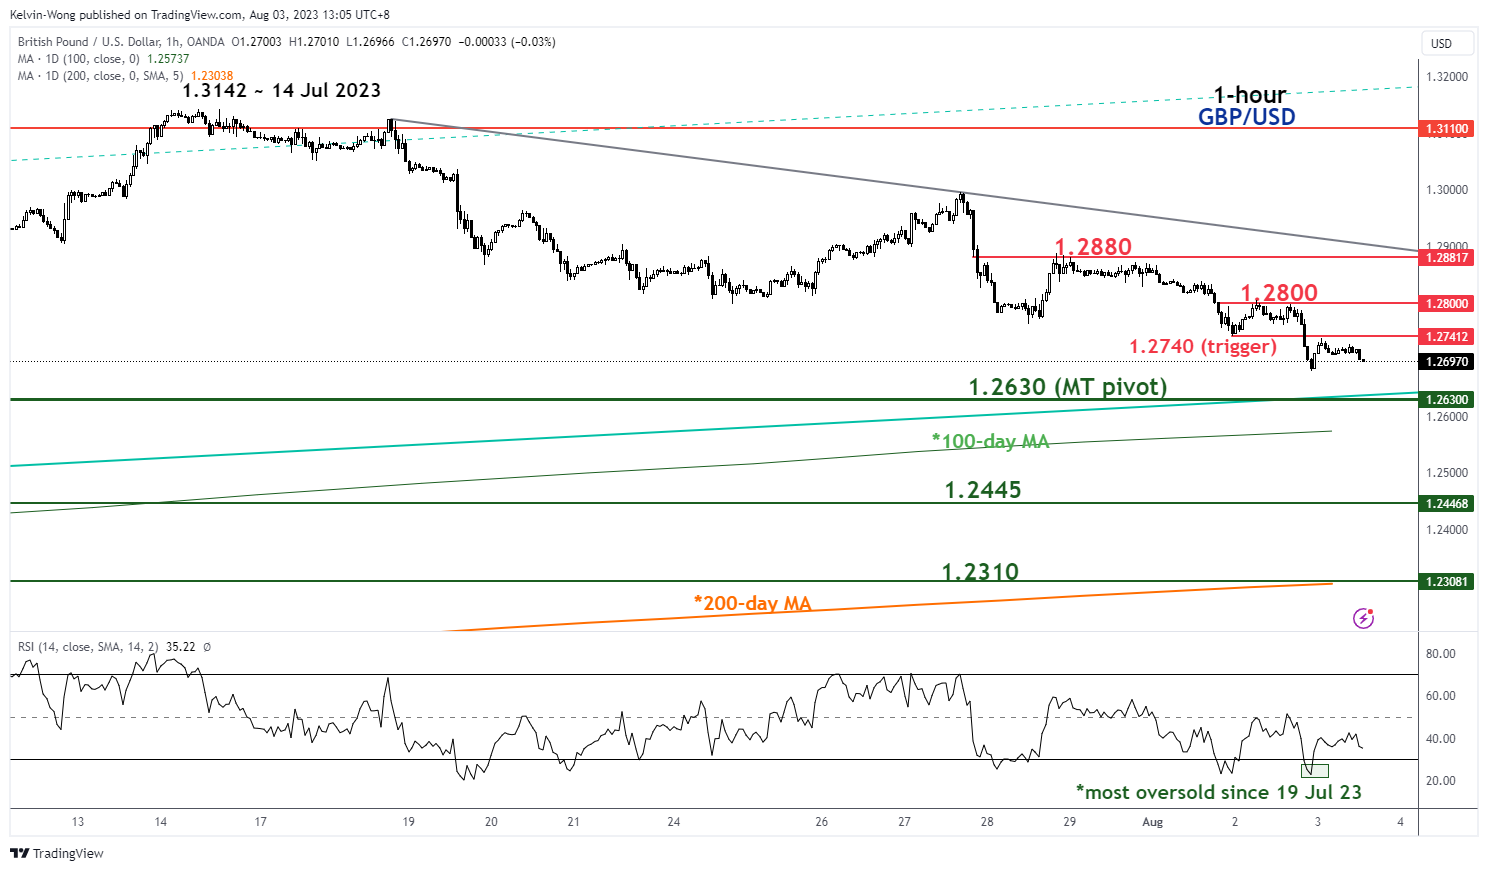
Fig 2: GBP/USD minor short-term trend as of 3 Aug 2023 (Source: TradingView, click to enlarge chart)
The hourly RSI oscillator reached an oversold level of 22.9 yesterday, 2 August, its lowest oversold condition since 19 July 2023. In addition, the daily RSI oscillator is also coming close to a parallel key support level of 37.
Watch the 1.2630 key medium-term pivotal support and a clearance above 1.2740 sees the next resistances coming in at 1.2800 and 1.2880.
On the other hand, a break below 1.2630 invalidates the minor rebound scenario to expose the next support at 1.2445 in the first step.


