
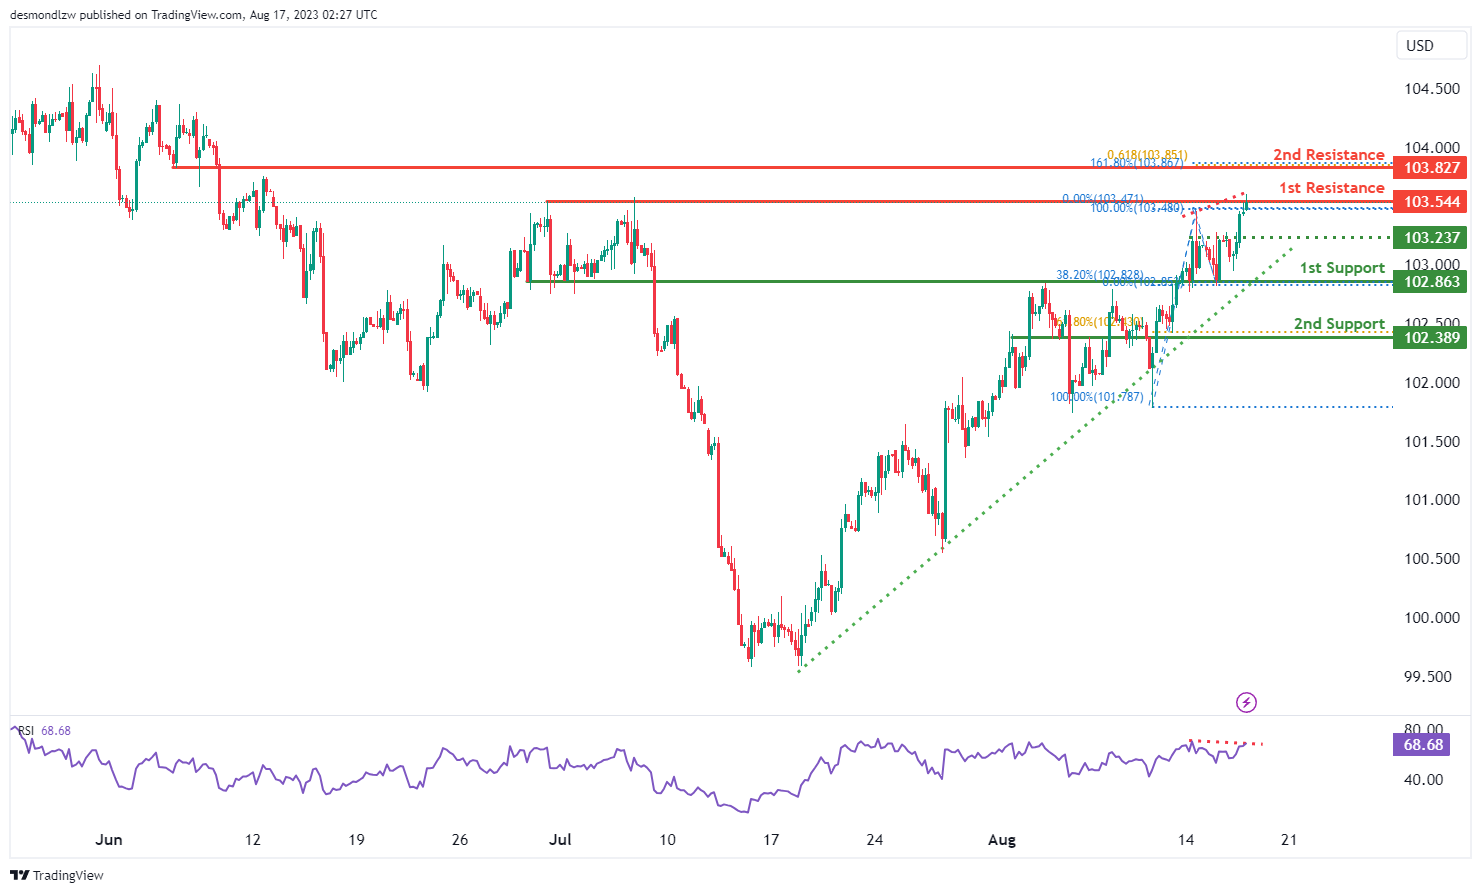
DXY:
The DXY chart’s overall momentum is bullish, supported by its position above a significant ascending trend line, hinting at potential further bullish movement.
Considering this, there’s a possibility of a short-term decline towards the 1st support at 102.86 before a potential bounce, aiming for the 1st resistance at 103.54, noted for its multi-swing high resistance.
The 1st support at 102.86 gains strength as a pullback support, backed by the 38.20% Fibonacci Retracement, while the 2nd support at 102.38 acts as an overlap support, reinforced by the 61.80% Fibonacci Retracement.
On the flip side, the 2nd resistance at 103.82 represents a pullback resistance.
Additionally, the Relative Strength Index (RSI) testing a major resistance level implies a potential upcoming reversal in price movement.
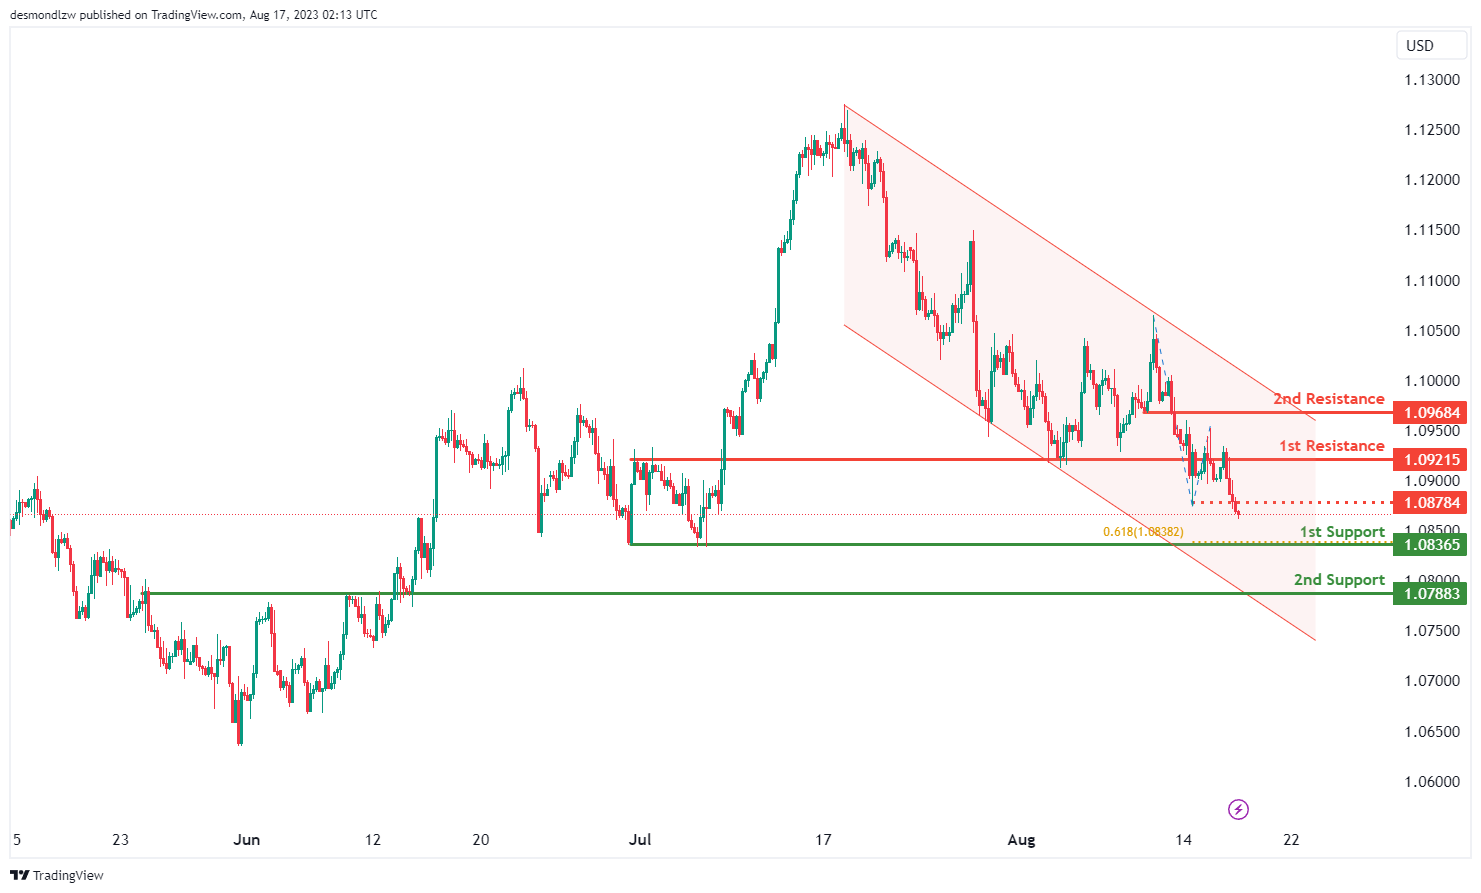
EUR/USD:
The EUR/USD chart currently maintains a bearish momentum, as indicated by its position within a descending channel. This channel pattern suggests a potential continuation of the downward trend due to the existing bearish momentum.
Given this bearish sentiment, there’s a likelihood of a bearish continuation towards the 1st support at 1.0836, which is reinforced by its role as a multi-swing low support and the presence of a 61.80% Fibonacci Projection.
Supporting the structure, the 2nd support at 1.0788 is identified as an overlap support.
On the resistance side, the 1st resistance at 1.0921 is significant due to its classification as an overlap resistance. Additionally, the 2nd resistance at 1.0968 acts as a pullback resistance.
Moreover, the intermediate resistance at 1.0878 is a pullback resistance, further contributing to the potential resistance levels.
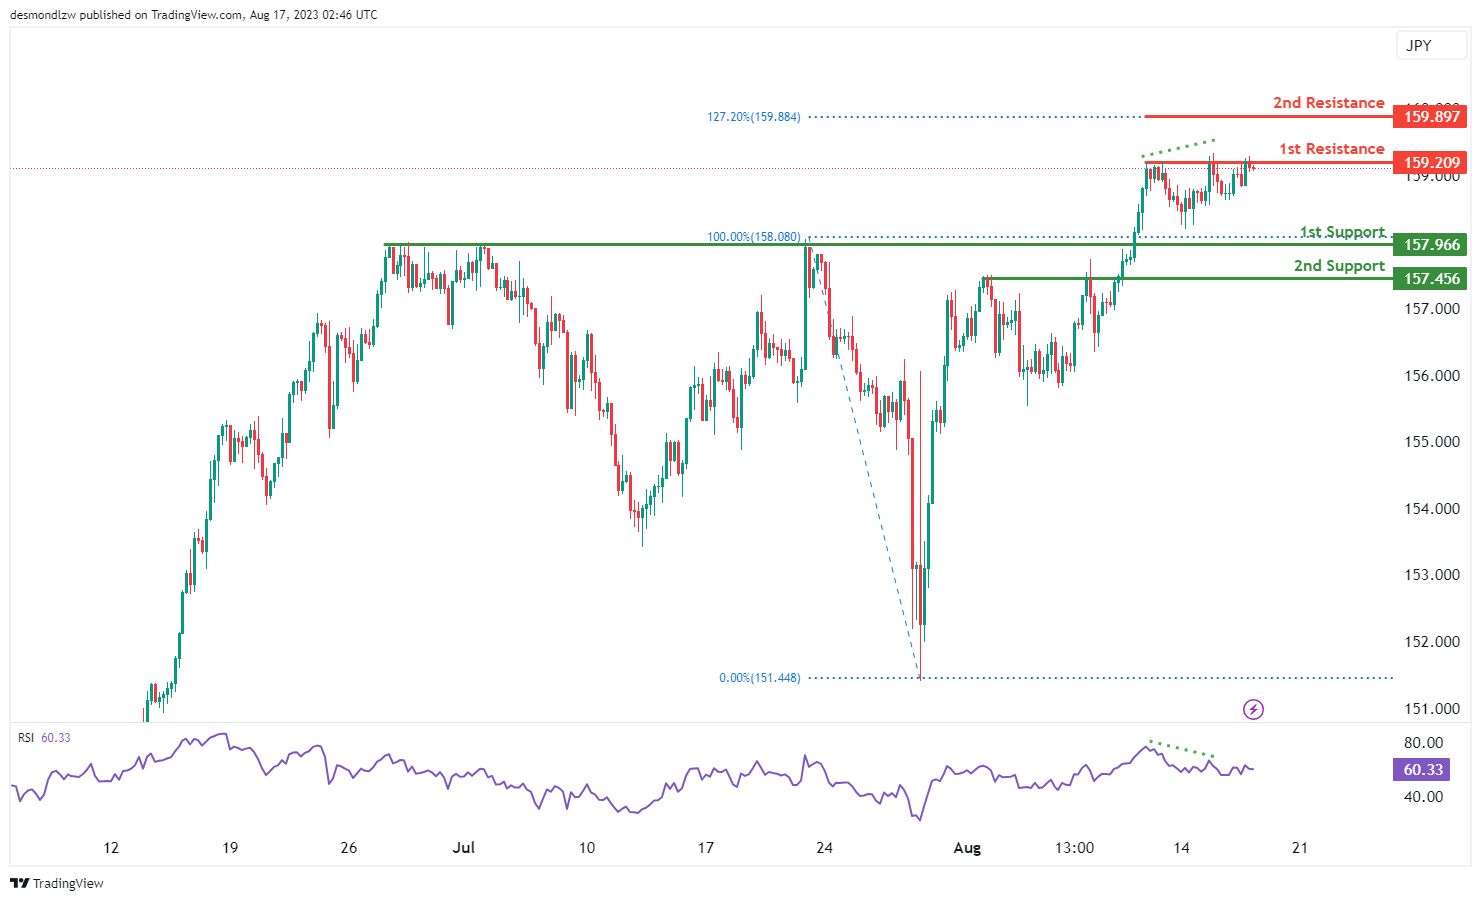
EUR/JPY:
The EUR/JPY chart demonstrates a bearish overall momentum. There is a potential for a bearish reaction off the 1st resistance level, leading to a drop towards the 1st support level.
The 1st support is located at 157.96 and is considered advantageous due to its pullback support characteristics. Furthermore, the 2nd support at 157.45 is also seen as a valuable level because of its pullback support characteristics.
On the resistance side, the 1st resistance level at 159.20 is noteworthy as it represents a multi-swing high resistance. Additionally, the 2nd resistance at 159.89 is significant due to its association with the 127.20% Fibonacci Extension.
Furthermore, the Relative Strength Index (RSI) is also displaying bearish divergence versus price, suggesting that a reversal might occur soon. This could indicate a potential shift in the momentum of the chart.
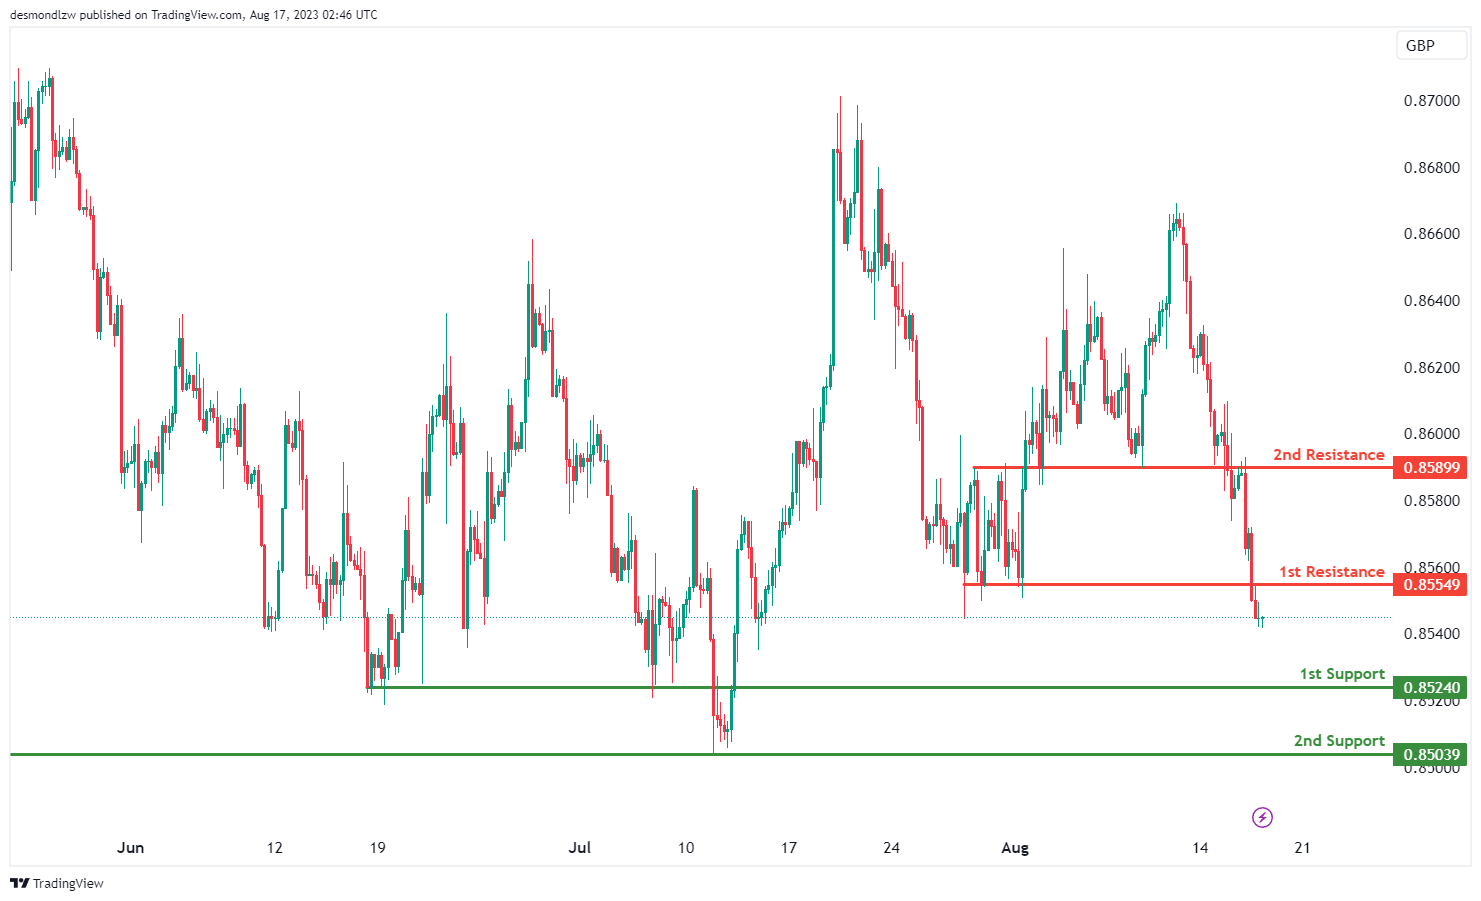
EUR/GBP:
The EUR/GBP chart indicates a bearish overall momentum. There is a potential for a bearish continuation towards the 1st support level.
The 1st support is situated at 0.8524 and is considered advantageous due to its overlap support characteristics. Additionally, the 2nd support at 0.8503 is also viewed as a valuable level because of its overlap support.
On the resistance side, the 1st resistance level at 0.8554 is noteworthy as it represents a pullback resistance. Furthermore, the 2nd resistance at 0.8589 is also seen as significant due to its overlap resistance characteristics. This configuration suggests potential levels where the price might encounter obstacles in its movement.
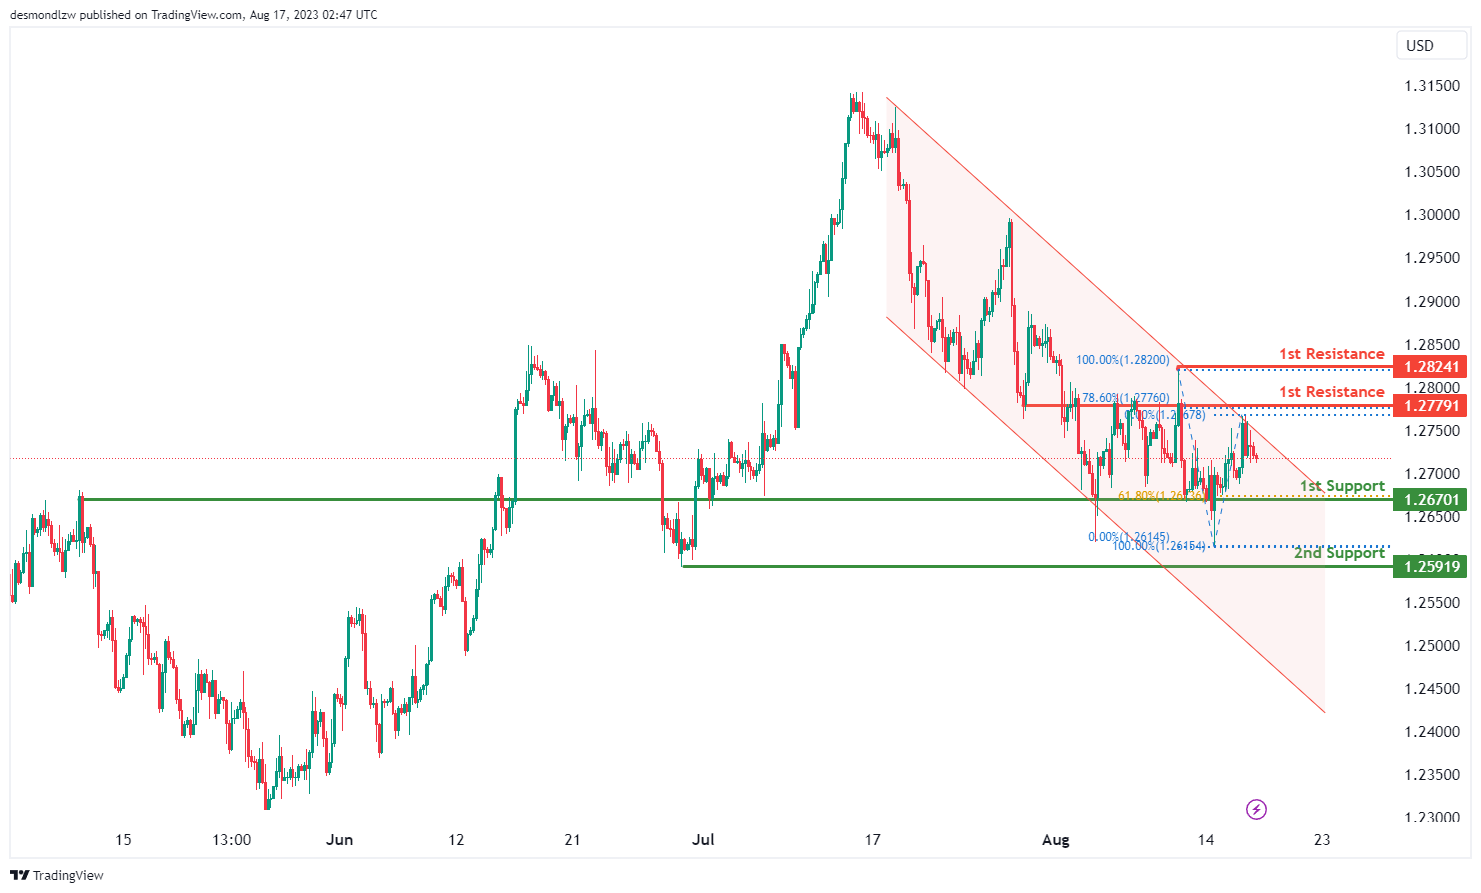
GBP/USD:
The GBP/USD chart currently maintains a bearish momentum, as indicated by its position within a descending channel. This channel pattern suggests a potential for the ongoing downward movement to persist due to the prevailing bearish trend.
Given this bearish context, there’s a likelihood of a bearish continuation towards the 1st support at 1.2670, which holds significance as an overlap support and aligns with the 61.80% Fibonacci retracement level.
Furthermore, the 2nd support at 1.2591 adds strength as a swing low support, contributing to the potential support levels.
On the resistance side, the 1st resistance at 1.2779 serves as a pullback resistance, reinforced by the presence of the 78.60% Fibonacci retracement level. The 2nd resistance at 1.2824 is identified as a swing high resistance, further contributing to the potential resistance levels.
Overall, the chart’s configuration aligns with the bearish momentum within the descending channel pattern.
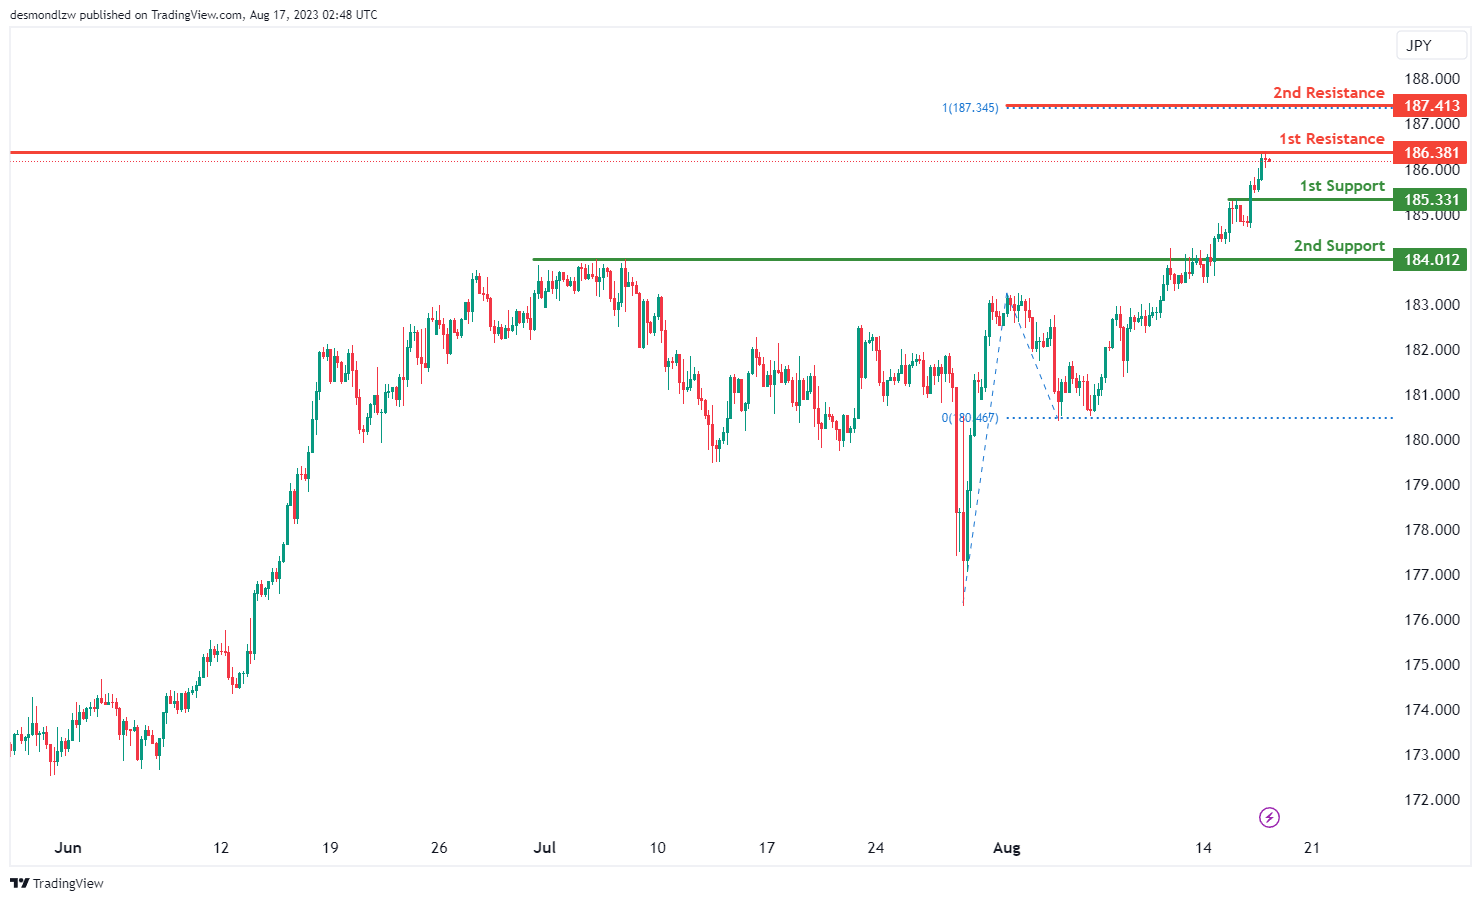
GBP/JPY:
The GBP/JPY chart displays a bearish overall momentum. There is a potential for a bearish reaction off the 1st resistance level, leading to a drop towards the 1st support level.
The 1st support is positioned at 185.33 and is considered advantageous due to its pullback support characteristics. Furthermore, the 2nd support at 184.01 is also seen as valuable because it represents a pullback support.
On the resistance side, the 1st resistance level at 186.38 is noteworthy as it represents a swing high resistance. Additionally, the 2nd resistance at 187.41 is significant due to its association with the 100% Fibonacci Projection. These levels indicate potential points where the price might encounter resistance or support in its movement.
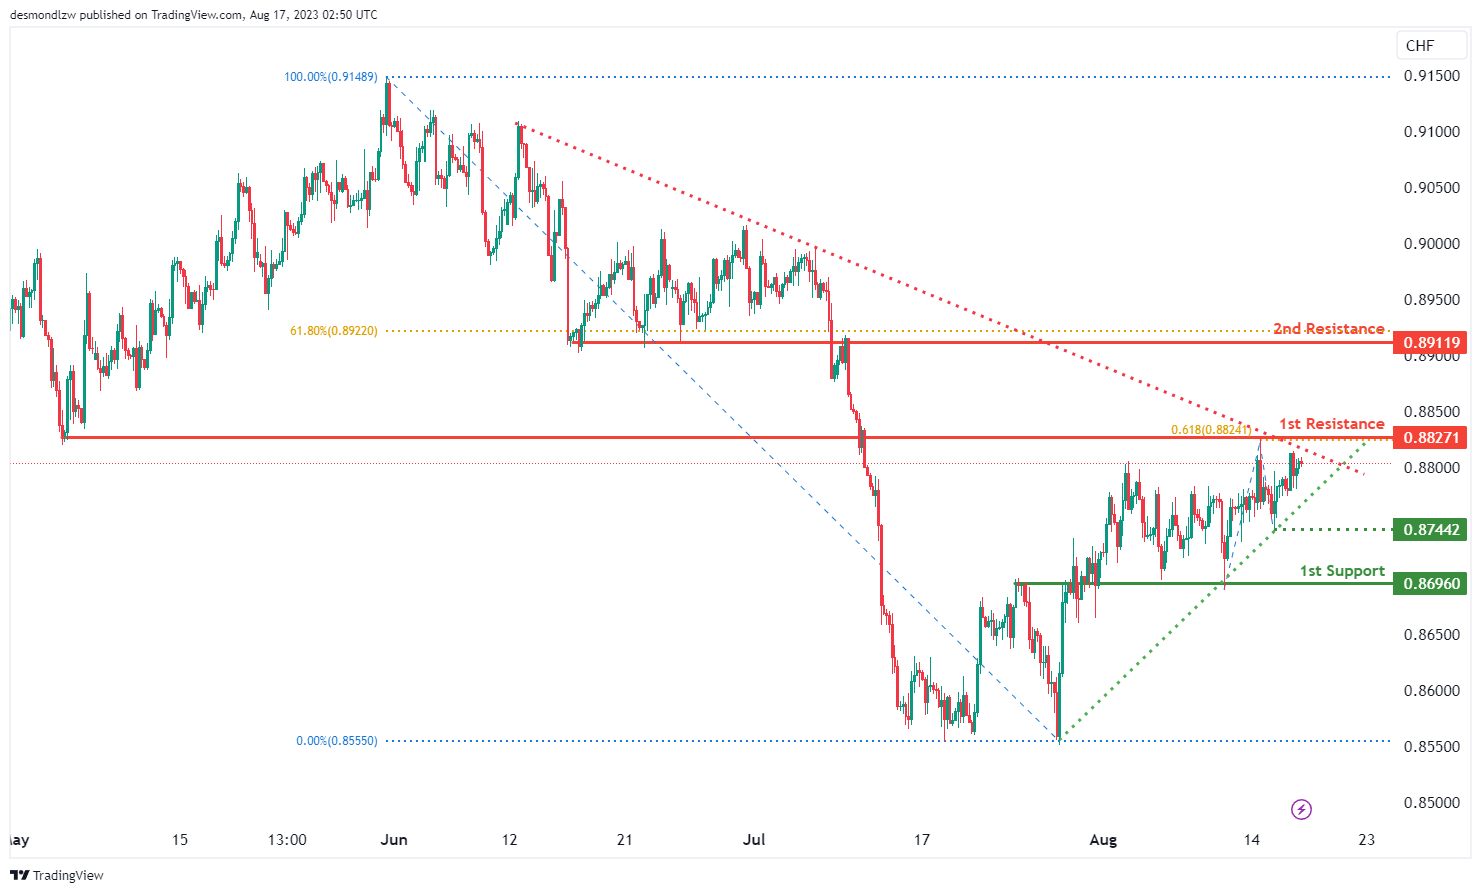
USD/CHF:
The USD/CHF chart currently maintains a neutral momentum, implying a lack of strong directional bias.
Given this neutral stance, there’s a possibility that the price might oscillate within the range defined by the 1st resistance at 0.8827 and the 1st support at 0.8696. These levels are significant, with the 1st support serving as an overlap support and the intermediate support at 0.8744 reinforcing the support structure. Similarly, the 1st resistance is an overlap resistance, while the 2nd resistance at 0.8911 is identified as a pullback resistance.
Adding to the analysis, the chart pattern indicates a symmetrical triangle formation, which typically signifies a period of consolidation before an imminent breakout or breakdown. If the price breaks above the upper trendline of the pattern, it could indicate a potential bullish breakout. Conversely, a break below the lower trendline might suggest a bearish breakdown.
Overall, the neutral momentum and the presence of the symmetrical triangle pattern indicate a potential for upcoming volatility and a decisive move in either direction.
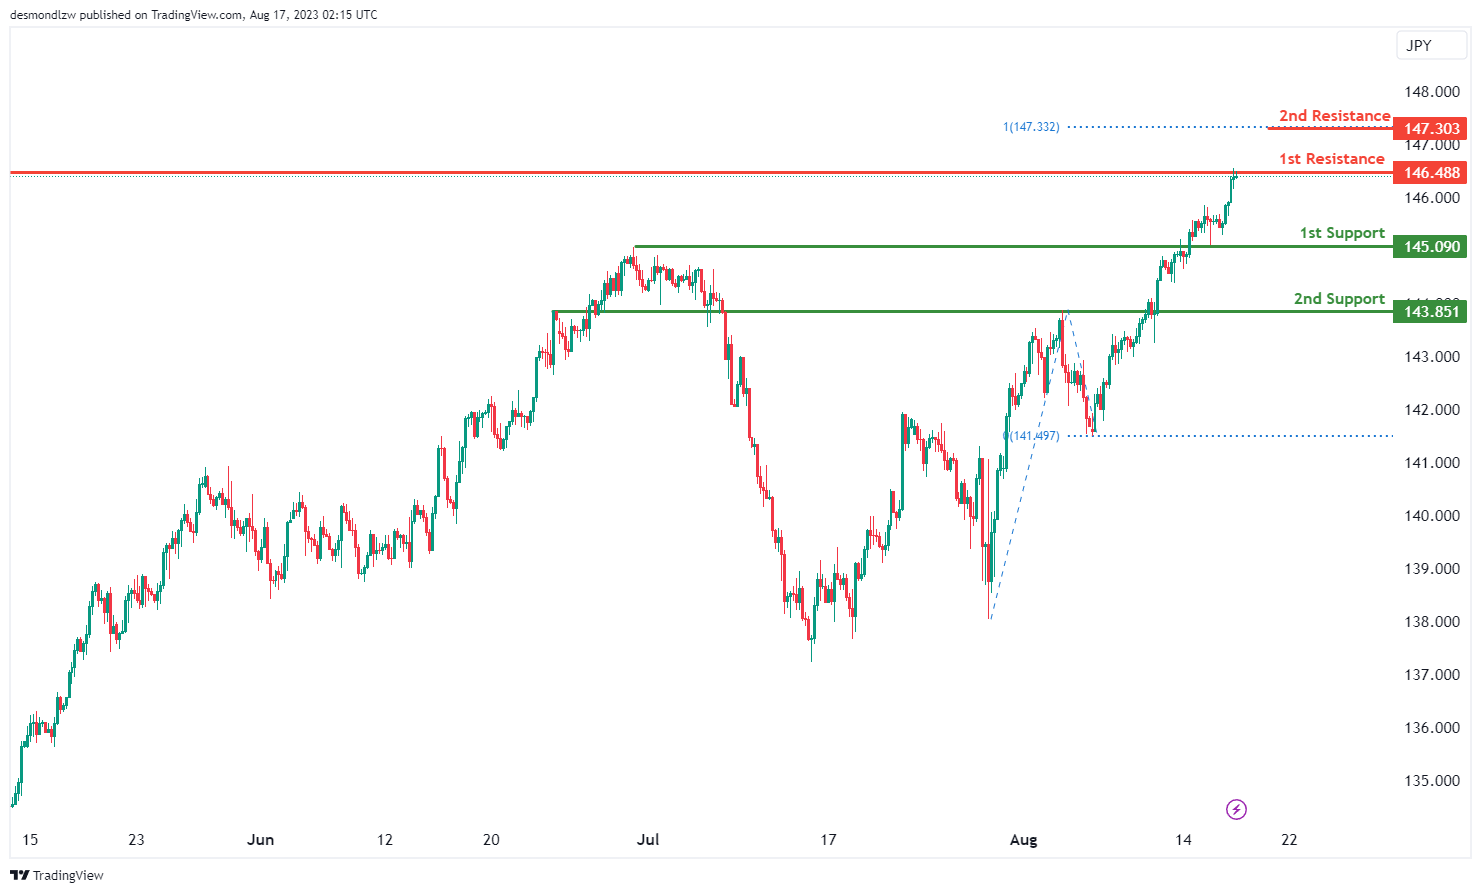
USD/JPY:
The USD/JPY chart currently exhibits a bearish momentum, suggesting a prevailing downward trend.
Given this bearish sentiment, a potential scenario could involve a bearish reaction as the price approaches the 1st resistance level at 146.48, followed by a drop towards the 1st support at 145.09. The significance of the 1st support lies in its classification as an overlap support, while the 2nd support at 143.85 gains importance as a pullback support.
On the resistance side, the 1st resistance at 146.48 is noted as a swing high resistance. Additionally, the 2nd resistance at 147.30 is categorized as an overlap resistance, reinforcing its potential impact as a barrier to further upward movement.
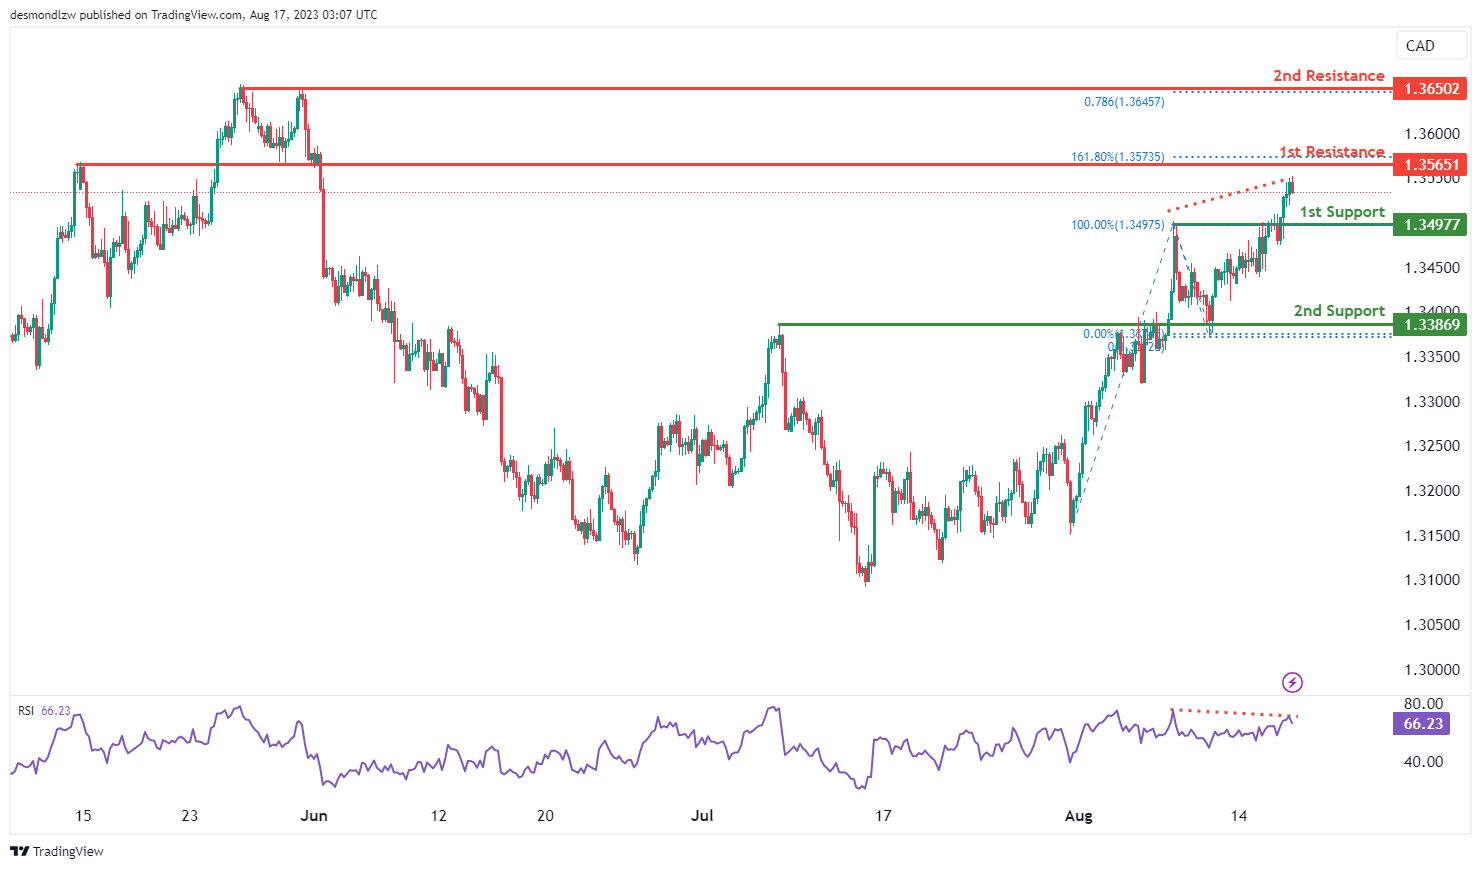
USD/CAD:
The USD/CAD chart currently shows a bearish momentum, indicating a prevailing downward trend. There’s a potential scenario where the price could continue its bearish movement towards the 1st support at 1.3498, which is identified as an overlap support. The 2nd support at 1.3387 is also identified as an overlap support level.
To the upside, the 1st resistance at 1.3565 is identified as an overlap resistance level that aligns with the 161.80% Fibonacci extension level while the 2nd resistance at 1.3650 is identified as a multi-swing-high that aligns with the 78.60% Fibonacci projection level.
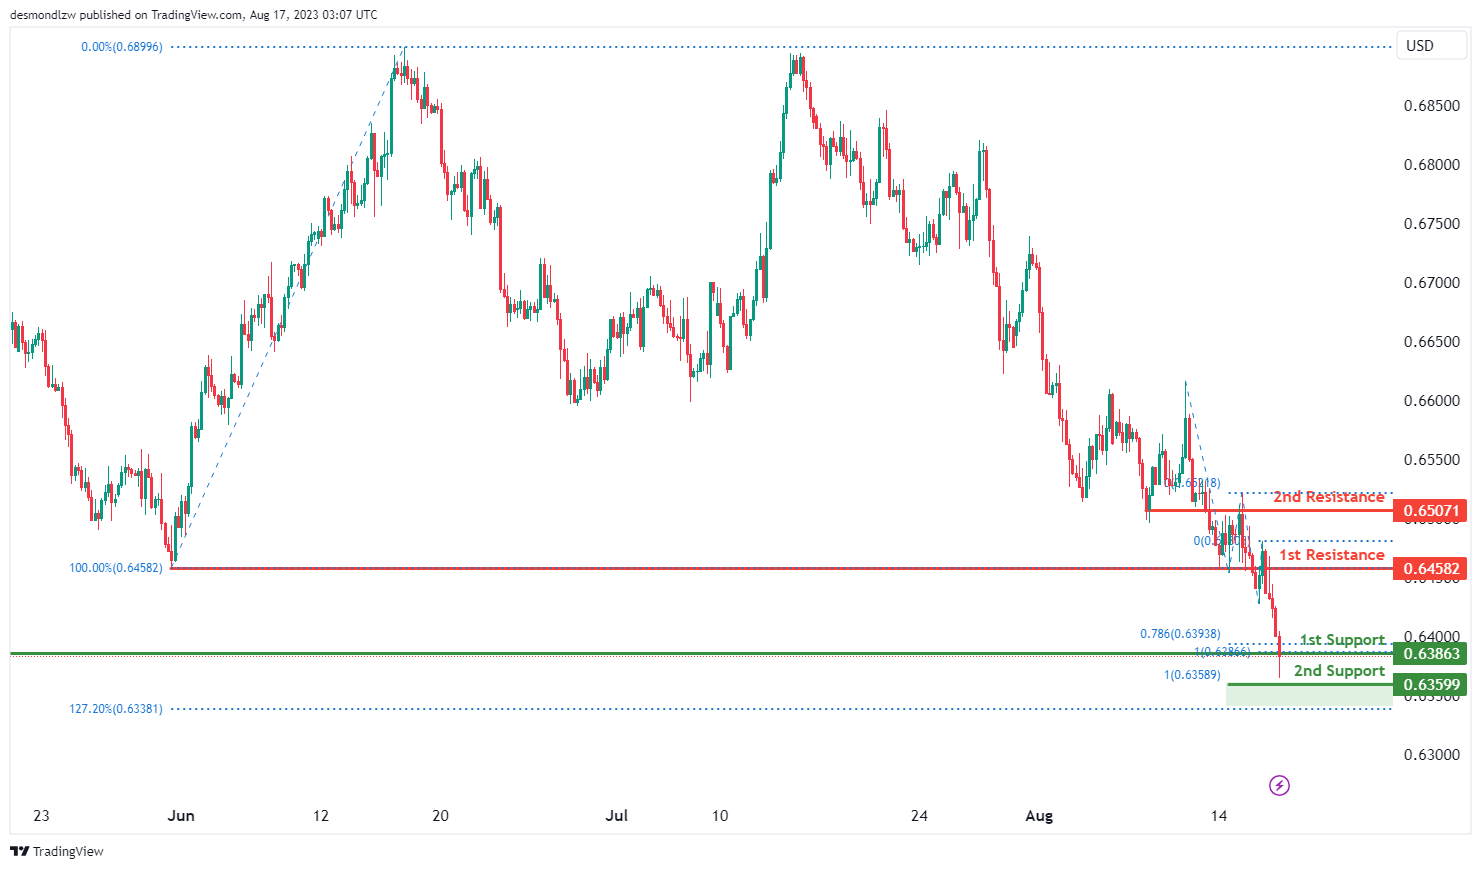
AUD/USD:
The current trend in the AUD/USD chart is bearish, with potential for a further downward movement. The price may break below the 1st support and make a potential move towards the 2nd support level.
The 1st support level at 0.6386, which is identified as a pullback support, is reinforced by a confluence of Fibonacci levels i.e. the 78.60% and the 100.00% projection levels. The 2nd support at 0.6359 adds to the support area with the presence of the 100.00% Fibonacci projection and the 127.20% Fibonacci extension levels, which is also identified as a Fibonacci confluence.
To the upside, the 1st resistance level at 0.6458 is identified as an overlap support while the 2nd resistance at 0.6507 is also identified as an overlap resistance.
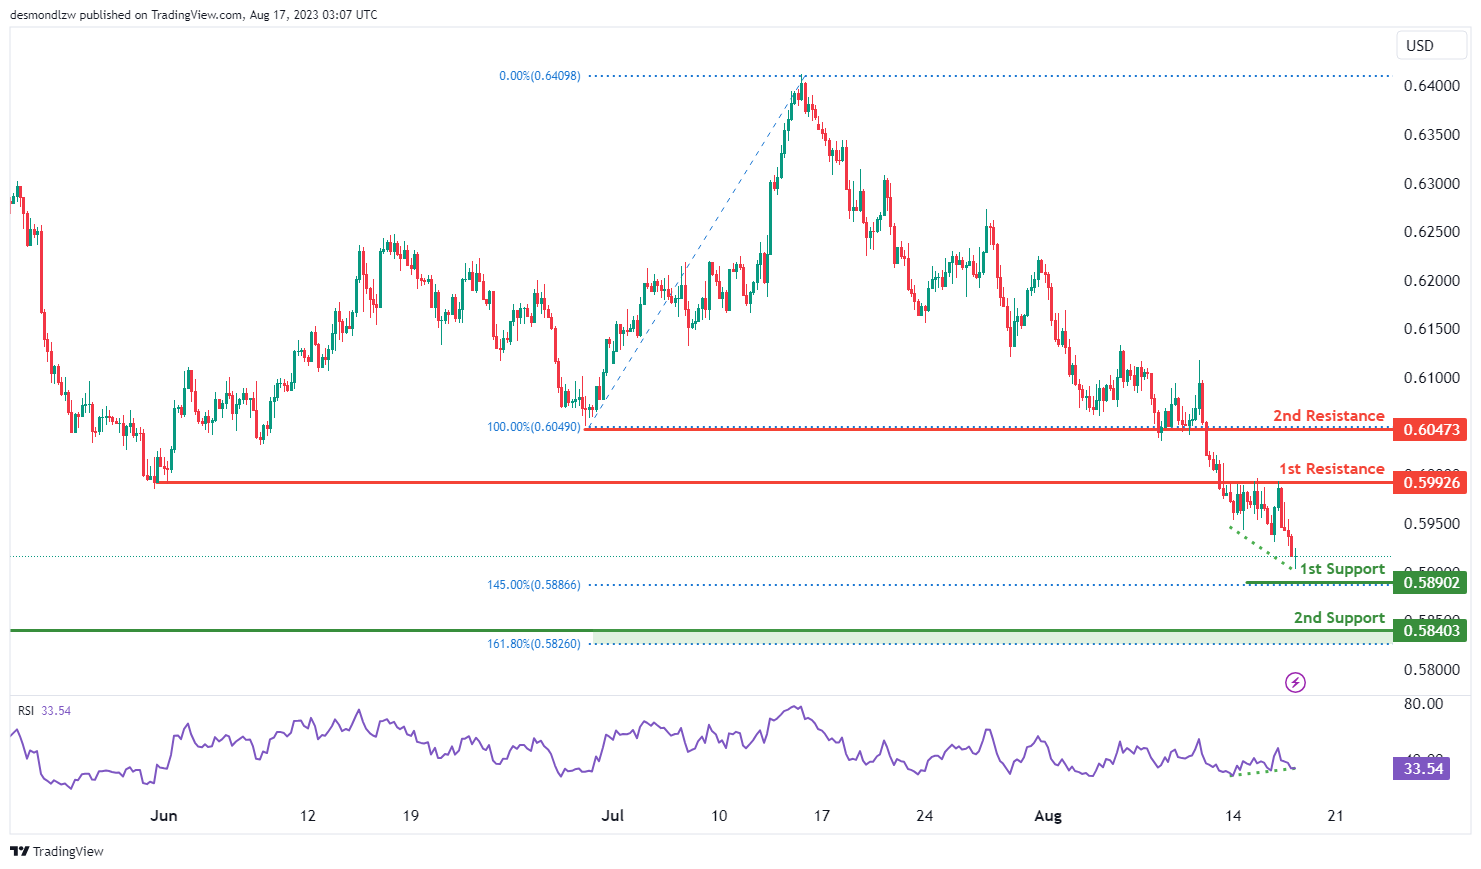
NZD/USD
The current trend in the NZD/USD chart shows a weak bullish movement with low confidence. There is potential for the price to continue its upward movement towards the 1st resistance level at 0.5993. Additionally, the RSI indicator shows bullish divergence, suggesting a potential bounce in the near future.
The 1st support at 0.5890 is supported by the presence of the 145.00% Fibonacci extension level while the 2nd support at 0.5840 is supported by the presence of the 161.80% Fibonacci extension level.
To the upside, the 1st resistance at 0.5993 is an overlap resistance level while the 2nd resistance at 0.6047 is also identified as an overlap resistance.
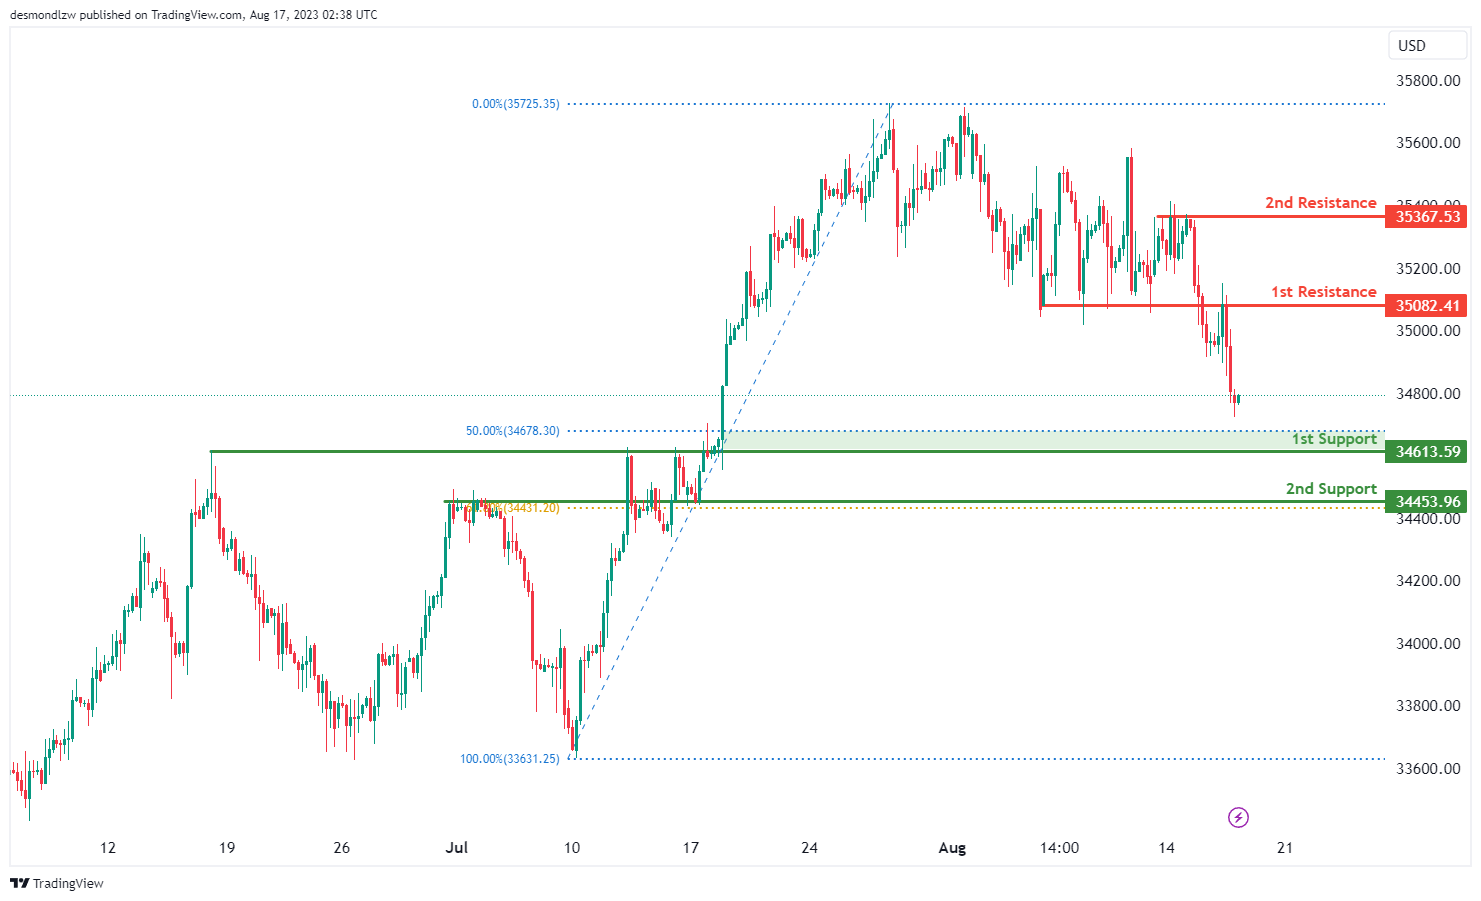
DJ30:
The DJ30 chart displays a bearish overall momentum. There is a potential for a bearish continuation towards the 1st support level. The 1st support is positioned at 34613.59 and is considered advantageous due to its pullback support, as well as a Fibonacci confluence of a 50% Fibonacci Retracement and a 100% Fibonacci Projection.
Additionally, the 2nd support at 34453.96 is also seen as a valuable level due to its overlap support and a 61.80% Fibonacci Retracement.
On the resistance side, the 1st resistance level at 35082.41 is notable as it represents a pullback resistance. Moreover, the 2nd resistance at 35367.53 is also significant due to its multi-swing high resistance characteristics.
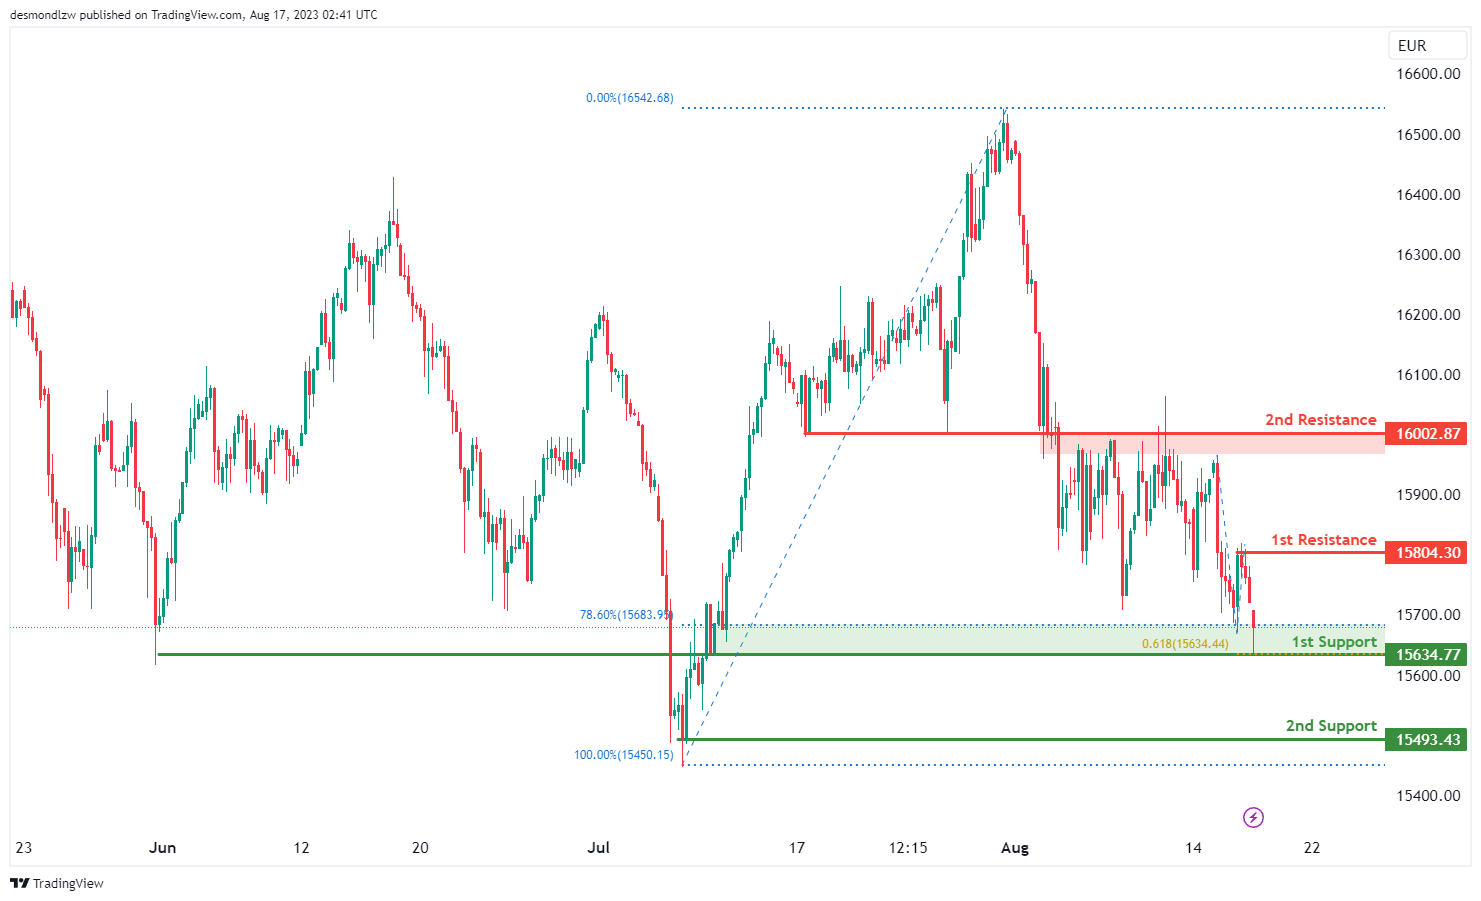
GER30:
The GER30 chart indicates a bullish overall momentum. There is a potential for a bullish bounce off the 1st support level, leading towards the 1st resistance.
The 1st support is positioned at 15634.77 and is considered favorable due to its overlap support, along with a Fibonacci confluence of a 78.60% Fibonacci Retracement and a 61.80% Fibonacci Projection.
Furthermore, the 2nd support at 15493.43 is viewed as a valuable level due to its swing low support characteristics.
On the resistance side, the 1st resistance level at 15804.30 is noteworthy as it represents an overlap resistance. Additionally, the 2nd resistance at 16002.87 is significant due to its pullback resistance characteristics.
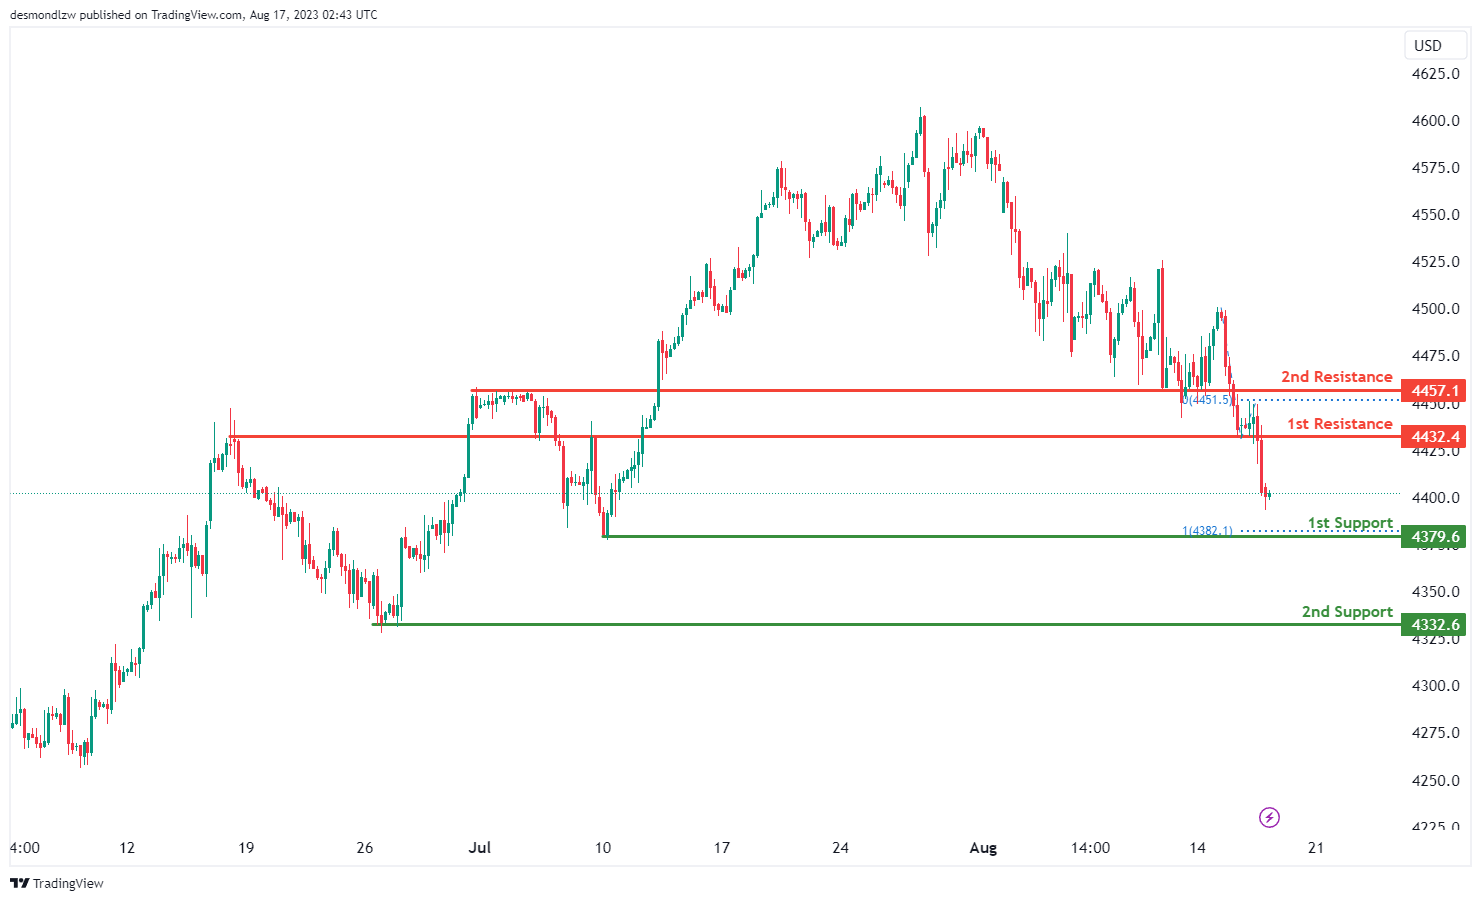
US500
The US500 chart indicates a bearish overall momentum. There is a potential for a bearish continuation towards the 1st support level. The 1st support is situated at 4379.6 and is considered advantageous due to its swing low support characteristics, accompanied by a 100% Fibonacci Projection.
Furthermore, the 2nd support at 4332.6 is also considered a valuable level because of its swing low support characteristics.
On the resistance side, the 1st resistance level at 4432.4 is noteworthy as it represents an overlap resistance. Additionally, the 2nd resistance at 4457.1 is also significant due to its overlap resistance characteristics.
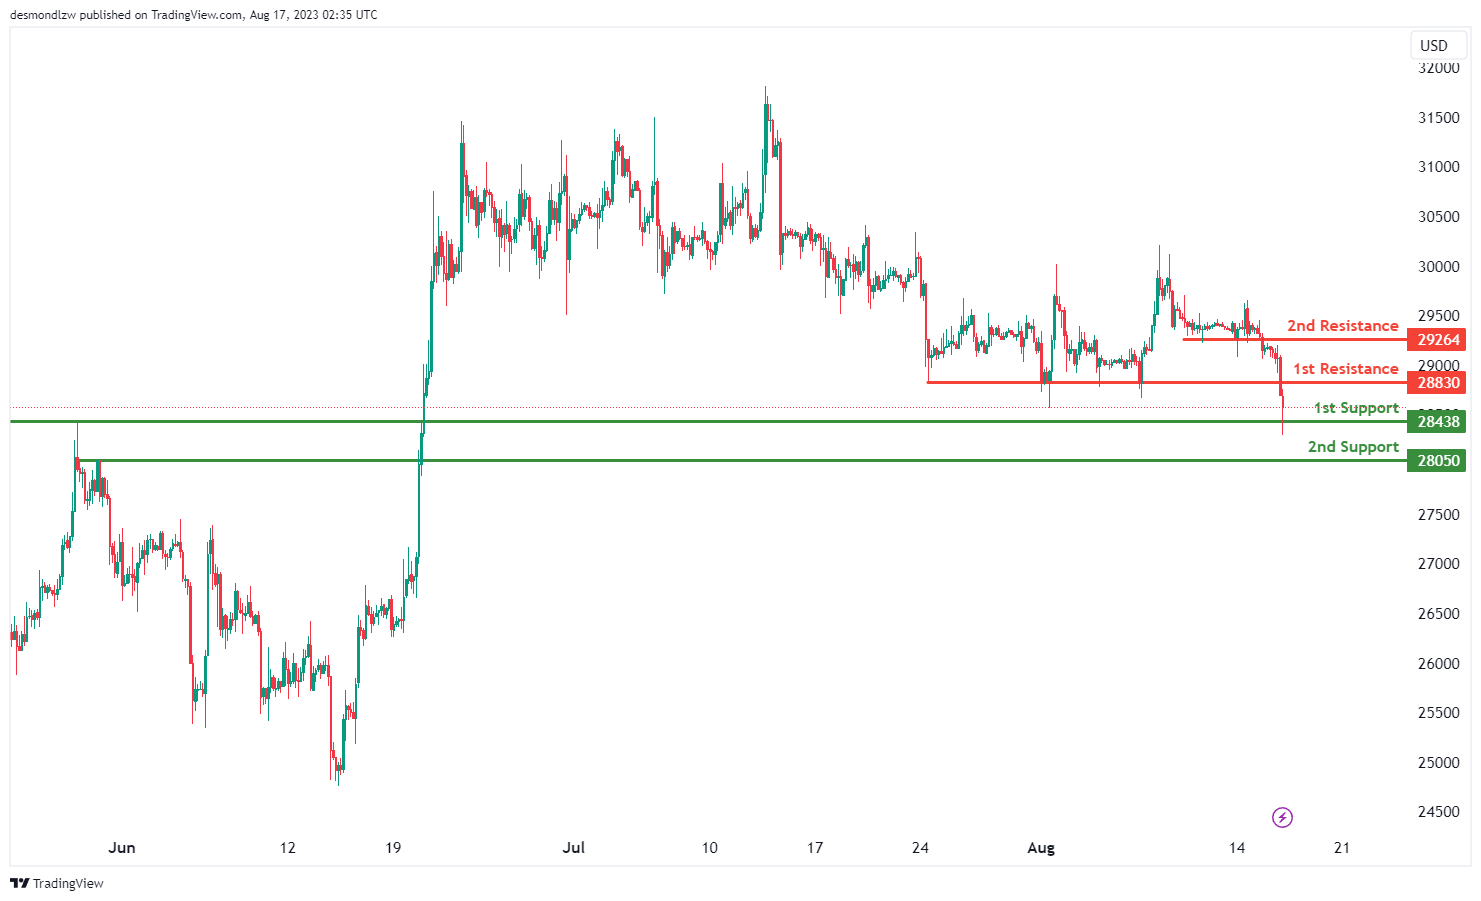
BTC/USD:
The BTC/USD chart displays a bearish overall momentum. There is a potential for a bearish continuation towards the 1st support level. The 1st support is situated at 28438 and is considered significant due to its overlap support characteristics. Furthermore, the 2nd support at 28050 is viewed as advantageous because it represents a pullback support.
On the resistance side, the 1st resistance level at 28830 is notable as it presents a pullback resistance. Additionally, the 2nd resistance at 29264 is also considered significant due to its pullback resistance characteristics.
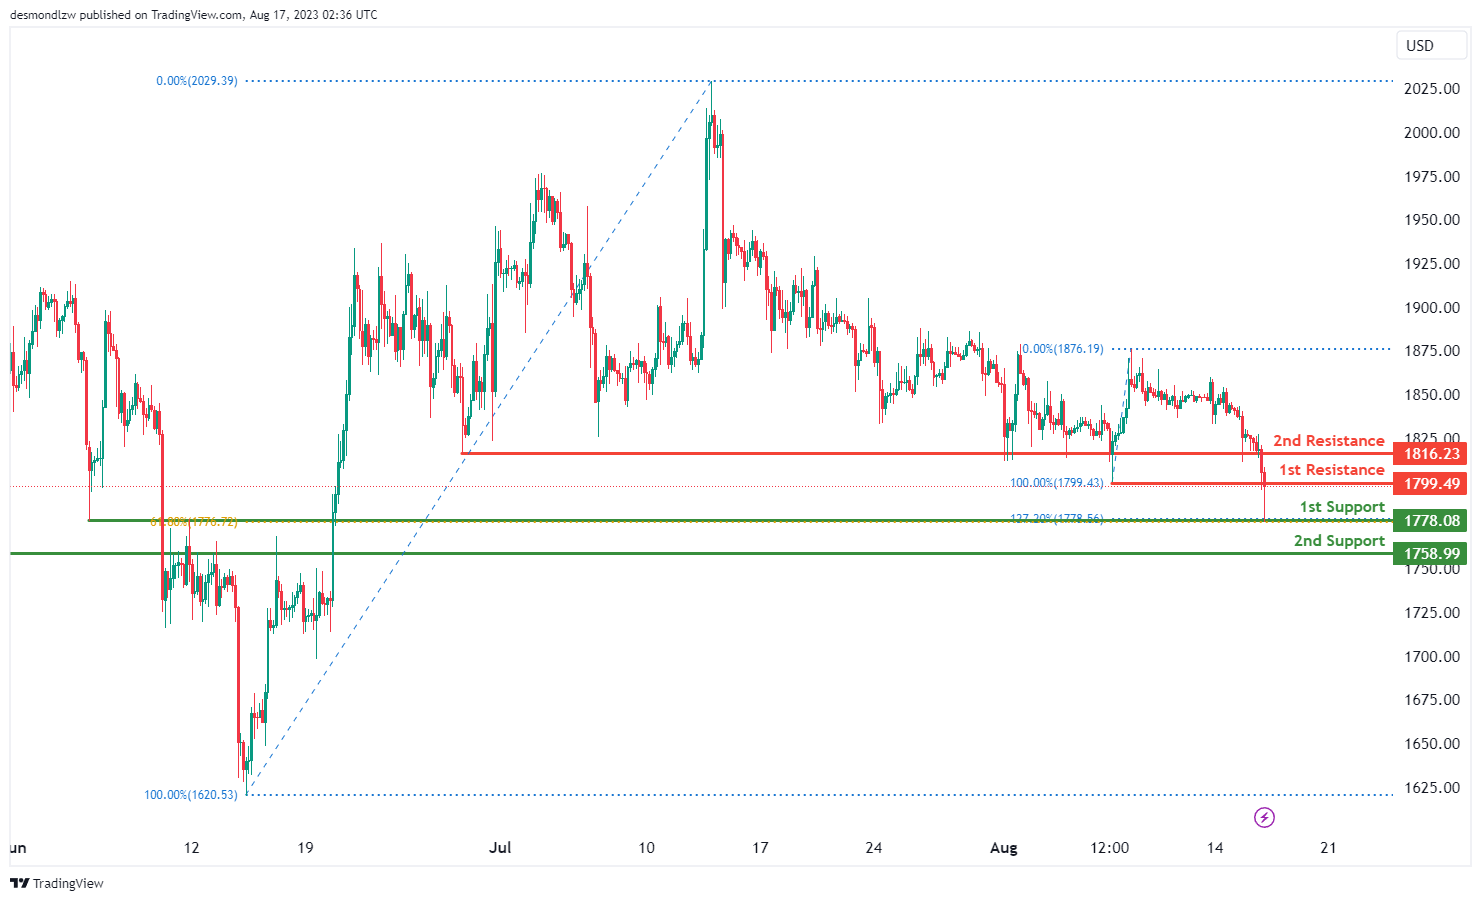
ETH/USD:
The ETH/USD chart shows a bearish overall momentum. There is a potential for a bearish continuation towards the 1st support level. The 1st support is positioned at 1778.08 and is considered favorable due to its overlap support, along with a Fibonacci confluence of a 127.20% Fibonacci Extension and a 61.80% Fibonacci Retracement.
Furthermore, the 2nd support at 1758.99 is also considered good due to its overlap support characteristics.
On the resistance side, the 1st resistance level at 1799.49 is noteworthy as it represents a pullback resistance. Additionally, the 2nd resistance at 1816.23 is also seen as significant due to its pullback resistance characteristics.
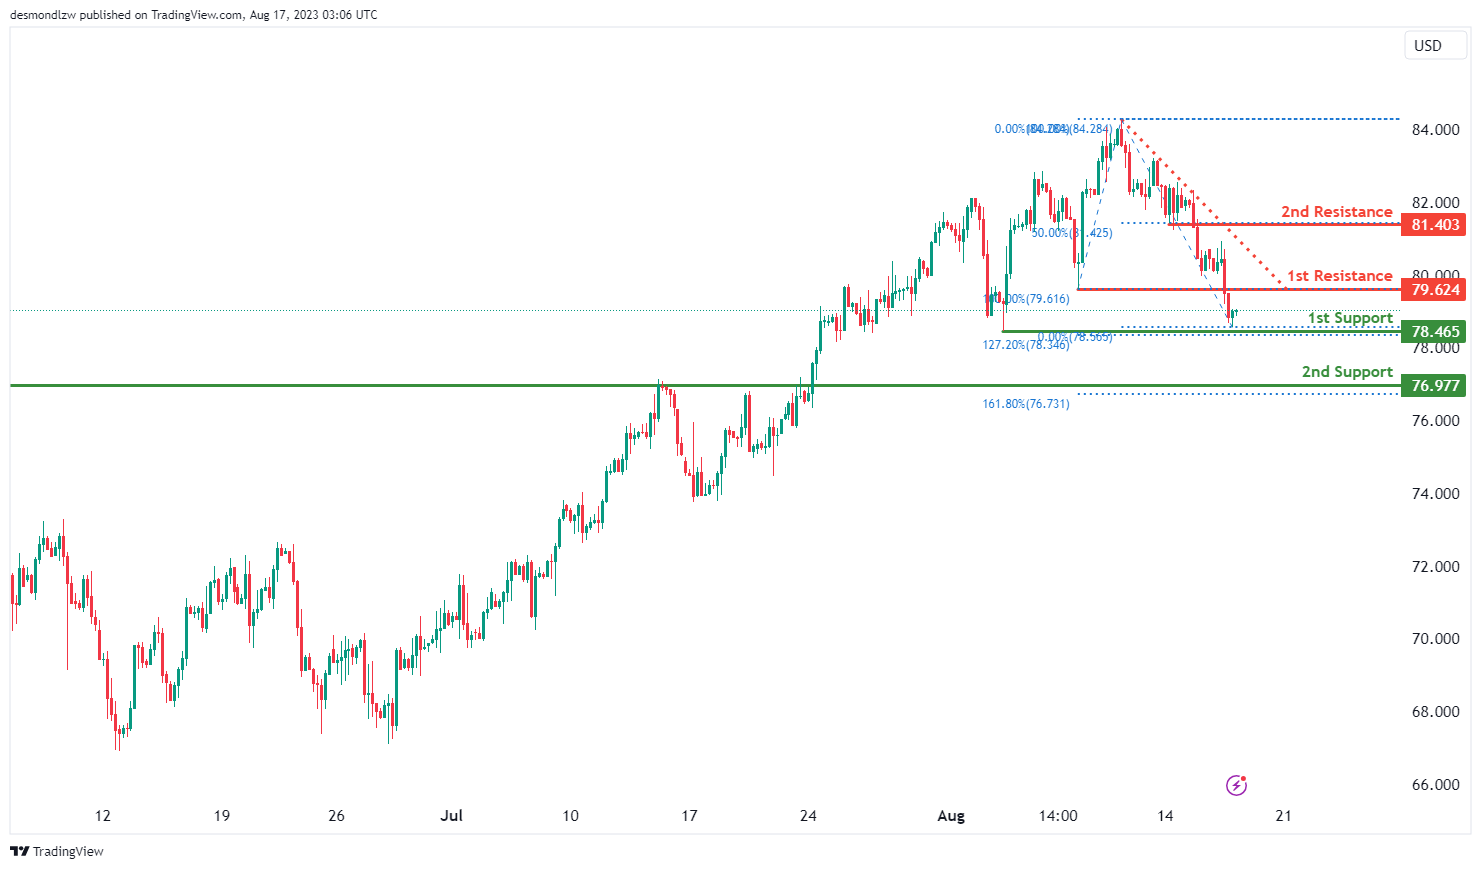
WTI/USD:
The WTI/USD chart is currently displaying a neutral momentum, indicating a lack of clear directional trend. There is a potential scenario where the price could fluctuate between the 1st resistance and the 1st support.
The 1st support level at 78.47 is identified as an overlap support that aligns with the 127.20% Fibonacci extension level. The 2nd support at 76.98 is also identified as an overlap support that aligns with the 161.80% Fibonacci extension level.
To the upside, the 1st resistance level at 79.62 is identified as an overlap resistance while the 2nd resistance at 81.40 is identified as a pullback resistance that aligns with the 50.00% Fibonacci retracement level.
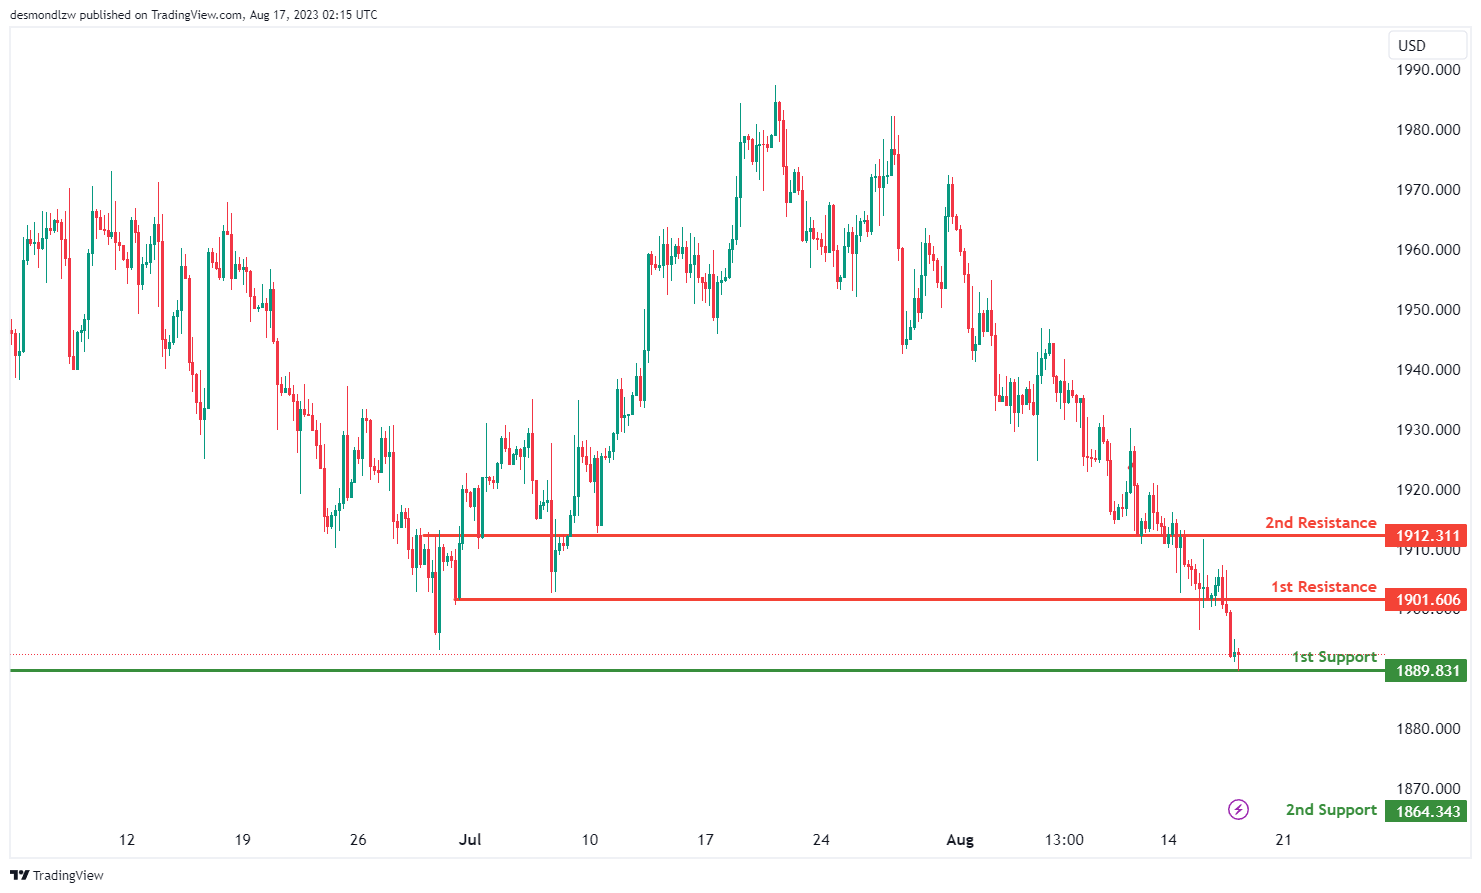
XAU/USD (GOLD):
The XAU/USD chart currently demonstrates a bullish momentum, indicating a prevailing upward trend.
Within this context, a potential scenario involves a bullish bounce off the 1st support level at 1896.25, categorized as an overlap support. This bounce could potentially lead the price towards the 1st resistance level at 1901.60, which is considered a pullback resistance.
The 2nd support at 1864.34 is noted as a pullback support, reinforcing the overall support structure. Similarly, the 2nd resistance at 1912.31 is identified as an overlap resistance, further enhancing its potential significance as a barrier to further upward movement.


