
DXY:
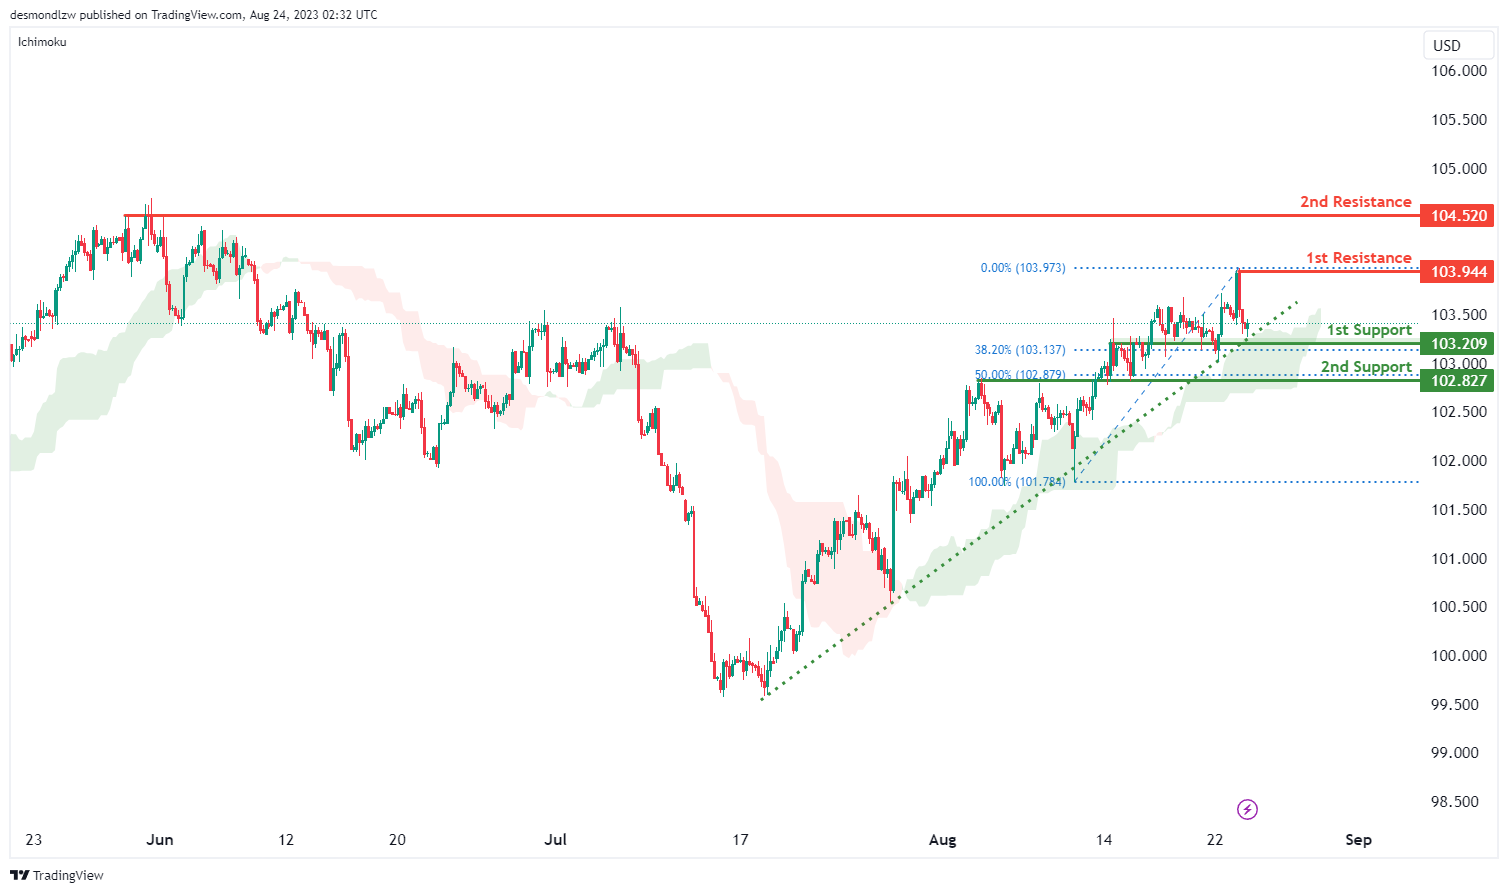
The DXY chart currently exhibits a bullish momentum, indicating a prevalent upward trend in the market.
This bullish momentum is supported by the fact that the price is above a major ascending trend line, signifying the potential for further upward movement. Additionally, the price remains above the bullish Ichimoku cloud, contributing to the overall positive momentum.
In this context, there’s a possibility that the price could experience a bullish rebound upon reaching the 1st support level at 103.20. This support level gains significance as an overlap support and aligns with the 23.60% Fibonacci Retracement level. Similarly, the 2nd support at 102.82 holds importance as an overlap support and corresponds to the 50% Fibonacci Retracement level.
On the resistance side, the 1st resistance level at 103.92 stands out as a swing high resistance, potentially posing a hurdle to further upward movement. Similarly, the 2nd resistance at 104.50 gains significance as a multi-swing high resistance.
EUR/USD:
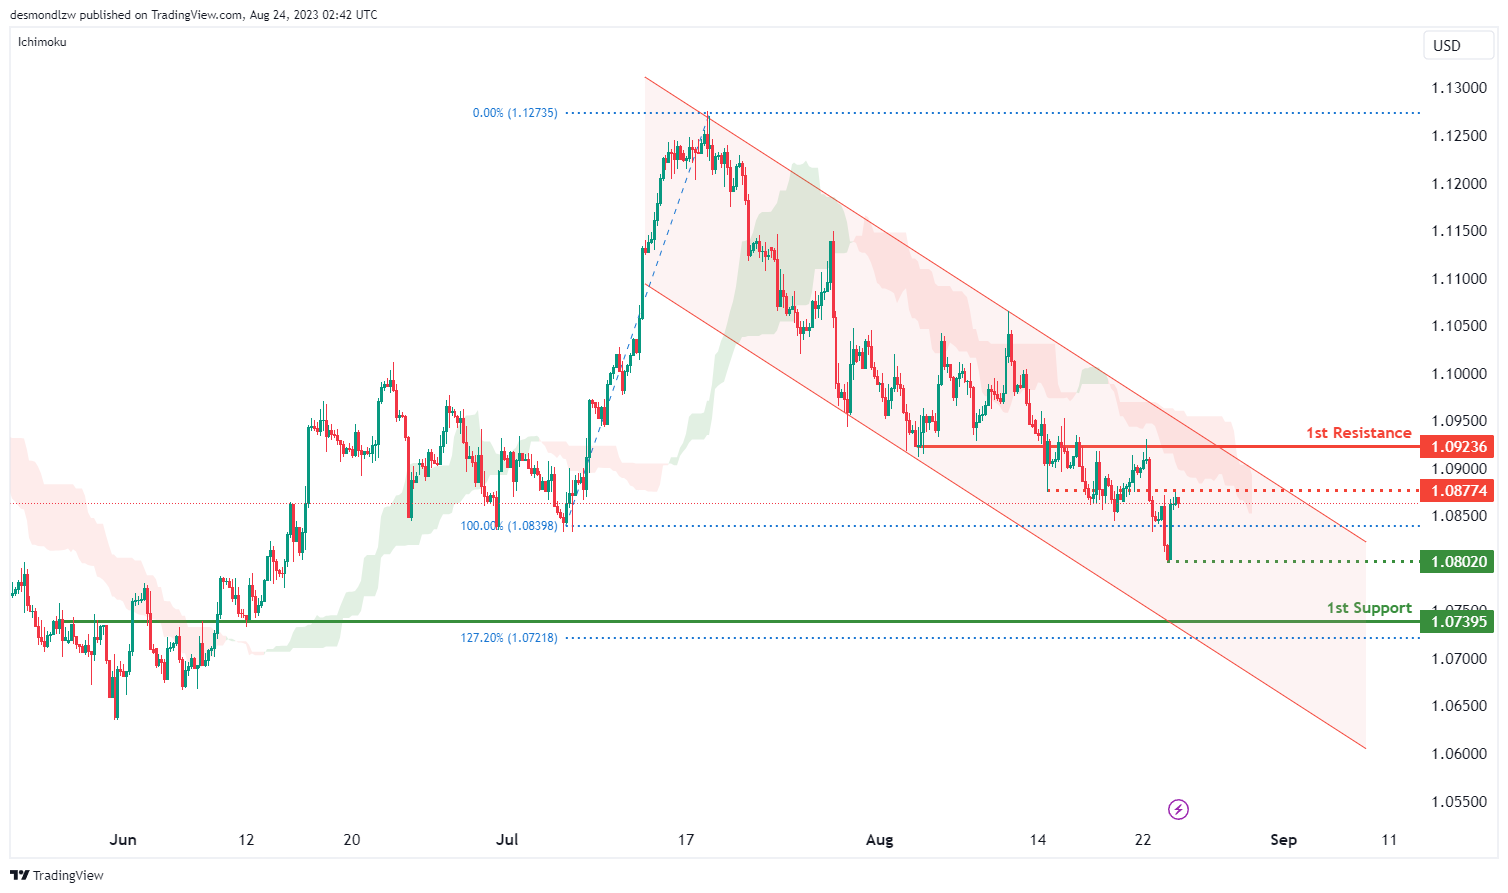
The EUR/USD chart currently demonstrates a bearish momentum, characterized by its position within a descending channel. This channel suggests a likelihood of continued downward movement due to the prevailing bearish momentum.
In this context, there’s a potential scenario where the price could undergo a bearish continuation towards the 1st support level at 1.0739. This support level is notable as an overlap support and is reinforced by the presence of the 127.20% Fibonacci Extension.
Additionally, an intermediate support level at 1.0802 holds significance due to its identification as a swing low support, potentially adding to the potential support structure.
On the resistance side, the 1st resistance at 1.0923 stands out as an overlap resistance, potentially acting as a barrier to upward price movement. Similarly, the intermediate resistance level at 1.0877 is significant as another overlap resistance.
EUR/JPY:
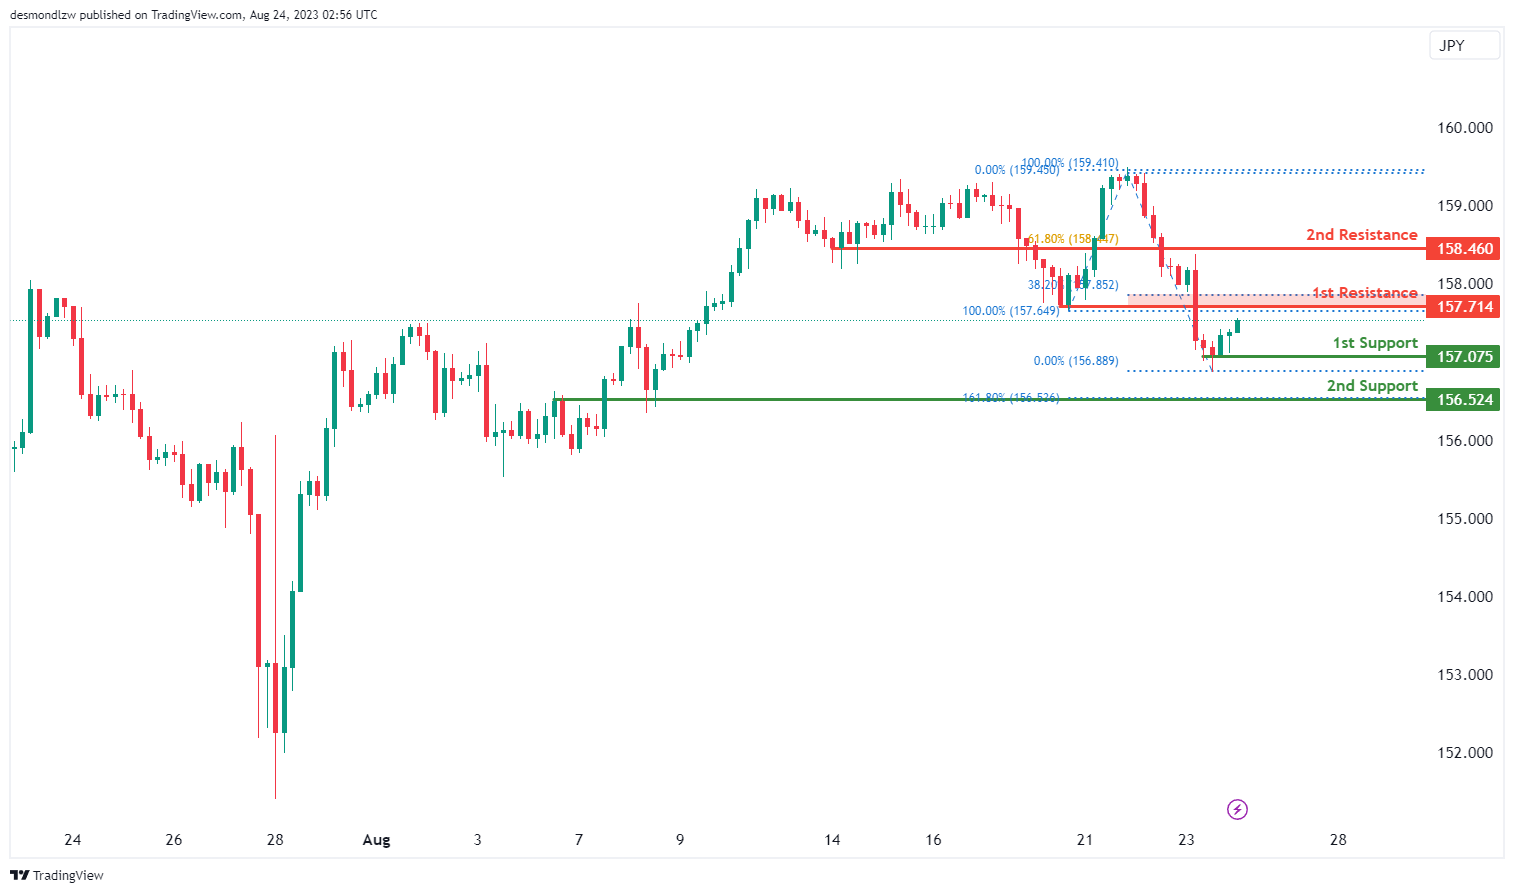
The EUR/JPY chart’s momentum indicates a bearish trend, suggesting a tendency for downward movement.
In this context, there’s a potential scenario where the price could experience a bearish reaction off the 1st resistance at 157.71, leading to a potential drop towards the 1st support at 157.07.
The 1st support at 157.07 holds significance as a multi-swing low support, suggesting that it may act as a level where price could find stability or potentially rebound. The 2nd support at 156.52 is identified as an overlap support and also aligns with the 161.80% Fibonacci Extension level, which adds to its potential significance as a potential bounce point.
Conversely, the 1st resistance at 157.71 is classified as a pullback resistance, indicating that it might restrict upward movements. The 2nd resistance at 158.46 is recognized as a pullback resistance and is associated with the 61.80% Fibonacci Retracement level, reinforcing its potential as a barrier to upward price progress.
Additionally, the intermediate support at 159.20 is considered a pullback support, potentially influencing price reactions.
EUR/GBP:
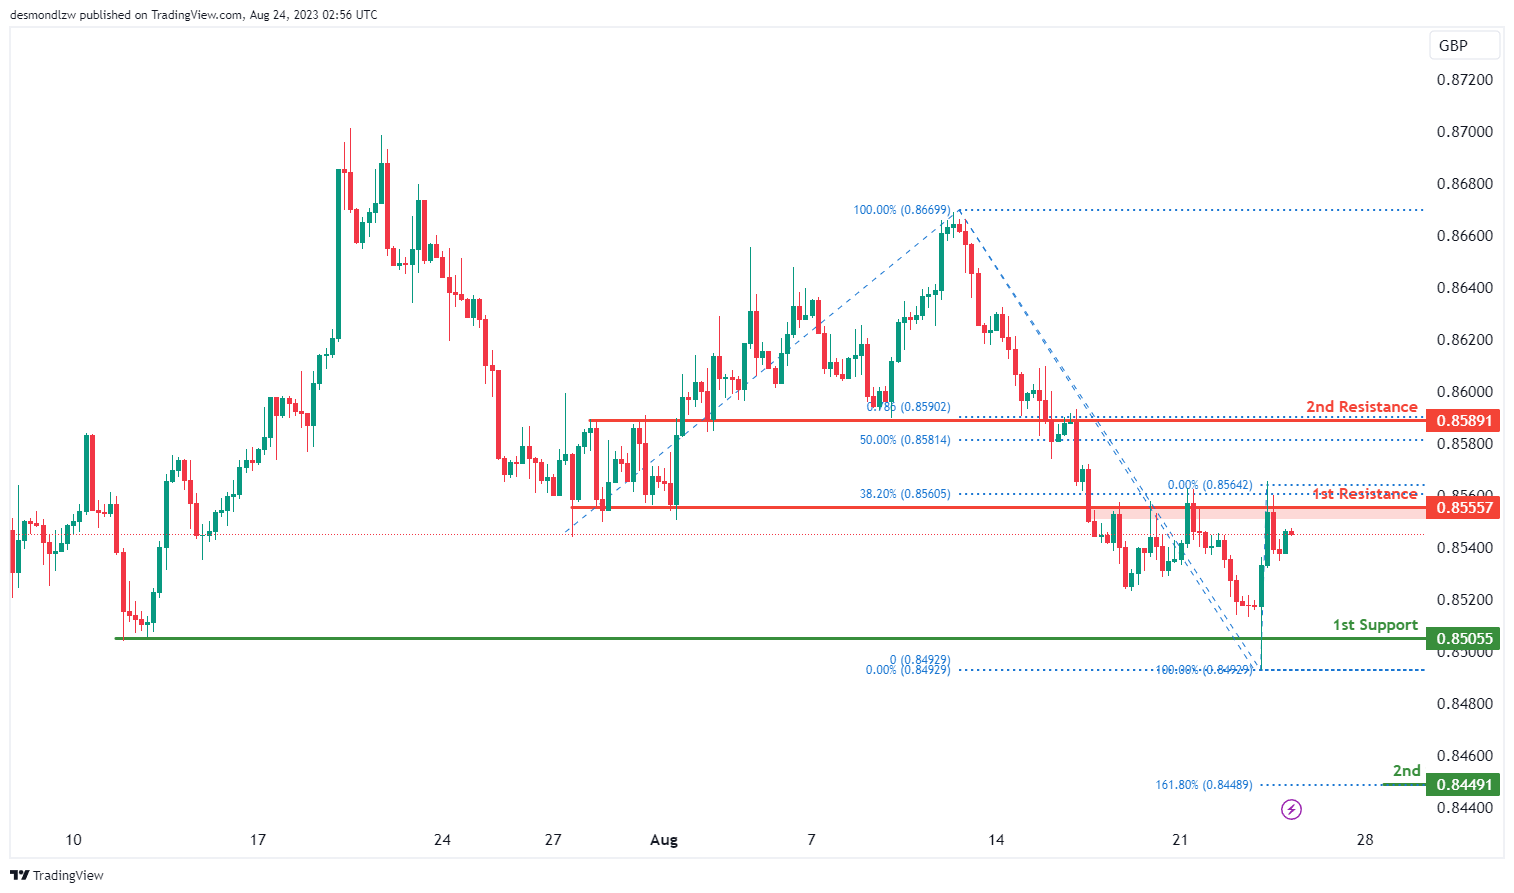
The EUR/GBP chart’s momentum indicates a bearish trend, suggesting a tendency for downward movement.
In this context, there’s a potential scenario where the price could continue its bearish movement towards the 1st support at 0.8505.
The 1st support at 0.8505 is identified as a multi-swing low support, indicating that it may play a significant role in providing a potential level of price stabilization or even a rebound. The 2nd support at 0.8449 is recognized as a swing low support and aligns with the 161.80% Fibonacci Extension level, which adds to its potential significance as a potential bounce point.
On the resistance side, the 1st resistance at 0.8555 is classified as an overlap resistance, implying that it could restrict upward movements. The 2nd resistance at 0.8589 is a pullback resistance and aligns with the 50% Fibonacci Retracement level, suggesting its potential to hinder upward price progress.
GBP/USD:
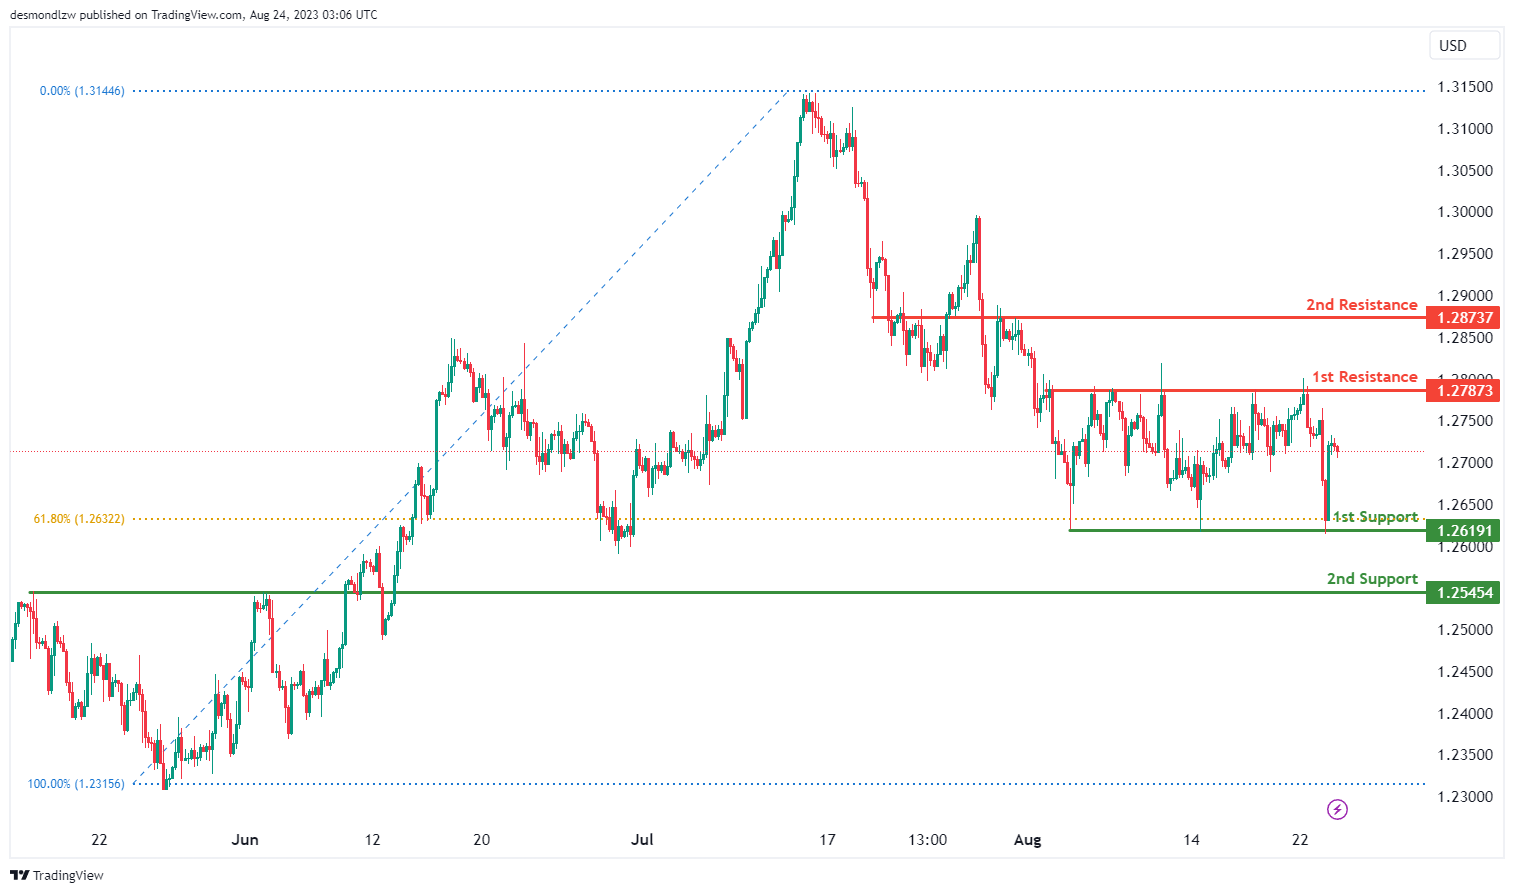
The GBP/USD chart currently reflects a neutral momentum, suggesting a lack of clear directional bias.
Within this context, there’s a potential scenario in which the price might exhibit fluctuations between the 1st support level at 1.2619 and the 1st resistance level at 1.2787.
The significance of the 1st support at 1.2619 is underlined by its identification as a multi-swing low support, with an additional reinforcement from the presence of the 61.80% Fibonacci Retracement.
On the other hand, the 2nd support at 1.2545 is noted as a pullback support, which could contribute to supporting the price during downward movements.
Regarding resistance, the 1st resistance at 1.2787 is considered a swing high resistance, which might act as a hurdle for upward price movement. Similarly, the 2nd resistance level at 1.2873 is significant due to its nature as an overlap resistance.
GBP/JPY:
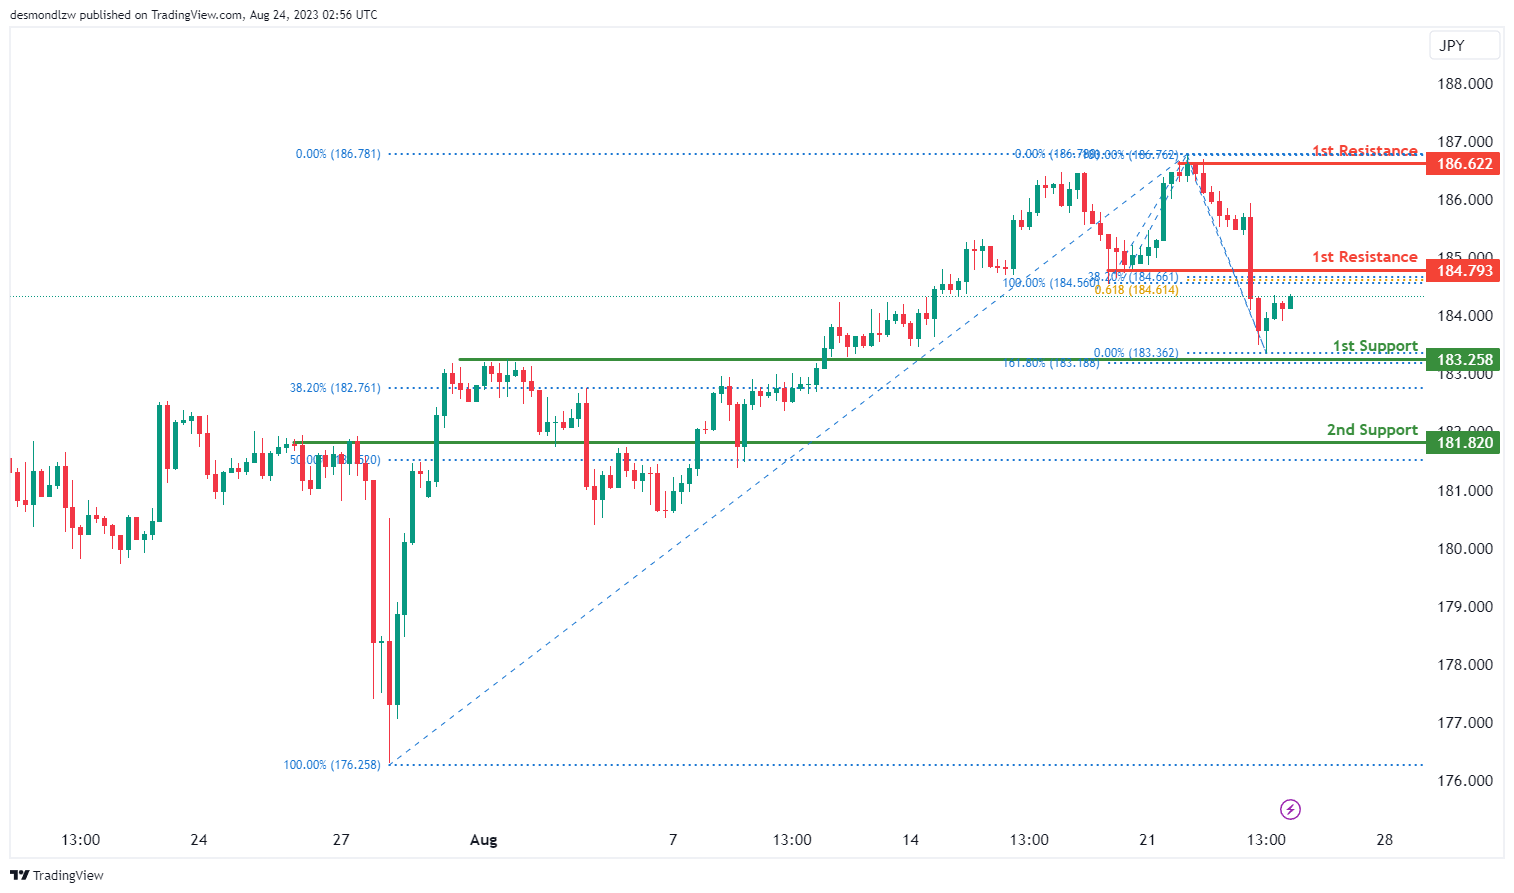
The GBP/JPY chart currently shows a bearish momentum, indicating a prevailing downward trend.
Within this context, there’s a potential scenario where the price might encounter resistance and experience a bearish pullback upon reaching the 1st resistance level at 184.79. This pullback could potentially lead to a drop towards the 1st support level at 183.25.
The significance of the 1st support at 183.25 lies in its identification as an overlap support, with added strength from the alignment with the 161.80% Fibonacci Extension.
Similarly, the 2nd support at 181.82 is also noted as an overlap support, further reinforcing its potential importance as a significant price level.
On the resistance side, the 1st resistance at 184.79 is noteworthy due to its designation as a pullback resistance. Moreover, its alignment with both the 38.20% Fibonacci Retracement and the 61.80% Fibonacci Projection indicates a convergence of Fibonacci levels, making it a key potential resistance zone. The 2nd resistance at 186.62 holds significance as a multi-swing high resistance, suggesting historical resistance strength.
USD/CHF:
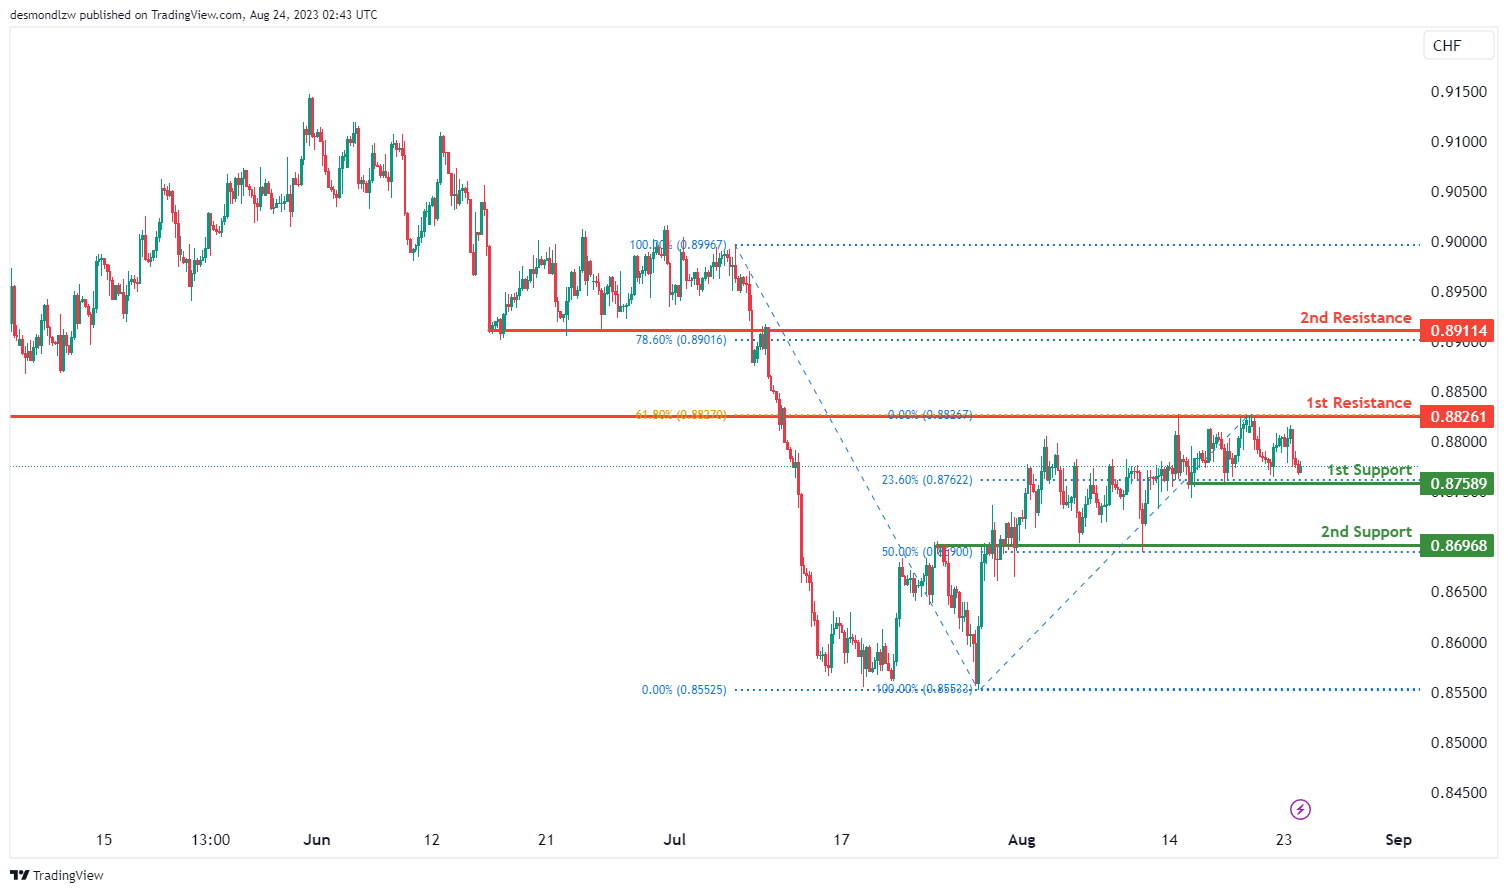
The USD/CHF chart is currently showing a neutral momentum, suggesting a lack of clear directional bias.
In this context, there’s a potential scenario where the price could exhibit fluctuations within a range defined by the 1st support level at 0.8758 and the 1st resistance level at 0.8826.
The 1st support at 0.8758 gains significance from its identification as a multi-swing low support, with an additional backing from the presence of the 23.60% Fibonacci Retracement.
Similarly, the 2nd support at 0.8696 is noted as an overlap support, reinforced by its alignment with the 50% Fibonacci Retracement, potentially acting as a key level during downward movements.
On the resistance side, the 1st resistance at 0.8826 is significant due to its nature as an overlap resistance and its alignment with the 61.80% Fibonacci Retracement, potentially impeding upward price movement. The 2nd resistance level at 0.8911 is also notable as a pullback resistance and coincides with the 78.60% Fibonacci Retracement.
USD/JPY:
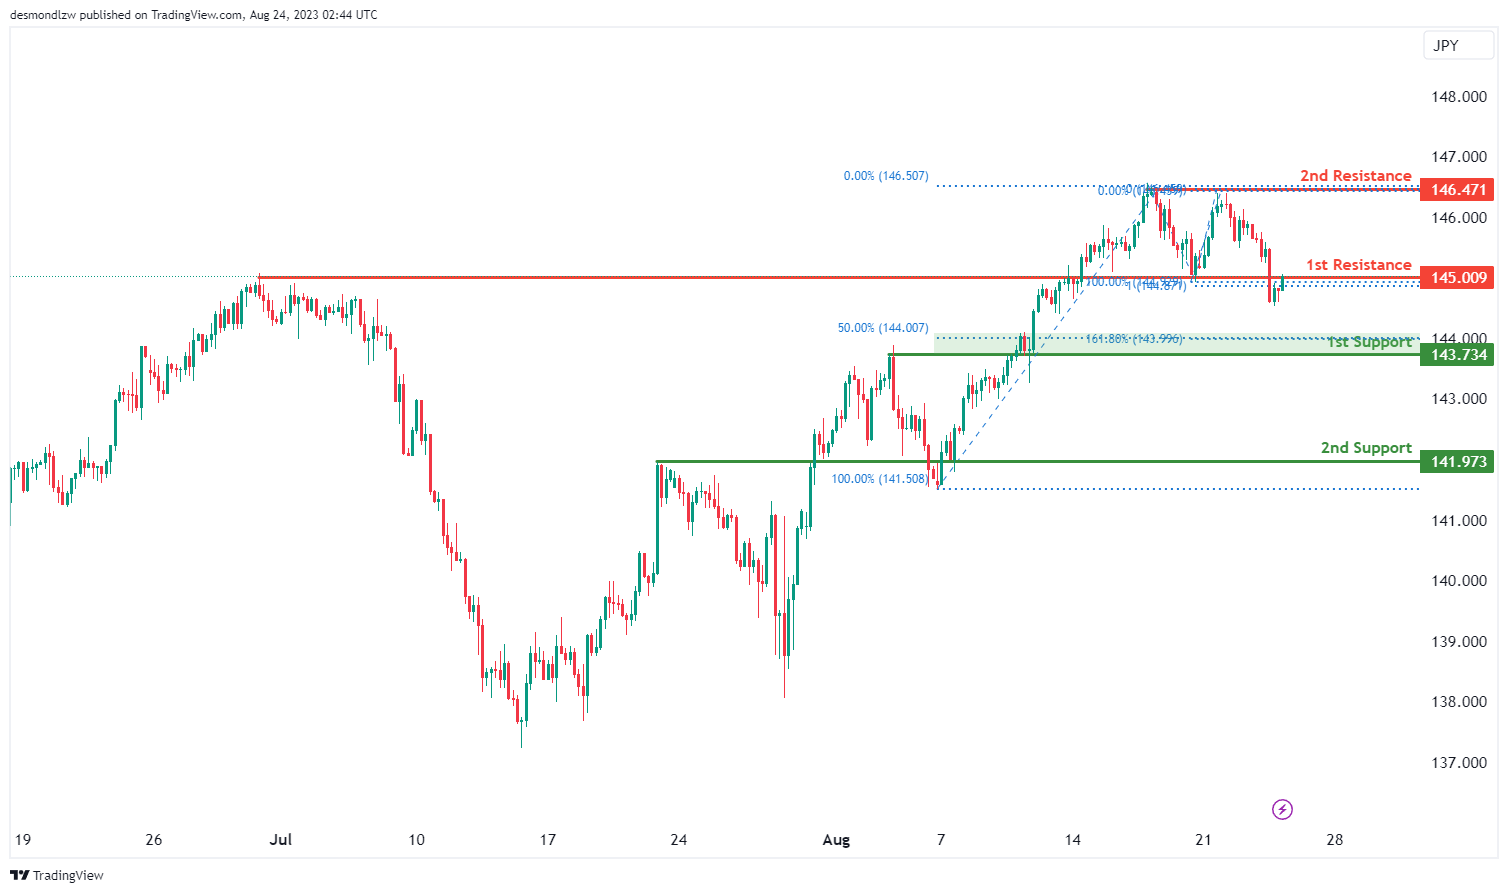
The USD/JPY chart currently indicates a bearish momentum, suggesting a prevailing downward trend.
Within this context, there’s a potential scenario where the price might experience a bearish pullback upon reaching the 1st resistance level at 145.00, potentially leading to a drop towards the 1st support level at 143.73.
The significance of the 1st support at 143.73 lies in its identification as a pullback support, further reinforced by its alignment with both the 50% Fibonacci Retracement and the 161.80% Fibonacci Extension, indicating a convergence of Fibonacci levels and potentially a stronger support zone.
Similarly, the 2nd support level at 141.97 is noted as an overlap support, providing additional reinforcement to its potential as a significant price level.
On the resistance side, the 1st resistance at 145.00 is notable due to its designation as a pullback resistance, which could potentially hinder upward price movement. The 2nd resistance at 146.47 gains importance as a multi-swing high resistance, indicating a strong historical level where selling interest might arise.
USD/CAD:
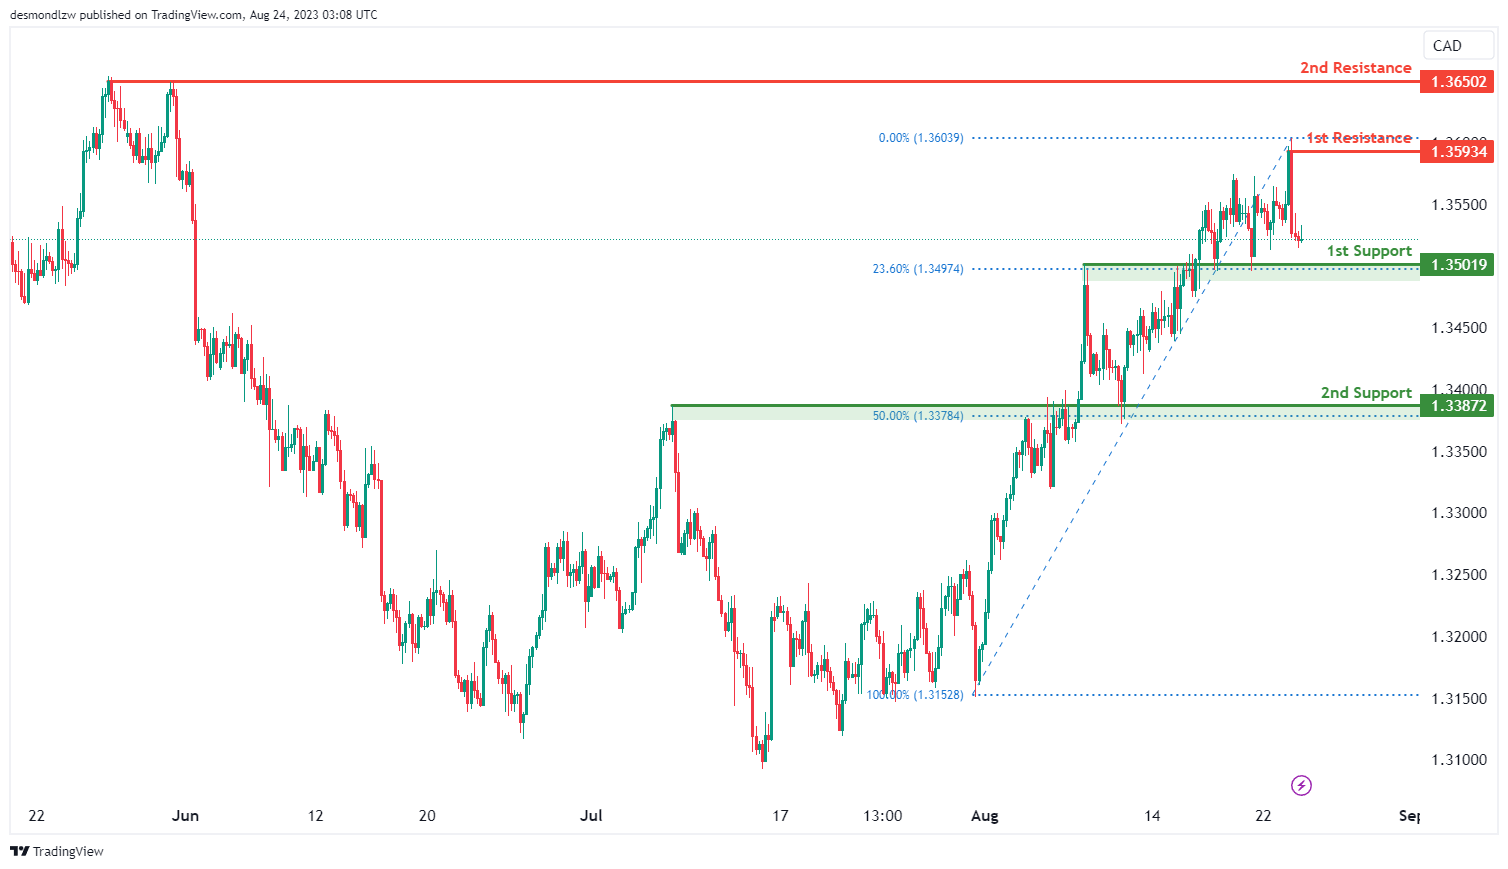
The USD/CAD chart’s momentum indicates a neutral stance, suggesting a lack of a clear directional trend.
Given this neutral momentum, there is a potential for price to fluctuate within a range defined by the 1st support level at 1.3502 and the 1st resistance level at 1.3593.
The significance of the 1st support level at 1.3502 is attributed to its identification as an overlap support that aligns with the 23.60% Fibonacci retracement level. In addition, the 2nd support level at 1.3387 is also identified as an overlap support that aligns with the 50.00% Fibonacci retracement level.
To the upside, the 1st resistance level at 1.3593 is identified as a swing-high resistance while the 2nd resistance level at 1.3650 is identified as a multiple swing-high resistance.
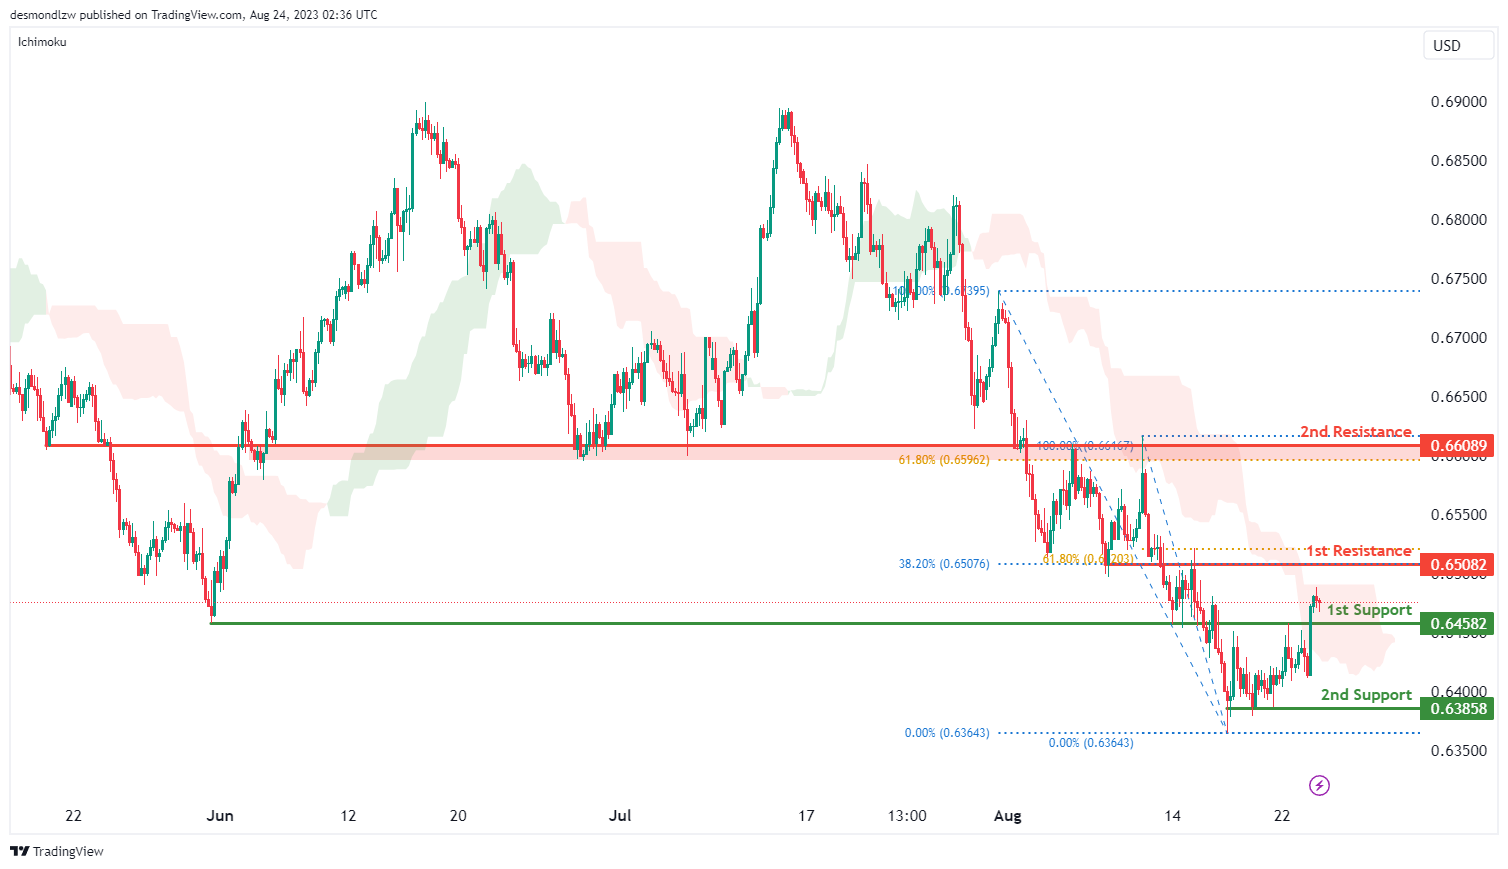
AUD/USD:
The AUD/USD chart currently indicates a weak bearish momentum, implying a prevalent downward trend in the market. There is a potential for price to pull back towards the 1st support level at 0.6458.
This 1st support level at 0.6458 is identified as an overlap support. Additionally, the 2nd support level at 0.6386 is identified as a multiple swing-low support, potentially acting as a strong barrier.
To the upside, the 1st resistance level at 0.6508 is identified as an overlap resistance that aligns with a confluence of Fibonacci levels i.e. the 38.20% and 61.80% retracement levels. Similarly, the 2nd resistance level at 0.6609 is also identified as an overlap resistance that aligns with the 61.80% Fibonacci retracement level.
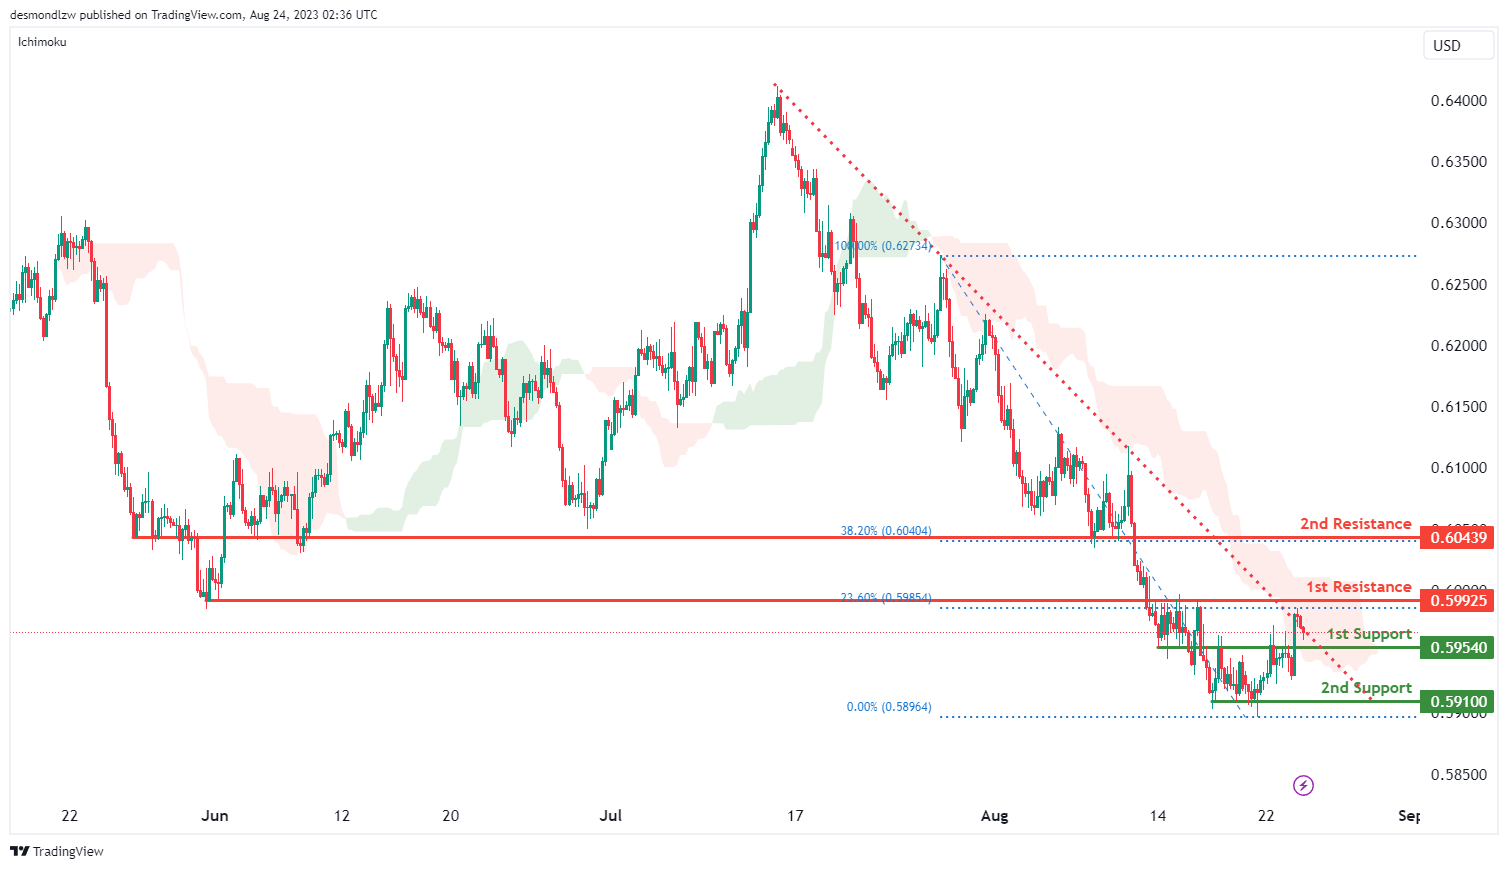
NZD/USD
The NZD/USD chart currently reflects a bearish momentum, suggesting a prevailing downward trend. Given this bearish momentum, it is possible that price could pull back towards the 1st support level at 0.5954.
This 1st support level at 0.5954 is identified as an overlap support. Additionally, the 2nd support level at 0.5910 is identified as a multiple swing-low support, potentially offering a robust level of support.
To the upside, the 1st resistance level at 0.5993 is identified as an overlap resistance that aligns with the 23.60% Fibonacci retracement level. Similarly, the 2nd resistance level at 0.6044 is also identified as an overlap resistance that aligns with the 38.20% Fibonacci retracement level.
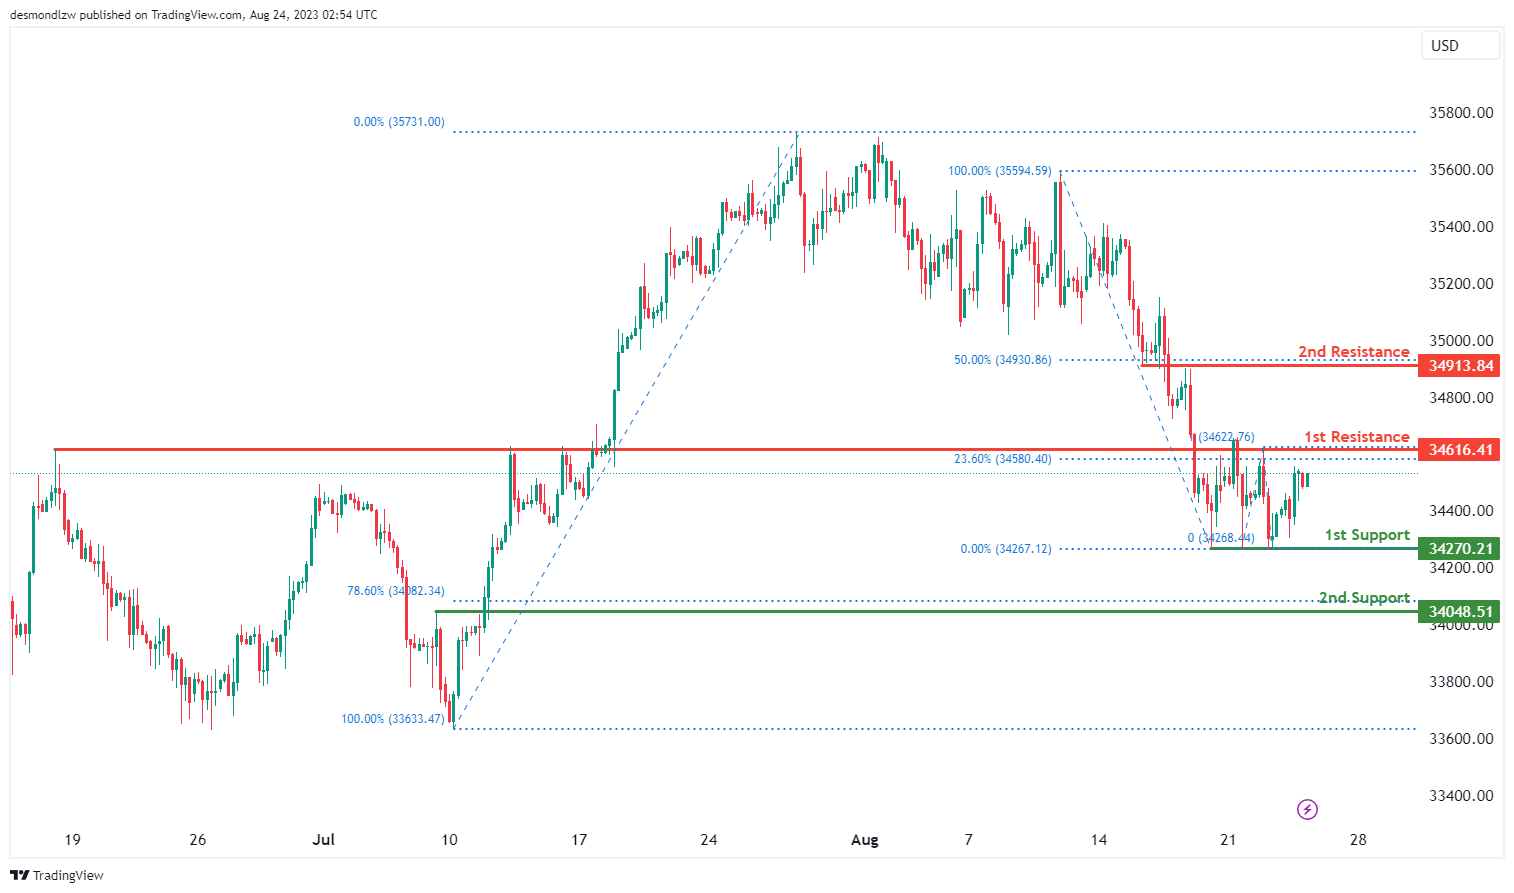
DJ30:
The DJ30 (Dow Jones Industrial Average) chart is currently displaying a neutral momentum, suggesting a lack of a clear trend direction.
Within this context, there’s a possibility that the price might exhibit a pattern of fluctuation between the 1st support level at 34,616.41 and the 1st resistance level at 34,616.41.
The 1st support at 34,616.41 is noted as an overlap support, indicating a historical price level where support has been observed. Additionally, the 2nd support at 34,048.51 gains significance due to its alignment with the 78.60% Fibonacci Retracement, potentially strengthening its role as a pullback support.
As for resistance levels, the 1st resistance at 34,616.41 is designated as an overlap resistance, indicating a historical level where resistance has been observed. The 2nd resistance at 34,913.84 holds importance as an overlap resistance and is aligned with the 50% Fibonacci Retracement, potentially reinforcing its significance.
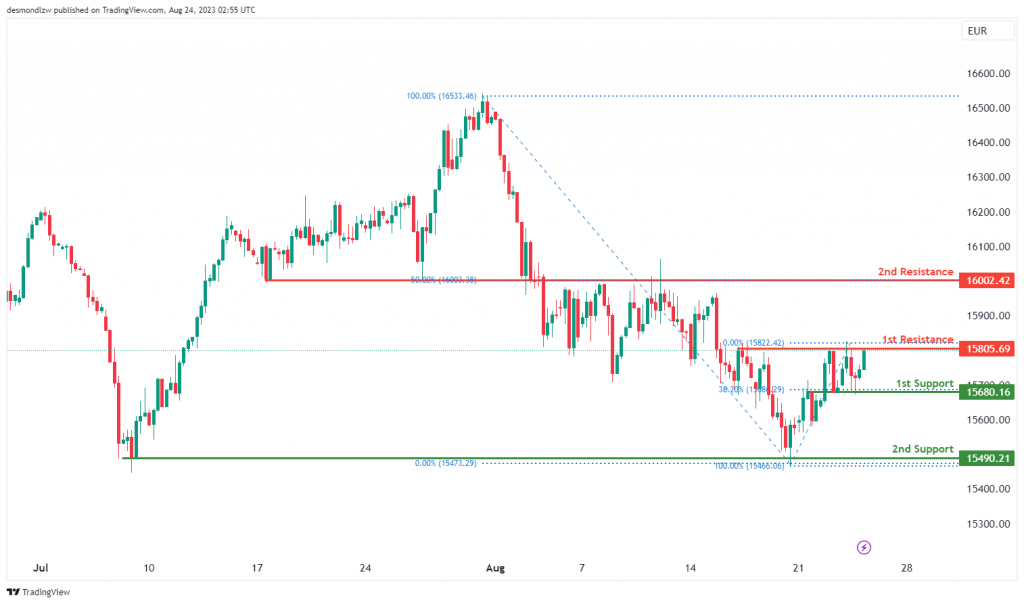
GER30:
The GER30 (DAX 30) chart is currently showing a neutral momentum, indicating a lack of a definitive trend direction.
Within this context, it’s possible that the price could exhibit a pattern of fluctuation between the 1st support level at 15,680.16 and the 1st resistance level at 15,805.69.
The 1st support at 15,680.16 is identified as an overlap support and is also aligned with the 38.20% Fibonacci Retracement, which adds to its significance. The 2nd support at 15,490.21 holds importance as a multi-swing low support, indicating historical levels where price has found support.
As for resistance levels, the 1st resistance at 15,805.69 is designated as a multi-swing high resistance, indicating historical resistance levels. The 2nd resistance at 16,002.42 gains significance as an overlap resistance and is also aligned with the 50% Fibonacci Retracement.
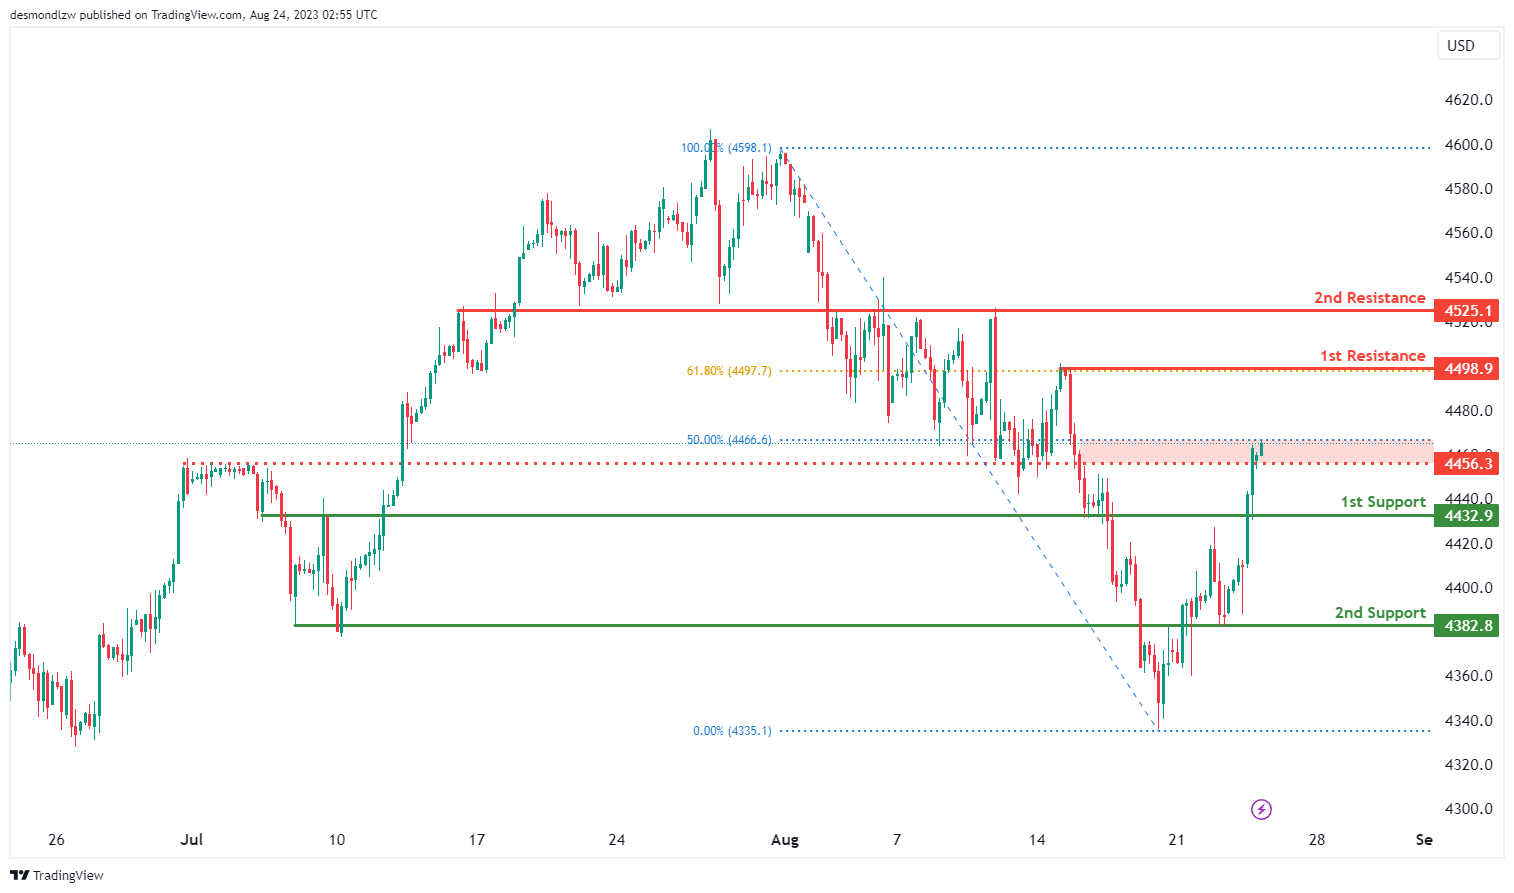
US500
The US500 (S&P 500) chart is currently displaying a bullish momentum, indicating a prevailing upward trend.
In this context, there’s a potential scenario where the price could continue its bullish movement towards the 1st resistance level at 4498.9.
For support levels, the 1st support at 4432.9 and the 2nd support at 4382.8 are both identified as overlap supports, reinforcing their significance.
The 1st resistance at 4498.9 is noted as a swing high resistance, and it gains further importance due to aligning with the 61.80% Fibonacci Retracement level. The 2nd resistance at 4525.1 is designated as an overlap resistance.
Additionally, an intermediate resistance level at 4456.3 is identified as a pullback resistance, and it’s aligned with the 50% Fibonacci Retracement level.
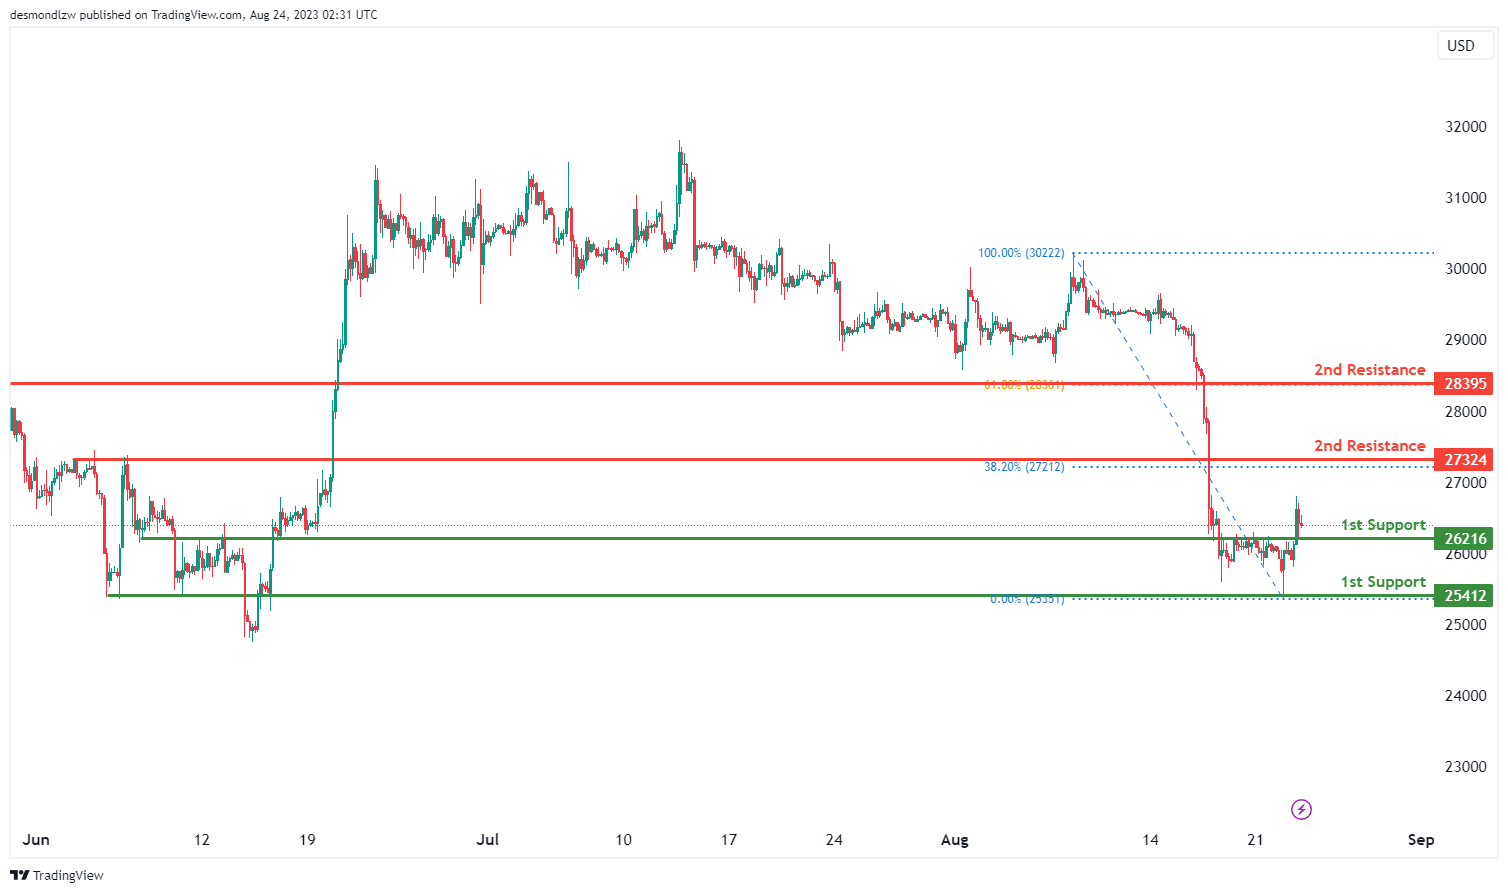
BTC/USD:
Instrument: BTC/USD (Bitcoin to US Dollar)
Overall momentum of the chart: Bullish
The BTC/USD (Bitcoin to US Dollar) chart is currently showing a bullish momentum, indicating a prevailing upward trend.
In this context, there’s a potential scenario where the price could continue its bullish movement towards the 1st resistance level at 27324.
For support levels, the 1st support at 26216 is identified as a pullback support, while the 2nd support at 25412 is designated as an overlap support, enhancing their significance.
The 1st resistance at 27324 gains importance due to its role as a pullback resistance and aligns with the 38.20% Fibonacci Retracement level. Similarly, the 2nd resistance at 28395 is noted as a pullback resistance and is associated with the 61.80% Fibonacci Retracement level.
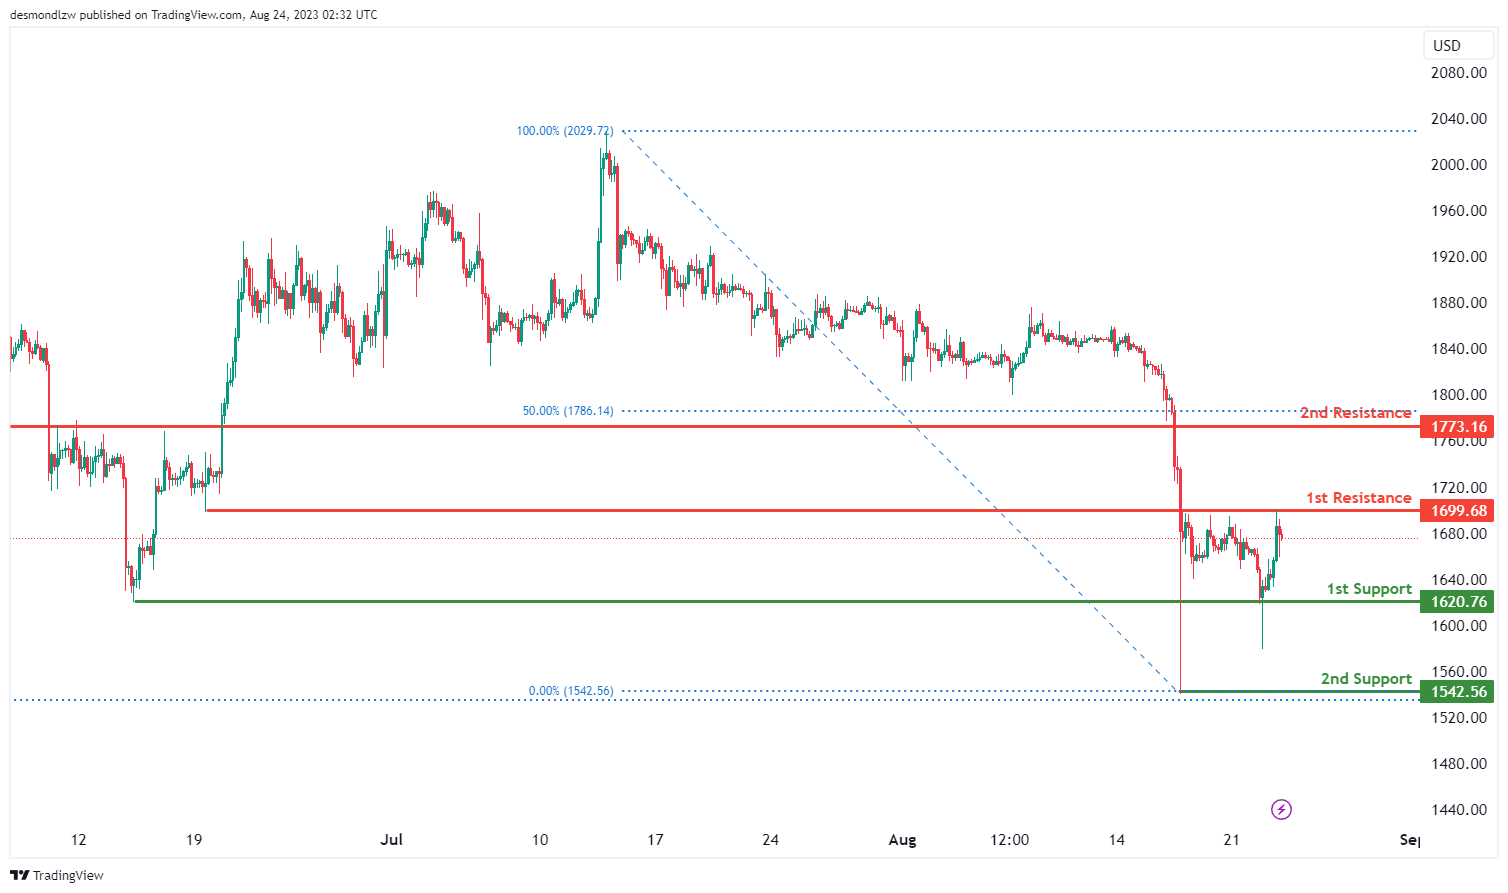
ETH/USD:
The ETH/USD (Ethereum to US Dollar) chart is currently exhibiting a neutral momentum, indicating a lack of strong directional bias.
In this context, there’s a potential scenario where the price could experience fluctuations within a range defined by the 1st support at 1620.76 and the 1st resistance at 1699.68.
The 1st support at 1620.76 is identified as a swing low support, emphasizing its potential significance in providing a foundation for price movements. Similarly, the 2nd support at 1542.56 is also categorized as a swing low support, further reinforcing its role in potential price reactions.
Conversely, the 1st resistance at 1699.68 is considered an overlap resistance, potentially acting as a barrier to upward movements. The 2nd resistance at 1773.16 holds importance as a pullback resistance and aligns with the 50% Fibonacci Retracement level, adding to its potential relevance.
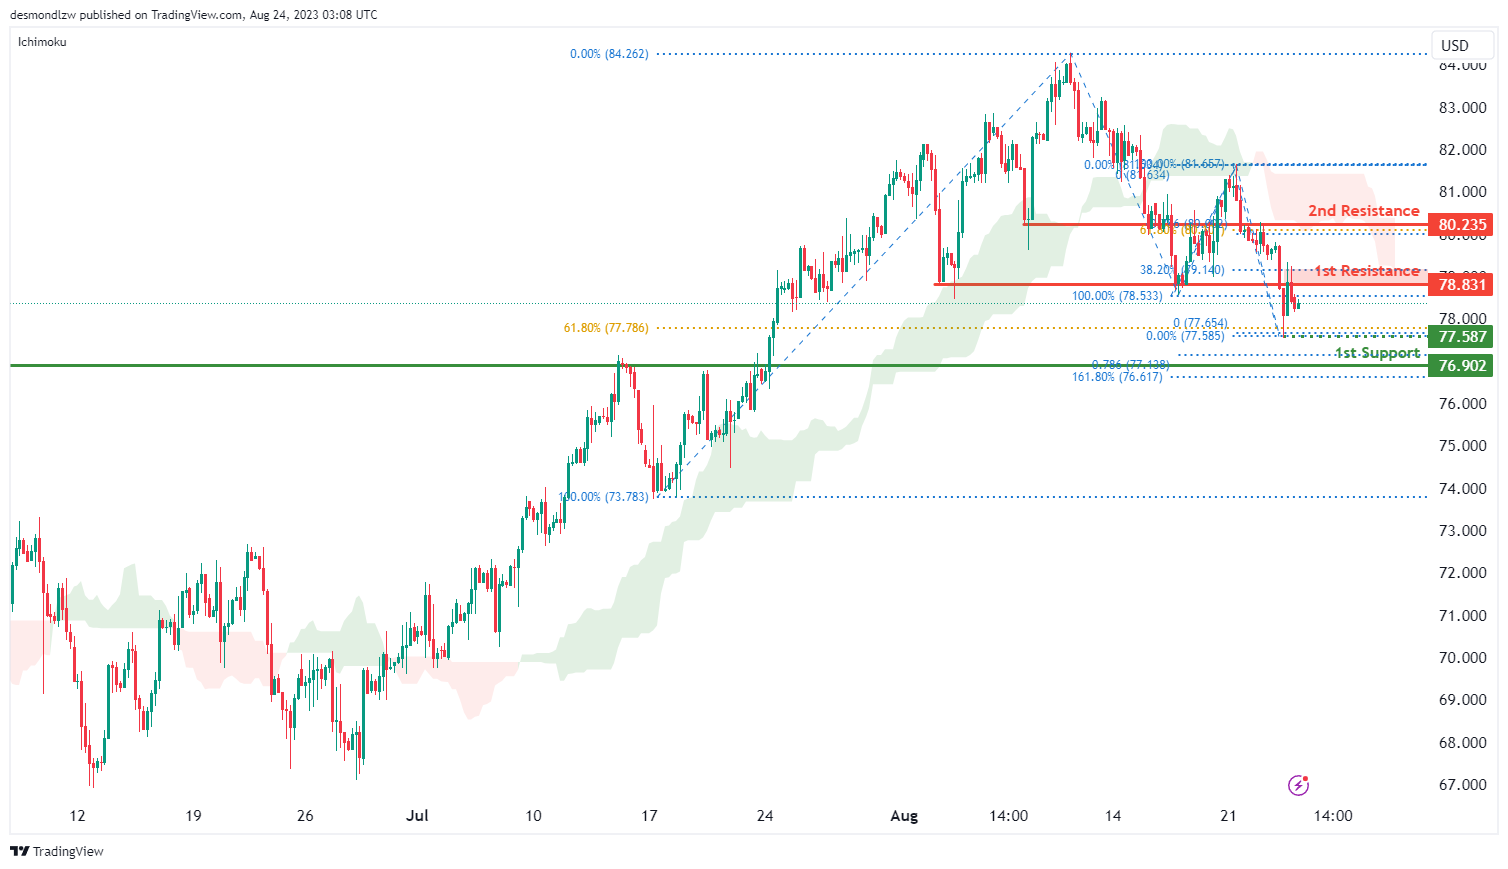
WTI/USD:
The WTI chart currently indicates a bearish momentum, suggesting a prevailing downward trend. There is potential for price to continue its downward movement towards the 1st support level at 76.90.
There is also an intermediate support level at 77.59 which is identified as a recent swing-low that aligns with the 61.80% Fibonacci retracement level. The 1st support level at 76.90 is identified as an overlap support that aligns with a confluence of Fibonacci levels i.e. the 161.80% extension and the 78.60% projection levels.
To the upside, the 1st resistance level at 78.83 is identified as an overlap resistance that aligns close to the 38.20% Fibonacci retracement level. The 2nd resistance level at 80.24 is also identified as an overlap resistance that aligns with the 61.80% Fibonacci retracement level.
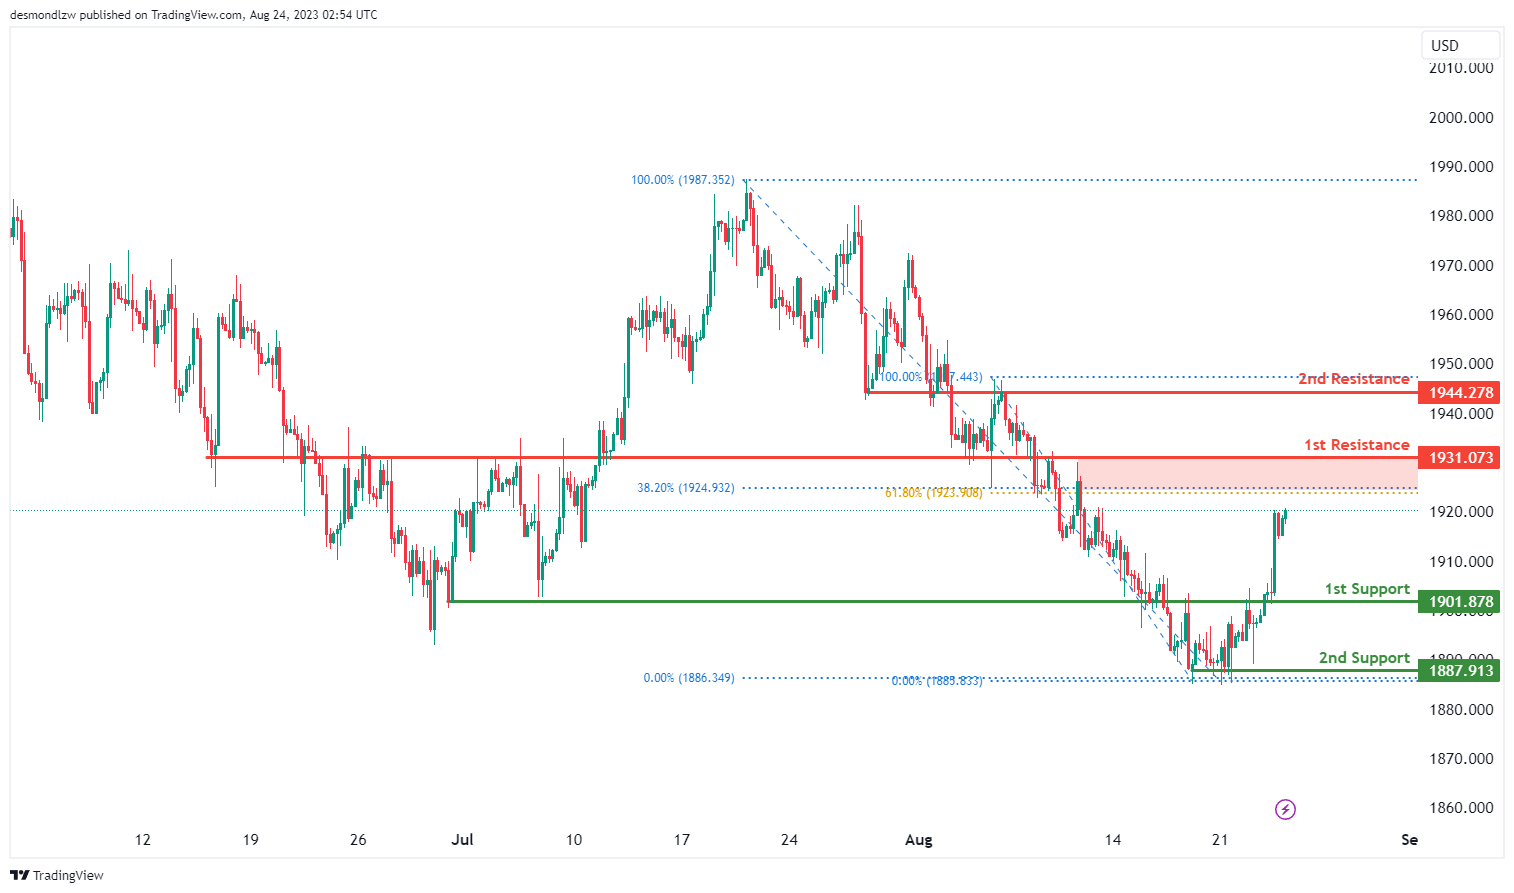
XAU/USD (GOLD):
The XAU/USD (Gold to US Dollar) chart is currently showing a bullish momentum, suggesting a tendency for upward movement.
In this context, there’s a potential scenario where the price could experience a bullish continuation towards the 1st resistance at 1931.07.
The 1st support at 1901.87 is considered an overlap support, indicating its significance as a potential level where price might find stability or rebound. Similarly, the 2nd support at 1887.91 is identified as a multi-swing low support, further strengthening its potential role in providing a foundation for price movements.
Conversely, the 1st resistance at 1931.07 is categorized as an overlap resistance, which could act as a barrier to further upward movements. The 2nd resistance at 1944.27 is also recognized as an overlap resistance, adding to its potential importance in limiting upward price progress.


