
DXY:
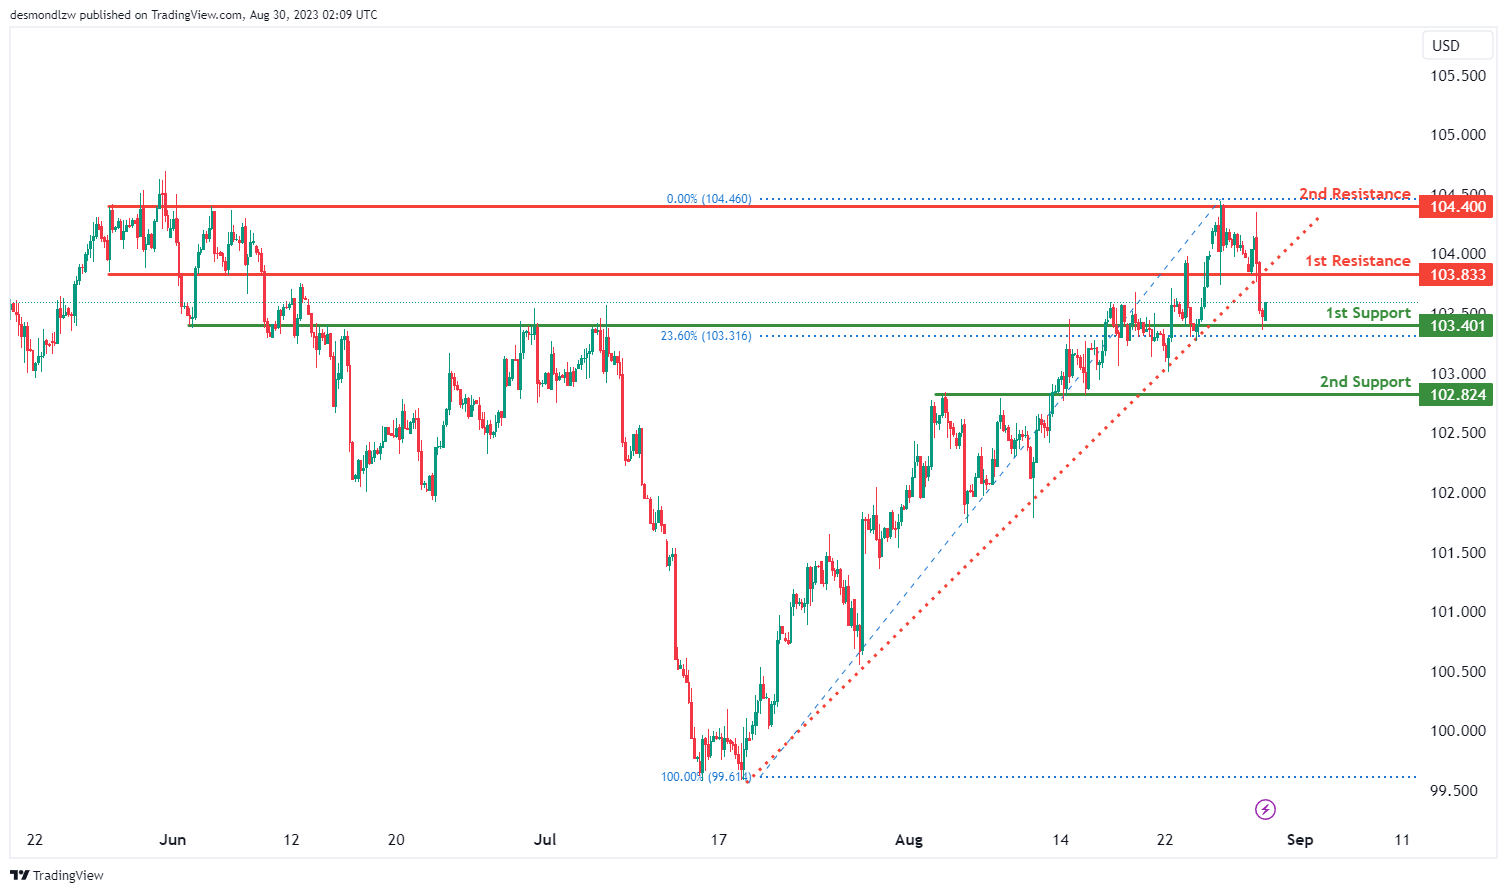
The DXY (US Dollar Index) chart is currently characterized by a bearish momentum, attributed to its break below an ascending support line, indicating the potential for a downward price movement. In this context, the chart could potentially witness a decline towards the 1st support level at 103.40. This level holds significance as an overlap support, backed by historical instances of price finding support in this region.
Further reinforcing potential support, the 2nd support level at 102.82 also serves as an overlap support, suggesting its importance in historical price action. These levels may act as foundations for a short-term drop.
On the flip side, the 1st resistance at 103.83 is marked as a pullback resistance, which might serve as a hurdle for any potential short-term upward correction.
Additionally, the 2nd resistance at 104.40 is identified as a multi-swing high resistance, signifying its historical role as a barrier against upward movements.
EUR/USD:
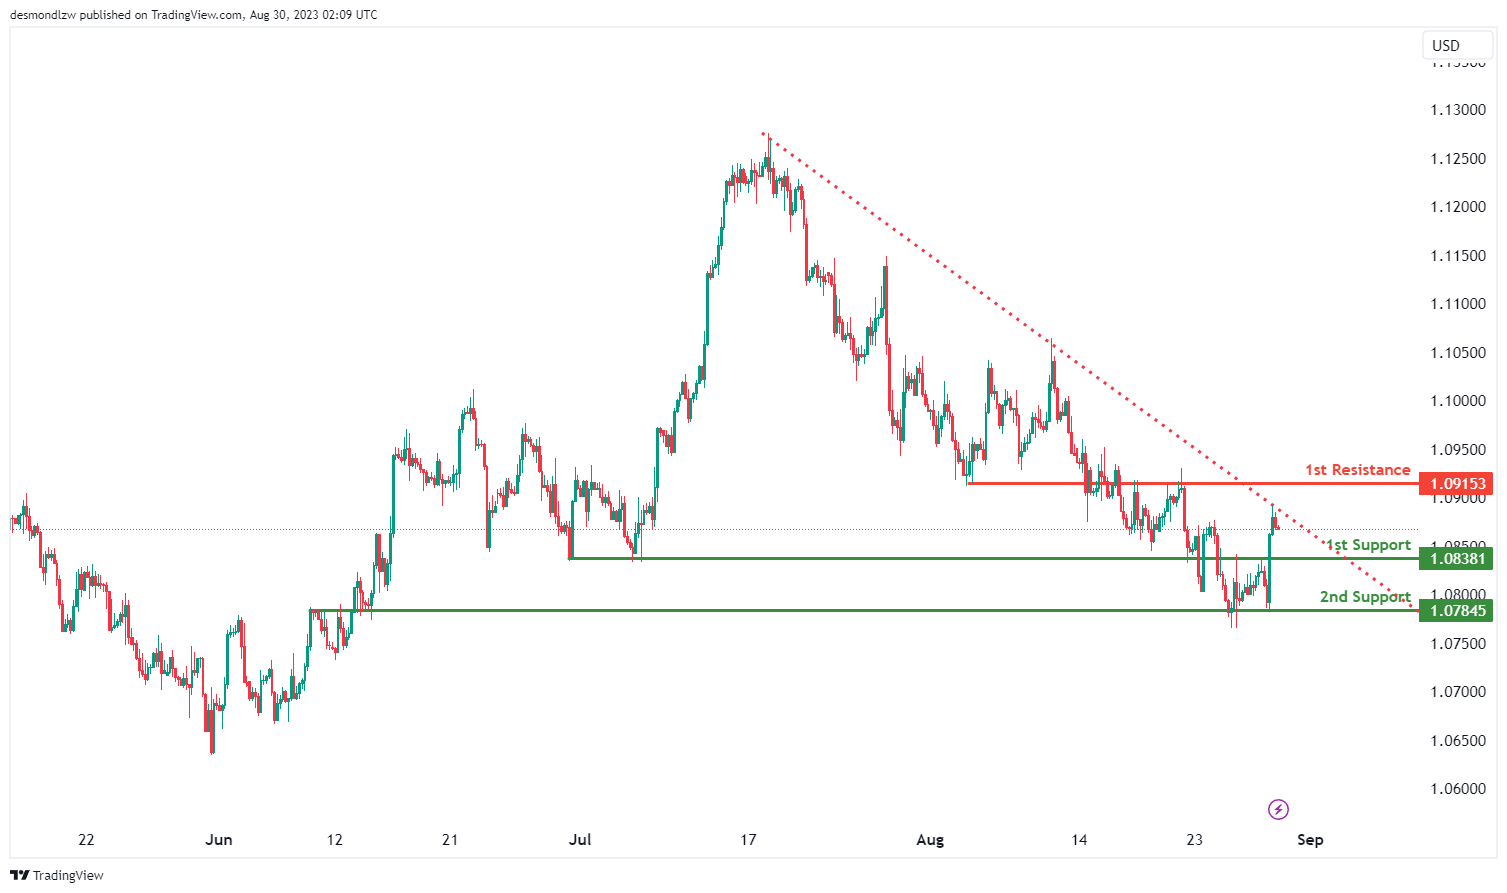
The EUR/USD chart currently exhibits a bearish momentum, primarily influenced by the fact that the price is positioned below a significant descending trend line, indicating a likelihood of further bearish movement. In this context, there’s potential for a short-term upward movement towards the 1st resistance level at 1.0915, followed by a potential reversal off this level, leading to a subsequent drop towards the 1st support level.
The 1st support level at 1.0838 is considered a pullback support, suggesting that historical price action has shown support around this region during pullbacks or corrections.
In addition, the 2nd support level at 1.0784 is marked as an overlap support, indicating its historical significance in terms of providing a base for potential price movements.
On the upside, the 1st resistance at 1.0915 is identified as an overlap resistance, signifying historical instances of price encountering resistance in this area. Traders often monitor these levels for potential price reactions.
EUR/JPY:
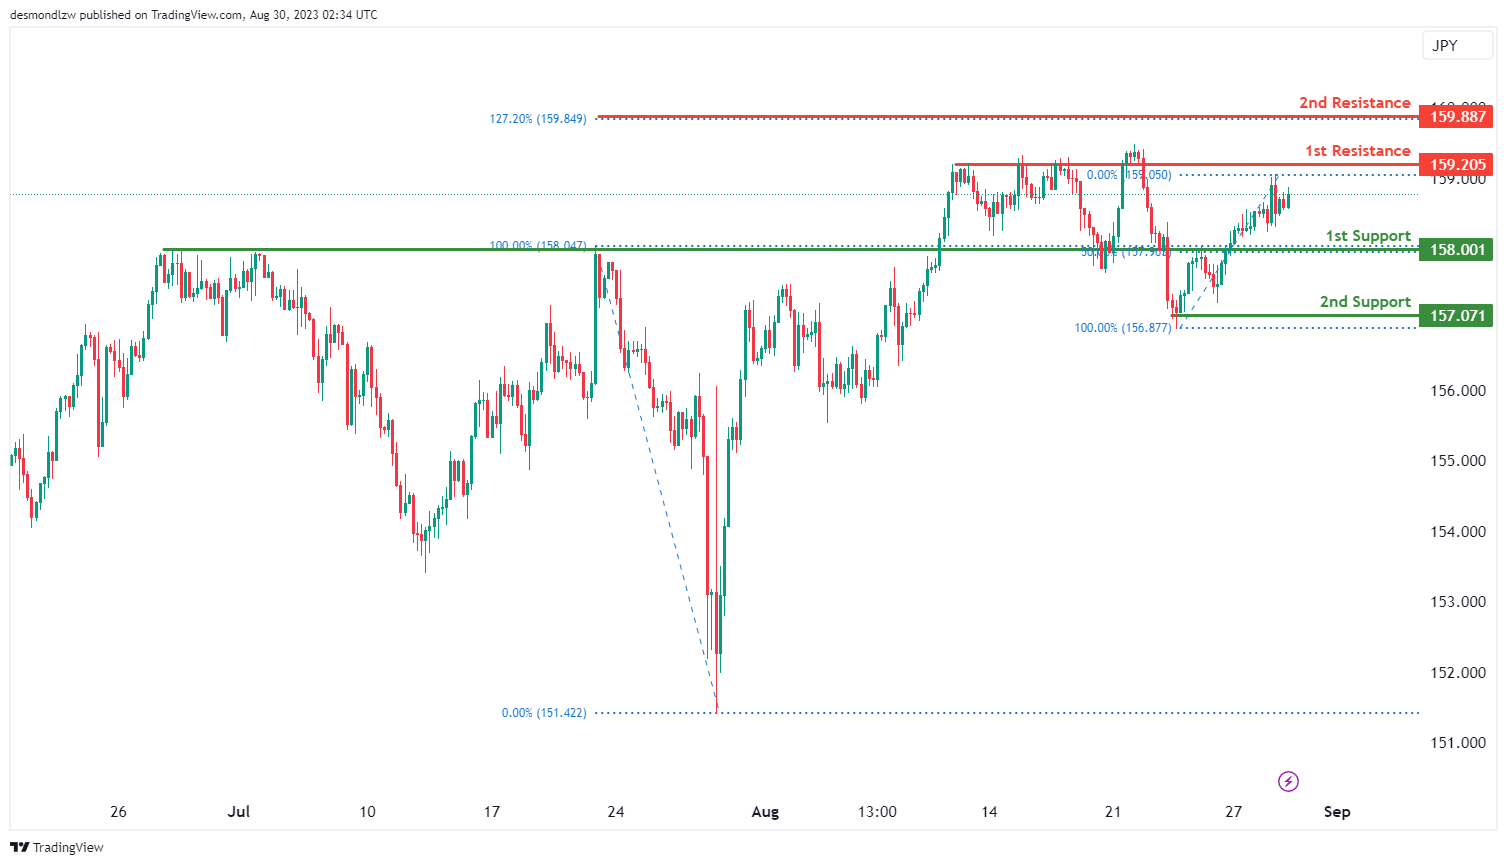
For EUR/JPY, the chart shows a bullish overall momentum.
The 1st support level at 158.00 is an overlap support, indicating potential buying interest at this level. It’s also aligned with the 50% Fibonacci retracement, adding to its significance.
The 2nd support level at 157.07 is a multi-swing low support, further suggesting its importance as a potential area of buying activity.
On the resistance side, the 1st resistance level at 159.20 is an overlap resistance, which might act as a barrier to upward movement.
The 2nd resistance level at 159.88 is particularly interesting as it’s a 127% Fibonacci extension, implying that this level could be a target for bullish momentum.
EUR/GBP:
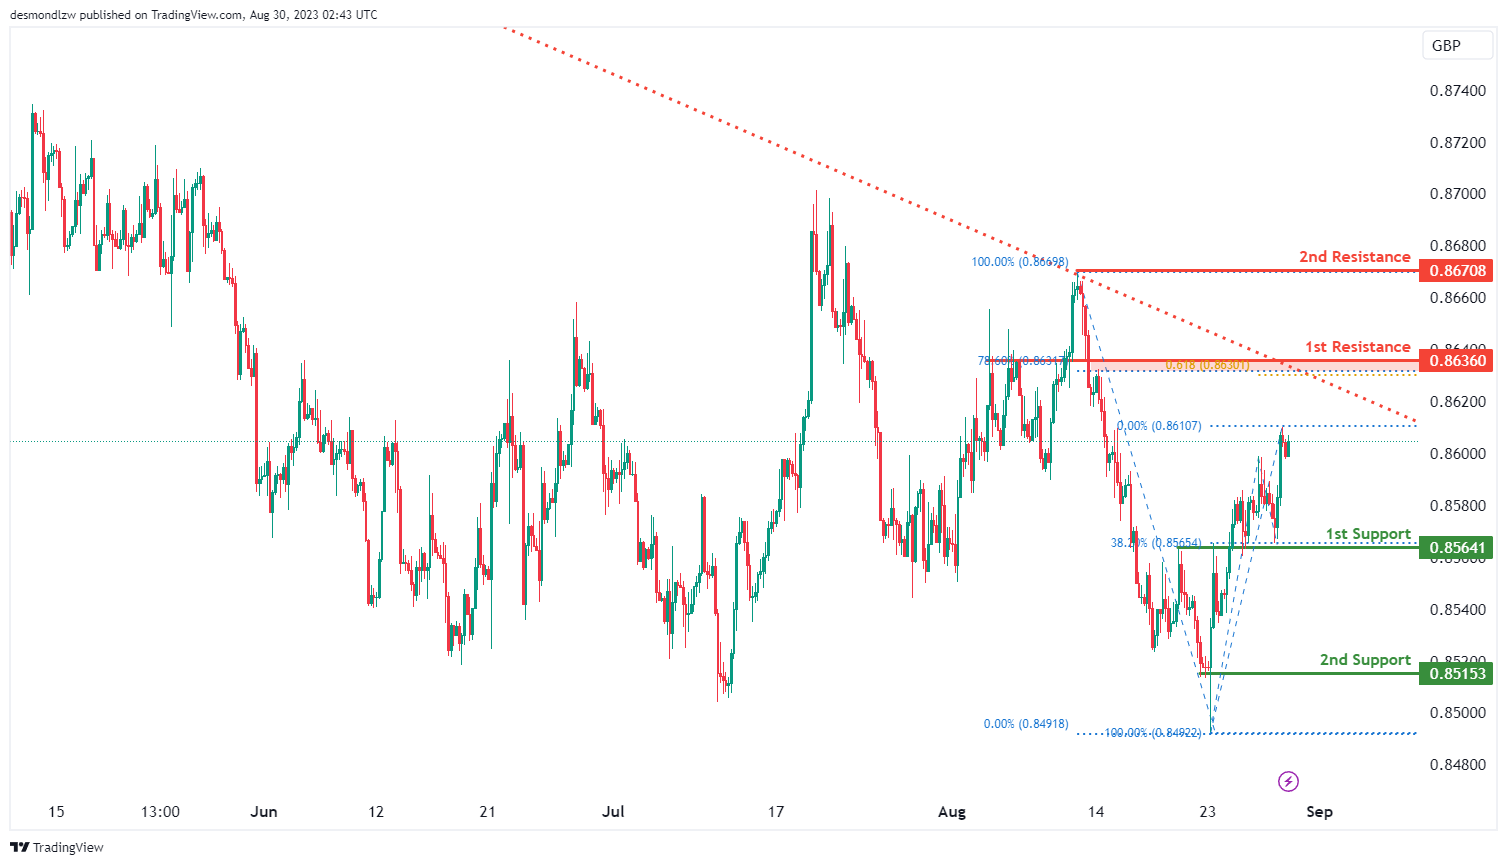
For EUR/GBP, the chart indicates a bullish overall momentum.
The 1st support level at 0.8564 is an overlap support and also coincides with the 38.20% Fibonacci retracement, suggesting potential buying interest at this level.
The 2nd support level at 0.8515 is a swing low support, which could reinforce its significance as a potential area where buyers might step in.
On the resistance side, the 1st resistance level at 0.8636 is an overlap resistance. Moreover, it aligns with both the 78.60% Fibonacci retracement and the 61.80% Fibonacci projection, indicating strong potential for resistance at this level.
The 2nd resistance level at 0.8670 is a swing high resistance, which could further add to its importance as a potential barrier for bullish movement.
GBP/USD:
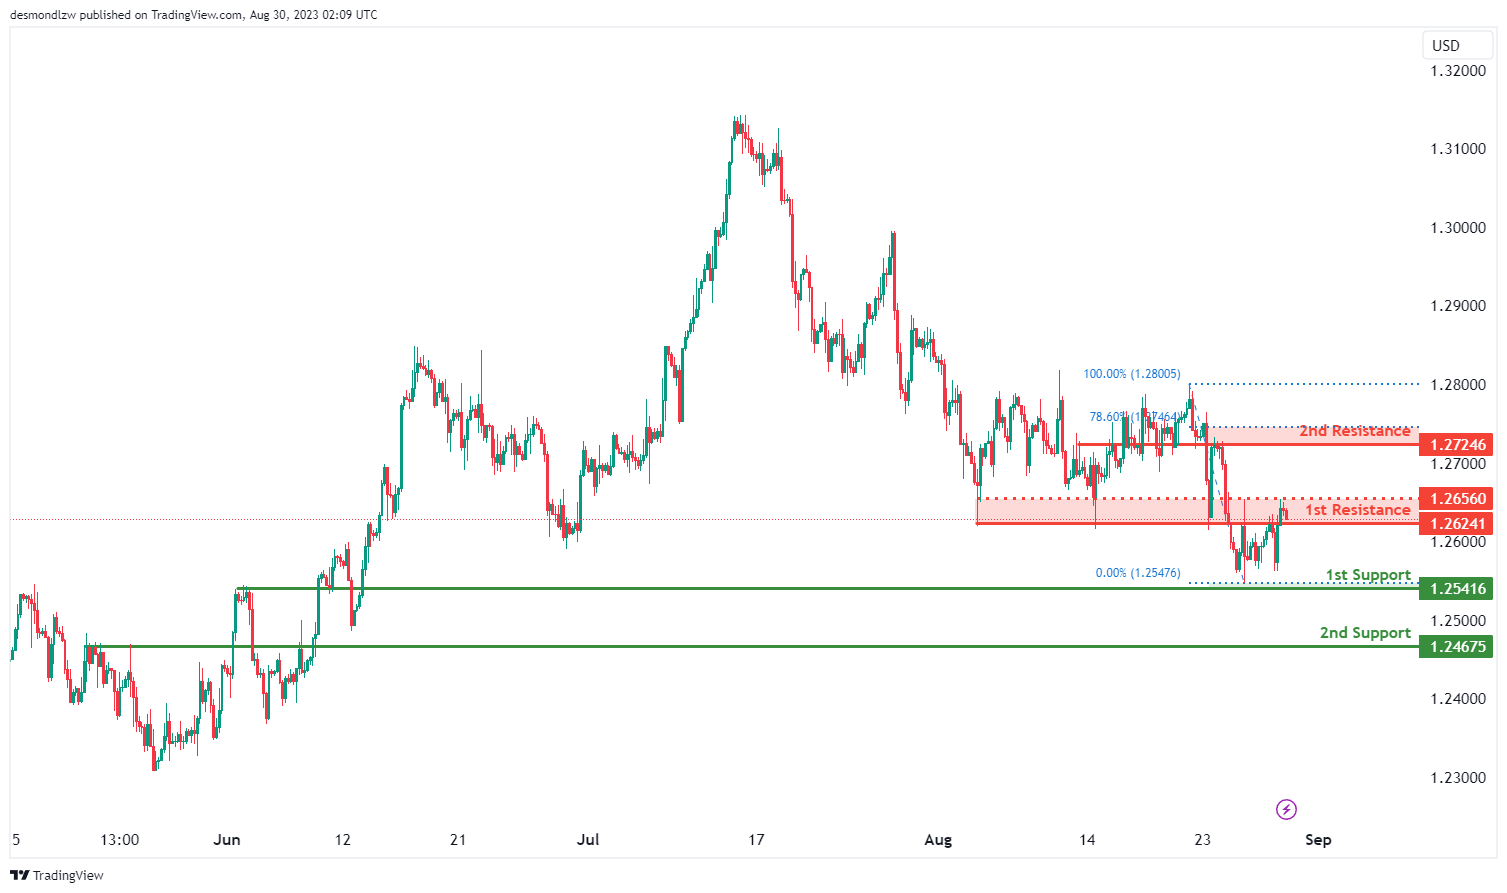
The GBP/USD chart is currently displaying a bearish overall momentum, signaling a downward trend in the price. Within this context, there’s potential for the price to continue its bearish movement and potentially target the 1st support level.
The 1st support at 1.2541 is identified as an overlap support, indicating that historical price action has found support around this level. This level is a significant consideration as it provides a potential base for the price to stabilize or rebound.
The 2nd support level at 1.2467 is classified as a pullback support, suggesting that it aligns with the concept of pullbacks or corrections within the larger downtrend.
On the upside, the 1st resistance level at 1.2624 is marked as an overlap resistance, signifying historical instances where the price has encountered resistance in this region.
Furthermore, the 2nd resistance at 1.2724 is also considered an overlap resistance and is noteworthy due to its alignment with the 78.60% Fibonacci Retracement level. This confluence adds to the potential significance of this level as a barrier to further bullish movement.
GBP/JPY:
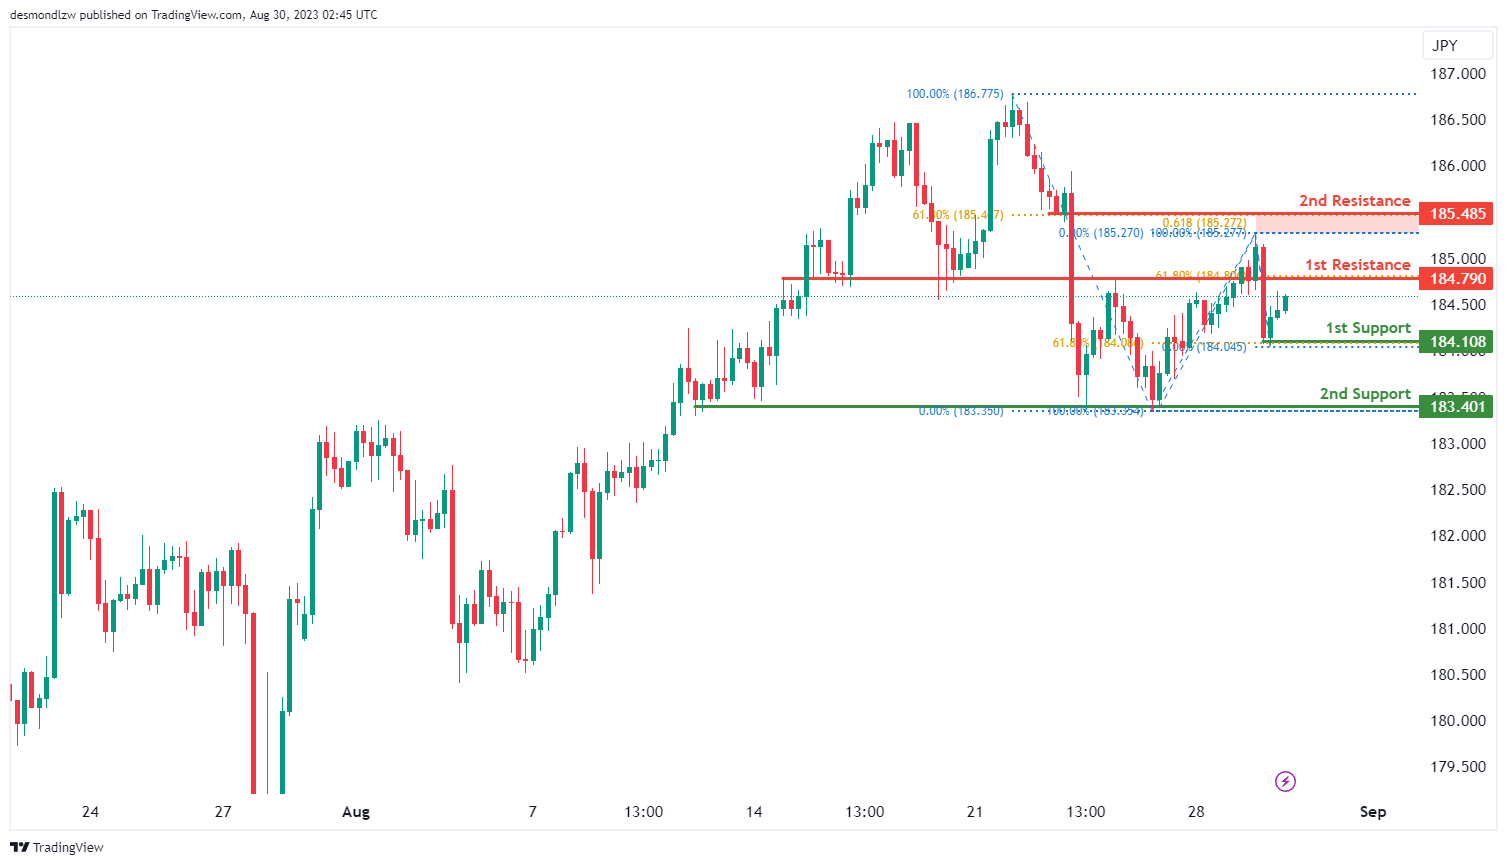
For GBP/JPY, the chart indicates a bullish overall momentum.
The 1st support level at 184.10 is a swing low support and coincides with the 61.80% Fibonacci retracement, suggesting that this level could act as a strong support area.
The 2nd support level at 183.40 is a multi-swing low support, which could provide additional reinforcement to its potential as a support zone.
On the resistance side, the 1st resistance level at 184.79 is an overlap resistance and aligns with the 61.80% Fibonacci retracement. This level could present a significant hurdle for further bullish movement.
The 2nd resistance level at 185.48 is a swing high resistance, and it also coincides with both the 61.80% Fibonacci retracement and the 61.80% Fibonacci projection. This confluence of Fibonacci levels makes it a noteworthy resistance level.
USD/CHF:
The USD/CHF chart is currently exhibiting a bullish overall momentum, indicating an upward trend in the price movement. Within this context, there’s potential for the price to experience a bullish bounce off the 1st support level and potentially move towards the 1st resistance.
The 1st support level at 0.8771 is identified as an overlap support, signifying that historical price action has found support around this level. This level is significant as it could act as a base for potential upward movements.
Similarly, the 2nd support level at 0.8710 is also considered an overlap support, adding further weight to its potential as a support zone.
On the upside, the 1st resistance level at 0.8825 is noted as a pullback resistance. This suggests that historical price action might encounter resistance around this area, potentially causing a short-term pullback.
The 2nd resistance at 0.8866 is characterized as a multi-swing high resistance. This level could be an important target for the bullish movement if the price continues to gain momentum.

USD/JPY:
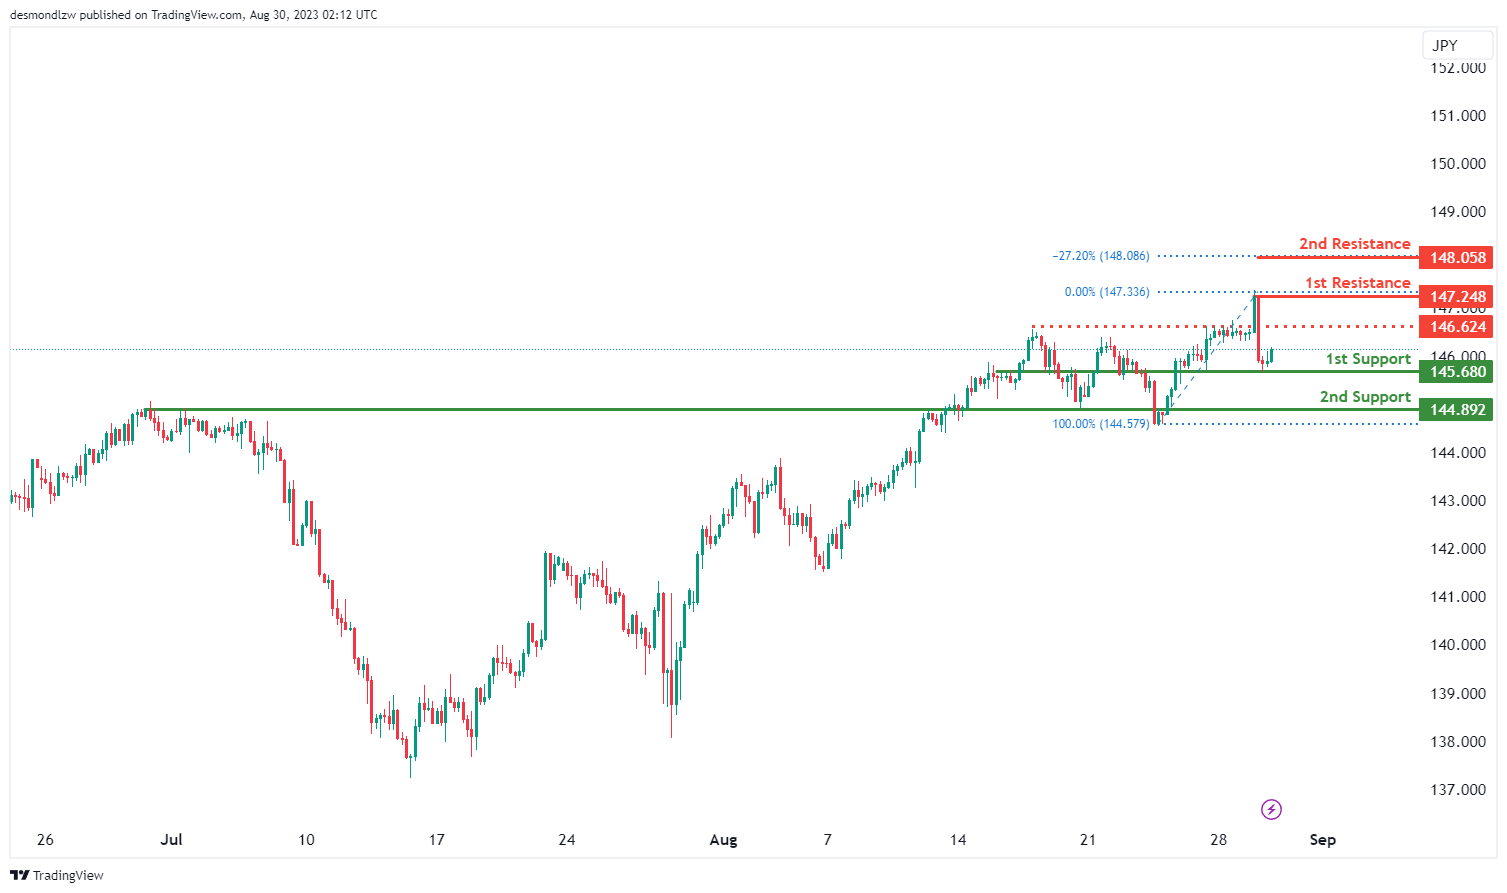
The USD/JPY chart is currently demonstrating a bullish overall momentum, indicating an upward trend in the price movement. There’s a potential for the price to experience a bullish continuation towards the 1st resistance level.
The 1st support level at 145.68 is identified as an overlap support, indicating historical instances where the price found support around this level. This level serves as a potential foundation for upward movements.
Similarly, the 2nd support level at 144.89 is considered a pullback support. This level might act as a stronger support zone, considering its alignment with the pullback nature and its significance in previous price action.
On the upside, the 1st resistance level at 147.24 is noted as a swing high resistance. This suggests that the price has previously encountered resistance around this area, potentially causing a temporary pause or reversal in the bullish momentum.
The 2nd resistance level at 148.05 is significant as it aligns with the -27% Fibonacci Expansion. This confluence suggests that this level could serve as a potential target for the bullish move if the price continues to gain momentum.
An intermediate resistance at 146.62, marked as a pullback resistance, also adds to the potential resistance areas that the price might encounter during its bullish movement.
USD/CAD:
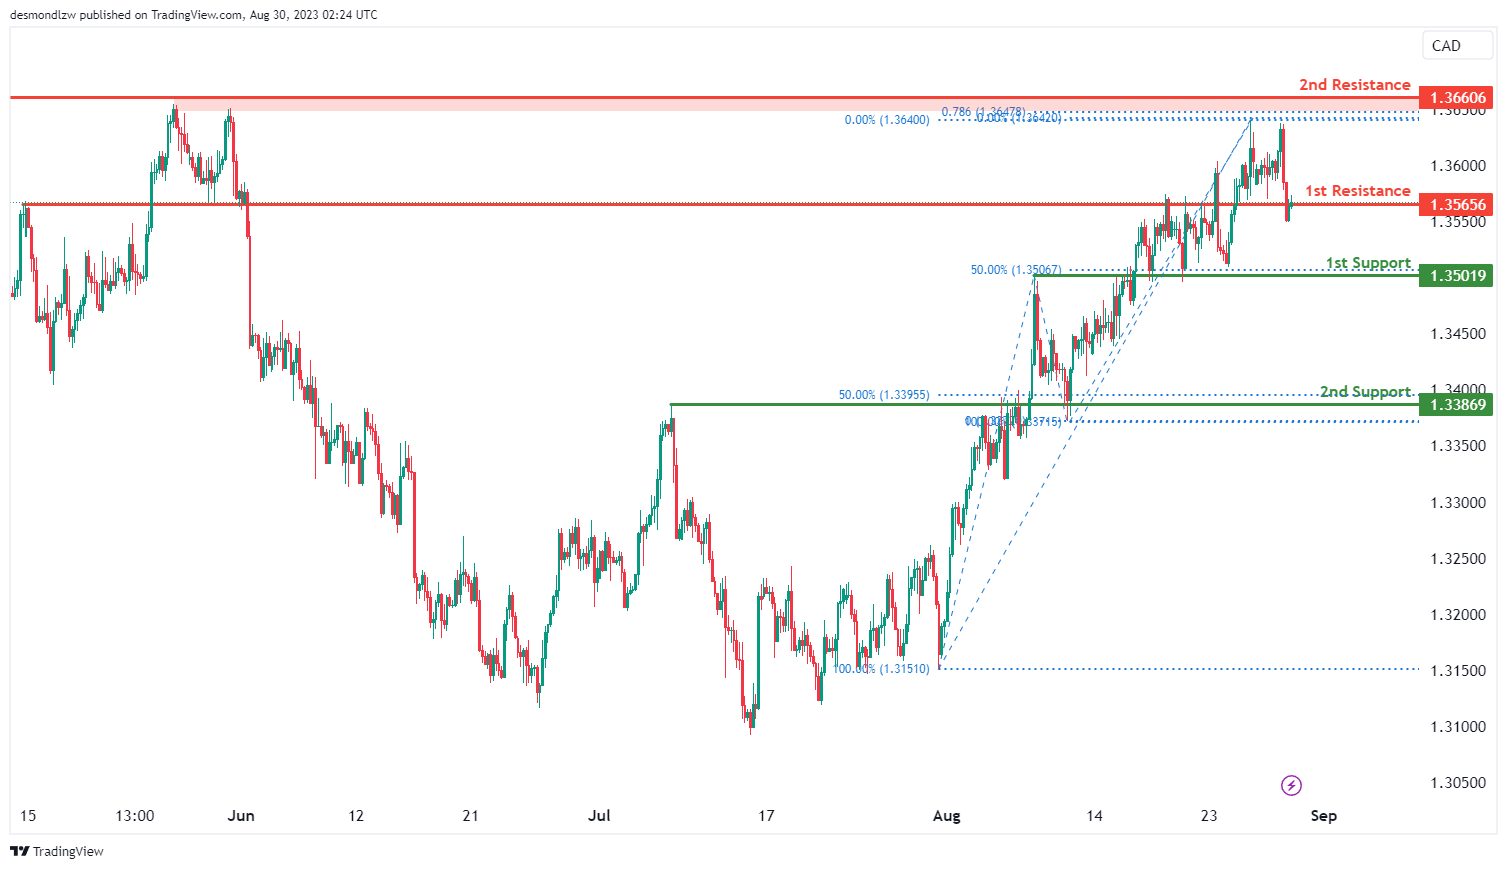
The USD/CAD chart is currently demonstrating a bearish overall momentum. Given this scenario, there is potential for price to react with a bearish movement upon reaching the 1st resistance level and subsequently decline towards the 1st support level.
The 1st support at 1.3502 is identified as an overlap support that coincides with the 50.00% Fibonacci retracement level. Furthermore, the 2nd support level at 1.3387 is also identified as an overlap support that aligns with the 50.00% Fibonacci retracement level.
To the upside, the 1st resistance level at 1.3566 is marked as an overlap resistance while the 2nd resistance at 1.3661 is identified as an overlap resistance that aligns with the 78.60% Fibonacci projection level.
AUD/USD:
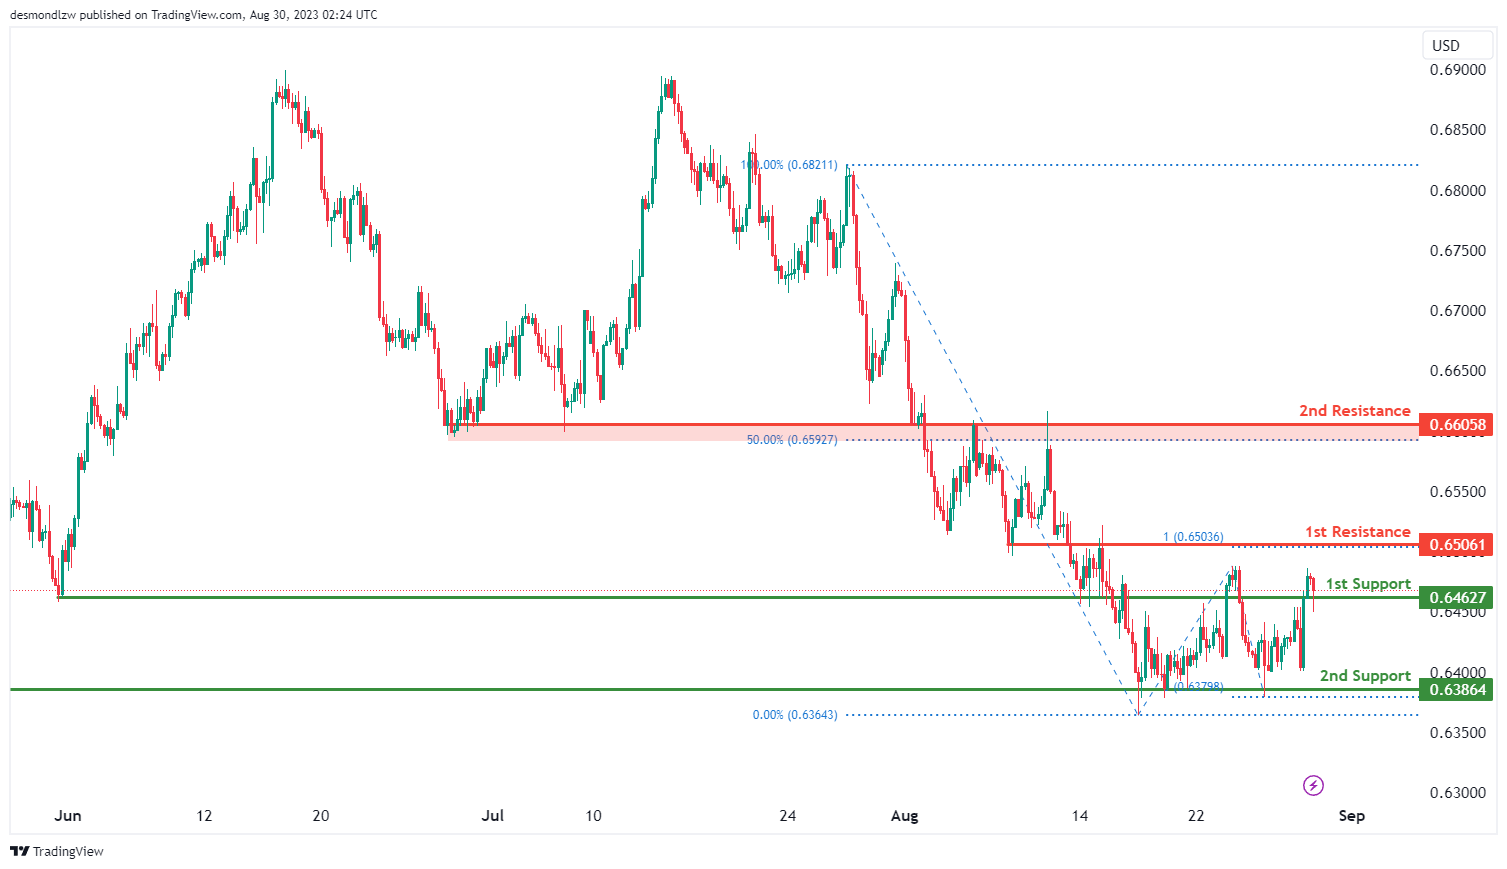
The AUD/USD chart is currently displaying a bearish overall momentum, indicating a prevailing downward trend in the price movement. There is potential for price to break below the 1st support level and descend further toward the 2nd support level.
The 1st support at 0.6463 is identified as an overlap support while the 2nd support level at 0.6386 is considered a pullback support.
To the upside, the 1st resistance level at 0.6506 is identified as an overlap resistance that aligns with the 100.00% Fibonacci projection level. The 2nd resistance at 0.6606 is also identified as an overlap resistance that aligns with the 50.00% Fibonacci retracement level.
NZD/USD
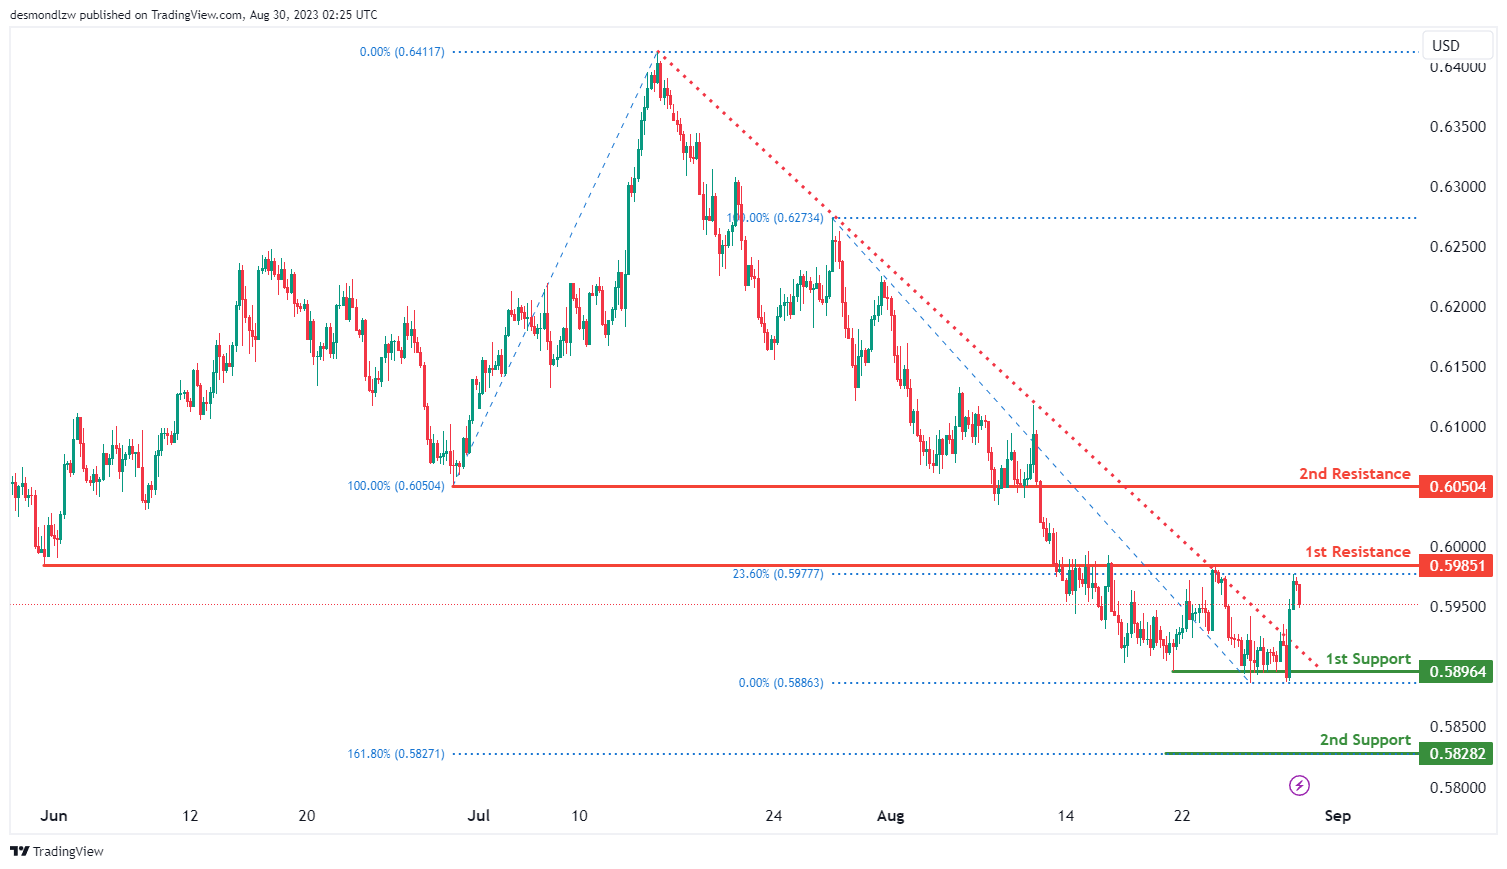
The NZD/USD chart currently exhibits a bearish momentum, indicating a downward trend in the price movement. There is potential for price to continue its bearish trajectory towards the 1st support level.
The 1st support level at 0.5896 is identified as a multi-swing low support while the 2nd support at 0.5828 is identified as a support level that aligns with the 161.80% Fibonacci extension level.
To the upside, the 1st resistance level of 0.5985 is identified as an overlap resistance that aligns with the 23.60% Fibonacci retracement level. Furthermore, the 2nd resistance at 0.6050 is also identified as an overlap resistance.
DJ30:
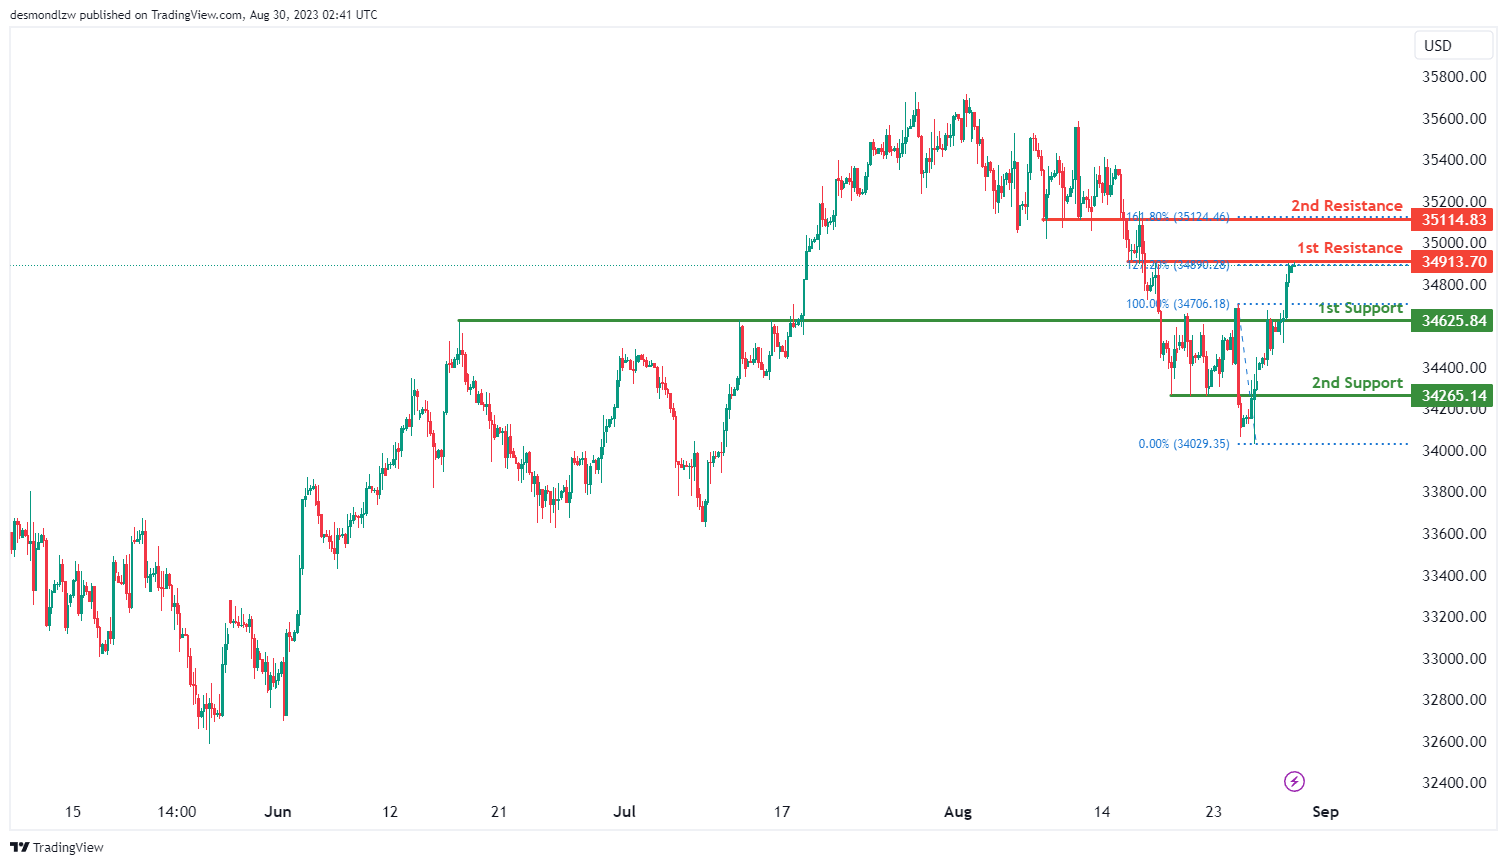
The DJ30 (Dow Jones 30) chart indicates a bearish overall momentum.
The 1st support level at 34265.80 is an overlap support, suggesting a potential area where price might find some buying interest.
The 2nd support level at 34265.10 is also an overlap support, reinforcing the significance of this zone.
On the resistance side, the 1st resistance level at 34913.70 is considered a pullback resistance and is further supported by the 127.20% Fibonacci extension level.
The 2nd resistance level at 35114.80 is an overlap resistance and is also coinciding with the 161.80% Fibonacci extension.
GER30:
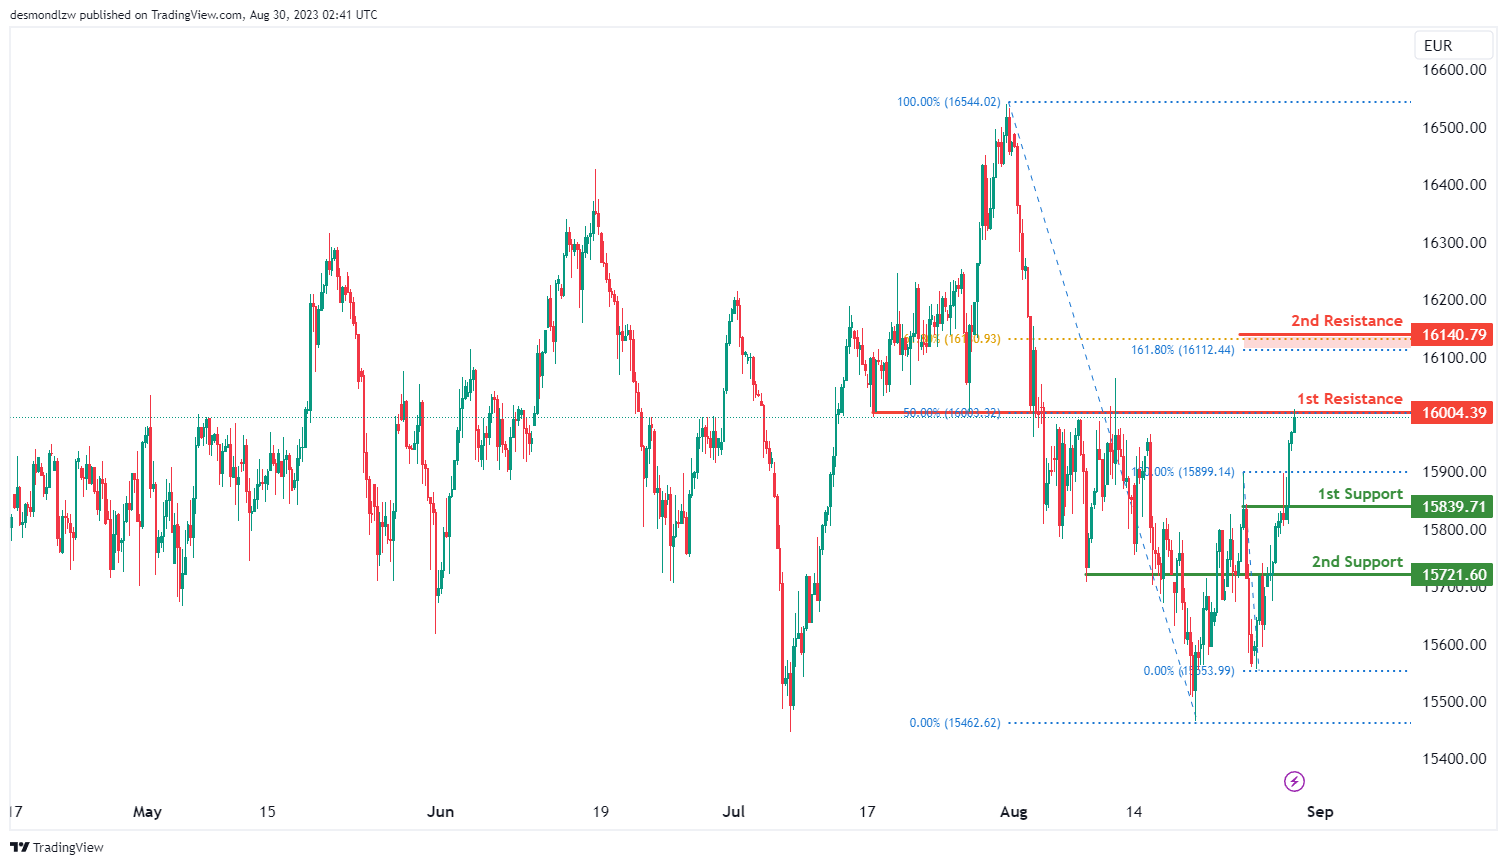
The GER30 (DAX 30) chart is showing a bearish overall momentum.
The 1st support level at 15839.70 is an overlap support, indicating a potential area where price could find some buying interest.
The 2nd support level at 15721.60 is also an overlap support, further strengthening the significance of this level.
On the resistance side, the 1st resistance level at 16004.30 is an overlap resistance, suggesting a potential area where selling pressure might emerge. This level is also supported by the 50% Fibonacci retracement.
The 2nd resistance level at 16140.70 is particularly interesting as it’s coinciding with both the 61.80% Fibonacci retracement and the 161.80% Fibonacci extension. This is a Fibonacci confluence zone, potentially adding to its significance.
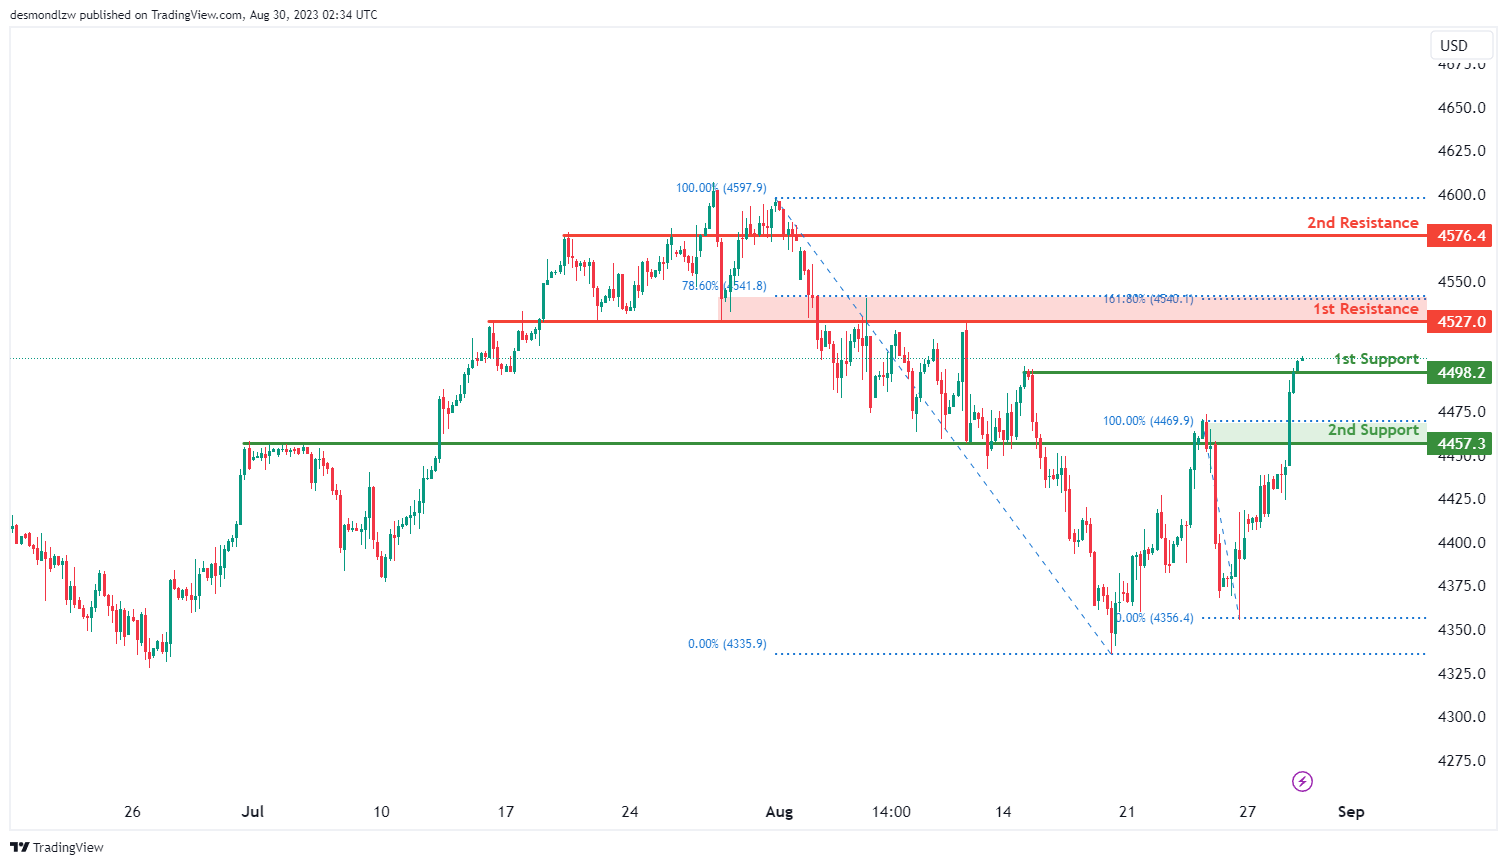
US500
The US500 chart is currently exhibiting bullish momentum. Within this upward trajectory, there’s potential for the index to proceed with its bullish course, aiming for the 1st resistance level situated at 4527.0. This resistance is not only characterized by its overlap status but is further underscored by a notable Fibonacci confluence, aligning with both the 78.60% Fibonacci Retracement and the 161.80% Fibonacci Extension. This confluence may enhance the resistance’s significance in terms of price interactions.
In the context of support, the 1st support level is pinpointed at 4498.2, identified as a pullback support, while the 2nd support level stands at 4457.3, designated as an overlap support. Both these levels offer potential areas where buying interest might intensify. On the higher side, beyond the 1st resistance, the 2nd resistance is found at 4576.4 and is distinguished by its overlap resistance status, marking another potential ceiling for bullish movements.
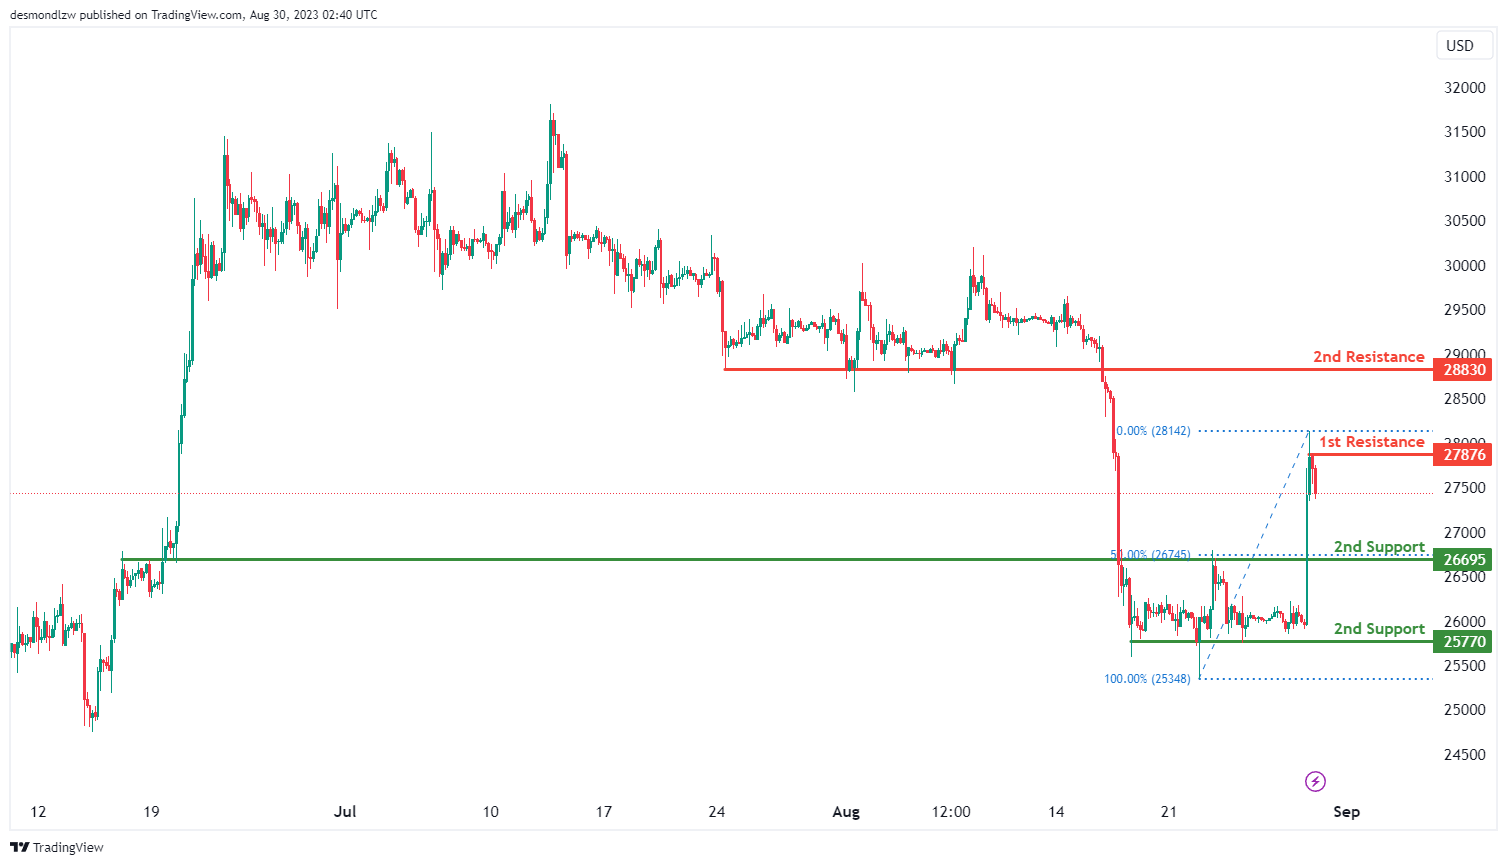
BTC/USD:
The BTC/USD chart indicates a bearish overall momentum.
The 1st support level at 26695 is an important level due to its characteristics as an overlap support and coincides with the 50% Fibonacci retracement level.
The 2nd support level at 25770 holds significance as a multi-swing low support.
On the resistance side, the 1st resistance level at 27876 is considered a swing high resistance.
The 2nd resistance level at 28830 gains importance as a pullback resistance.
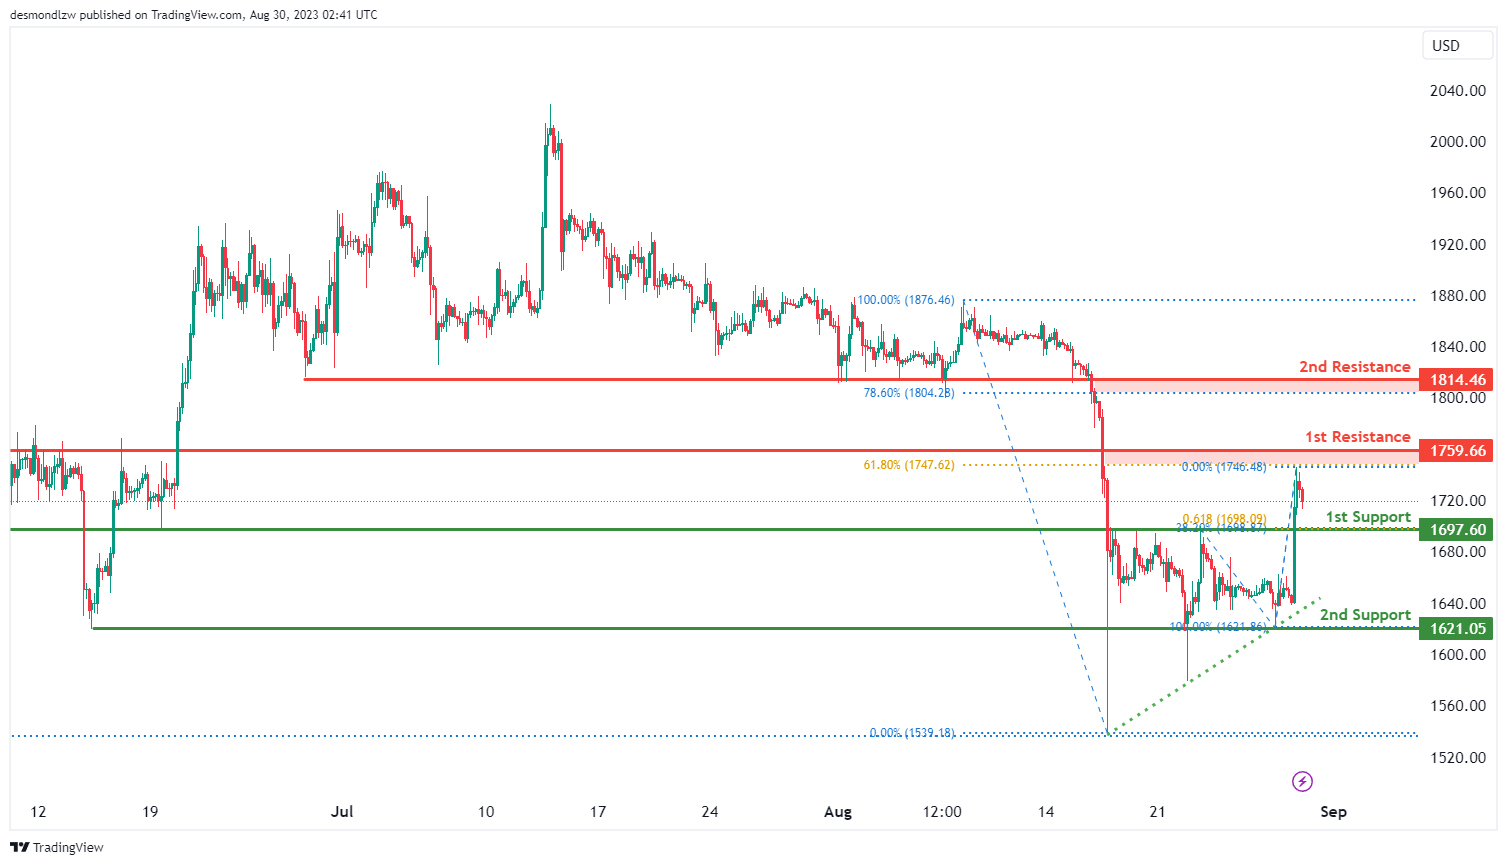
ETH/USD:
The ETH/USD chart indicates a bearish overall momentum.
The 1st support level at 1697.60 is significant due to its characteristics as an overlap support and its confluence with the 38.20% Fibonacci retracement level and the 61.80% Fibonacci projection.
The 2nd support level at 1621.00 is a multi-swing low support, which could also act as a potential area of interest.
On the resistance side, the 1st resistance level at 1759.60 is considered an overlap resistance.
The 2nd resistance level at 1814.40 holds importance as a pullback resistance coinciding with the 78.60% Fibonacci retracement level.
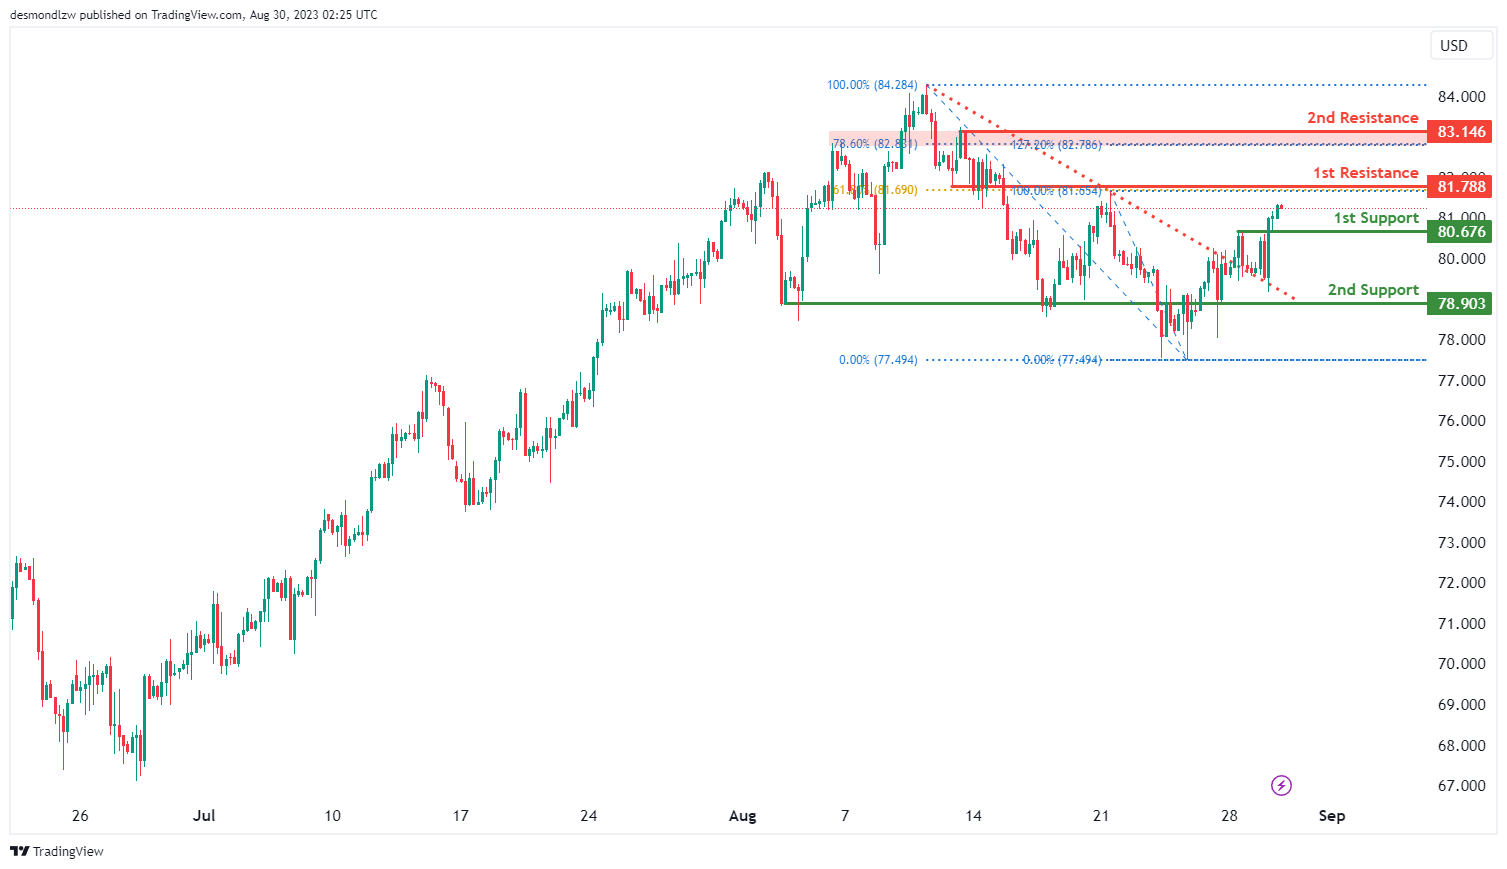
WTI/USD:
The current momentum of the WTI chart suggests a bullish trend, which has been spurred by the price’s breakthrough above a descending trendline. This breakout has ignited the potential for a bullish price movement towards the 1st resistance level.
The 1st resistance level at 81.79 is identified as an overlap resistance that aligns with the 61.80% Fibonacci retracement level. In addition, the 2nd resistance level at 83.15 is identified as pullback resistance that aligns with a confluence of Fibonacci levels i.e. the 78.60% retracement and the 127.20% extension levels, reinforcing this level as a significant resistance barrier.
To the downside, the 1st support level at 80.68 is identified as a pullback support while the 2nd support level at 78.90 is identified as an overlap support.
XAU/USD (GOLD):
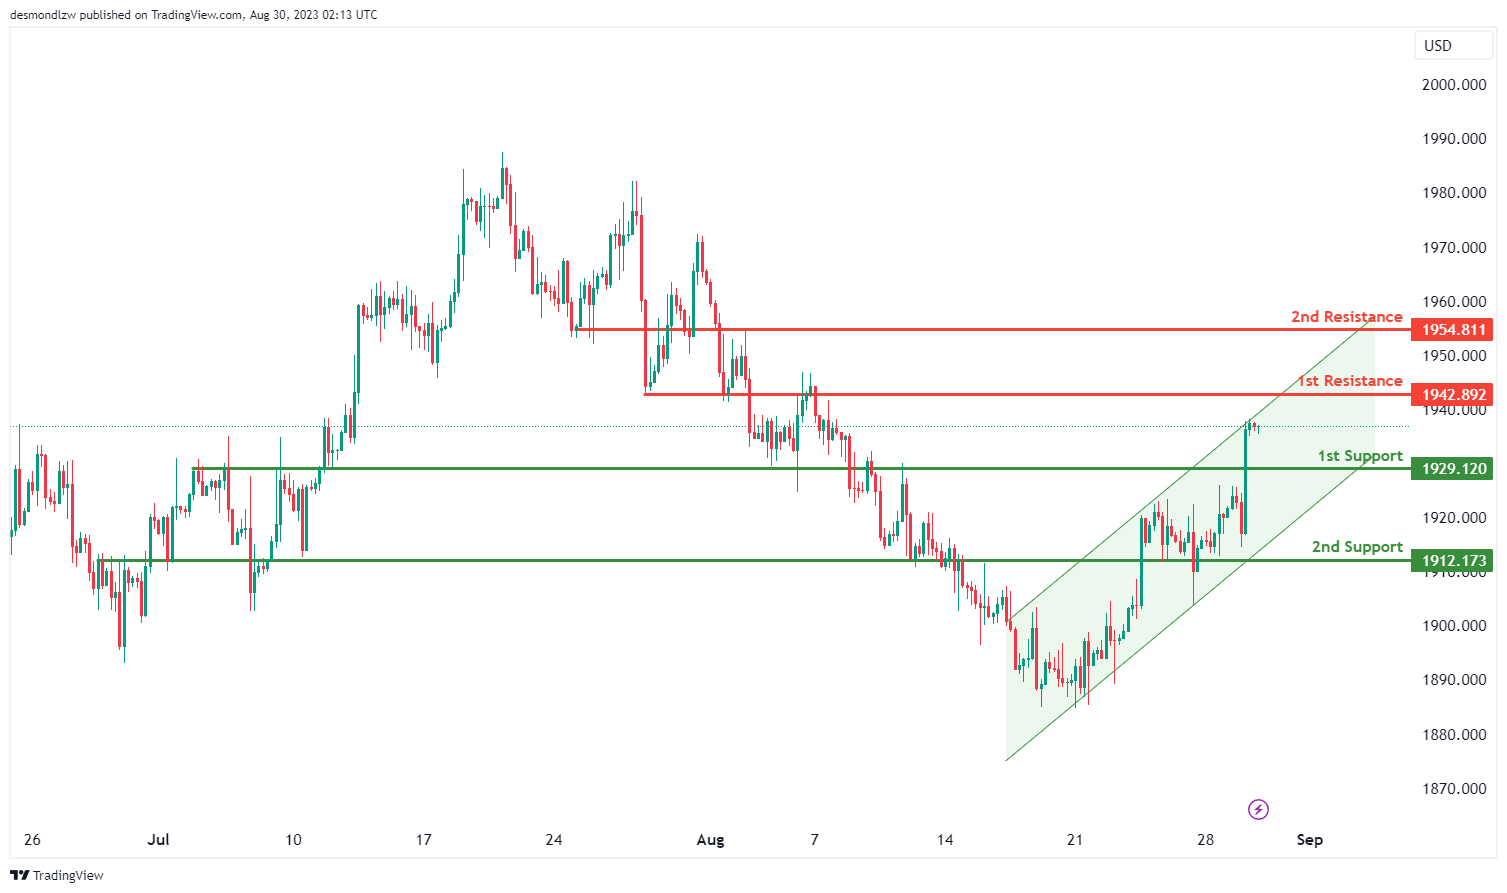
The XAU/USD chart is currently exhibiting a bullish overall momentum, indicating an upward trend in its price movement. This momentum is reinforced by the fact that the price is contained within a bullish ascending channel, suggesting a potential for further upward movement.
In terms of potential price movements, there are key levels to consider:
The 1st support level at 1929.12 is identified as a pullback support. This level represents an area where the price might find support during pullback phases within the overall bullish trend.
The 2nd support level at 1912.17 is considered an overlap support, implying that historical price action has found support around this level before. This adds to the potential significance of this level as a potential support zone.
On the upside, the 1st resistance level at 1942.89 is noted as an overlap resistance. Historical price action has encountered resistance in this region previously, making it a level to watch for potential reversals or continuation patterns.
The 2nd resistance level at 1954.81 is also marked as an overlap resistance. Similar to the 1st resistance, this level could act as a target for the bullish movement if the price continues its upward momentum.


