
- Erased prior two weeks of consecutive losing streaks to trade a current year-to-date closing high of US$86.31 per barrel printed on last Friday, 1 September.
- Price actions are oscillating within short-term and medium-term uptrend phases.
- Hourly technical indicators (RSI & Bollinger Bands Bandwidth) are suggesting the risk of an imminent minor pull-back in price actions after last week’s strong upside reversal.
- Watch the key short-term pivotal resistance at US$87.25 per barrel.
The price actions of West Texas Oil (a proxy of WTI crude oil futures) have managed to snap its prior two weeks of consecutive losing streak and cleared above the US$84.90 resistance as highlighted in our previous report. Also, it recorded a weekly gain of +7.35% for the week ended last Friday, 1 September.
Rallied to a 10-month high
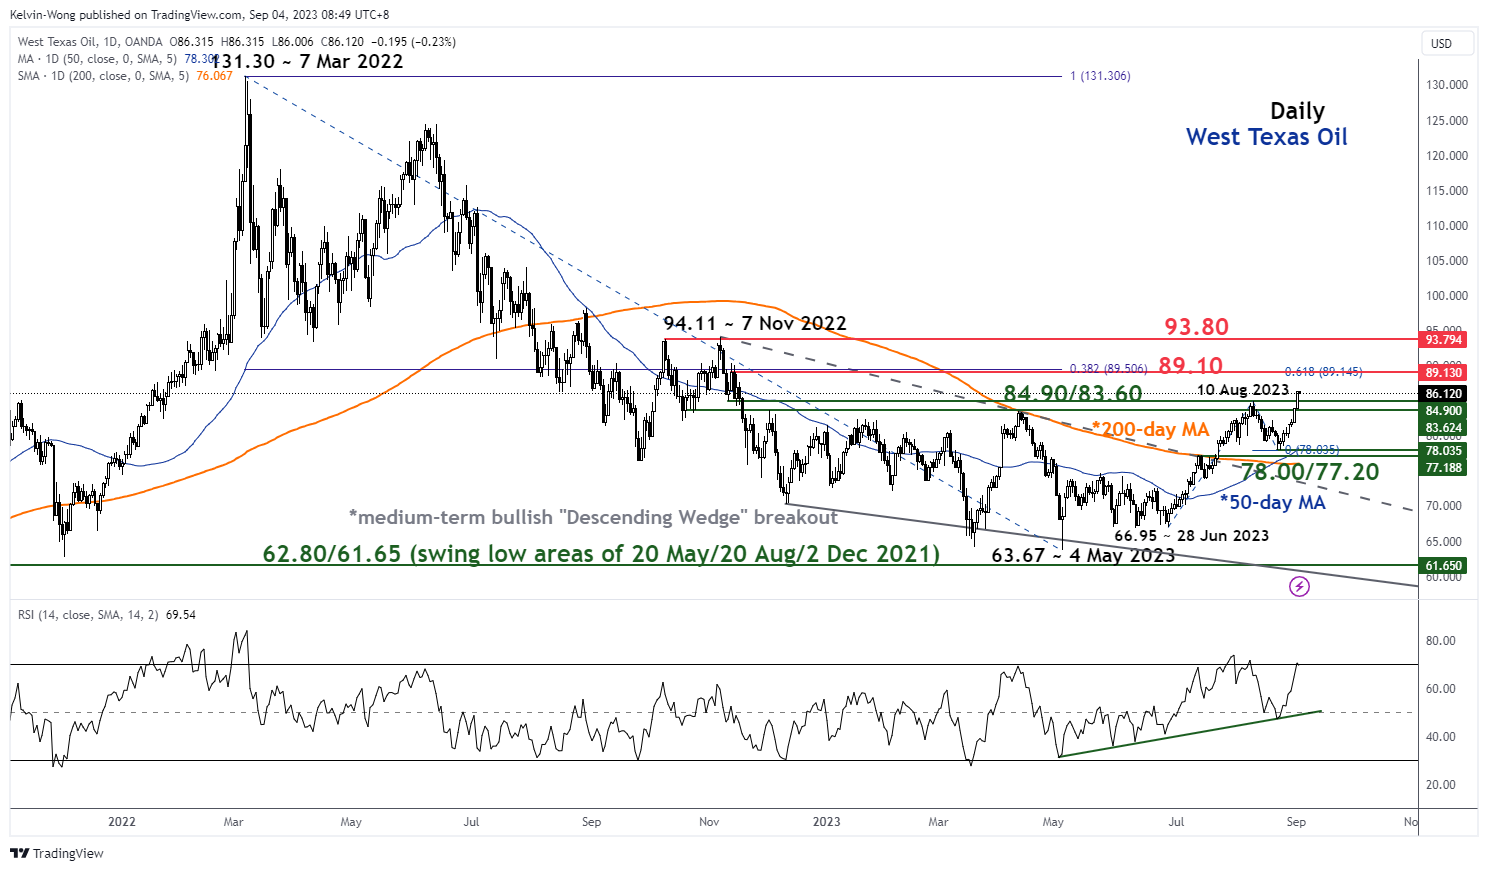
Fig 1: West Texas Oil medium-term trend as of 4 Sep 2023 (Source: TradingView, click to enlarge chart)
In addition, last Friday’s bullish momentum has allowed it to surpass its recent medium-term swing high of US$84.92 per barrel printed on 10 August 2023 and notched a current year-to-date closing high of US$86.31 on last Friday, also its highest level since 15 November 2022.
In addition, current price actions have managed to trade above their respective 20, 50, and 200-day moving averages which indicates that West Texas Oil is oscillating within short-term and medium-term uptrend phases.
Risk of an imminent minor pull-back in price actions
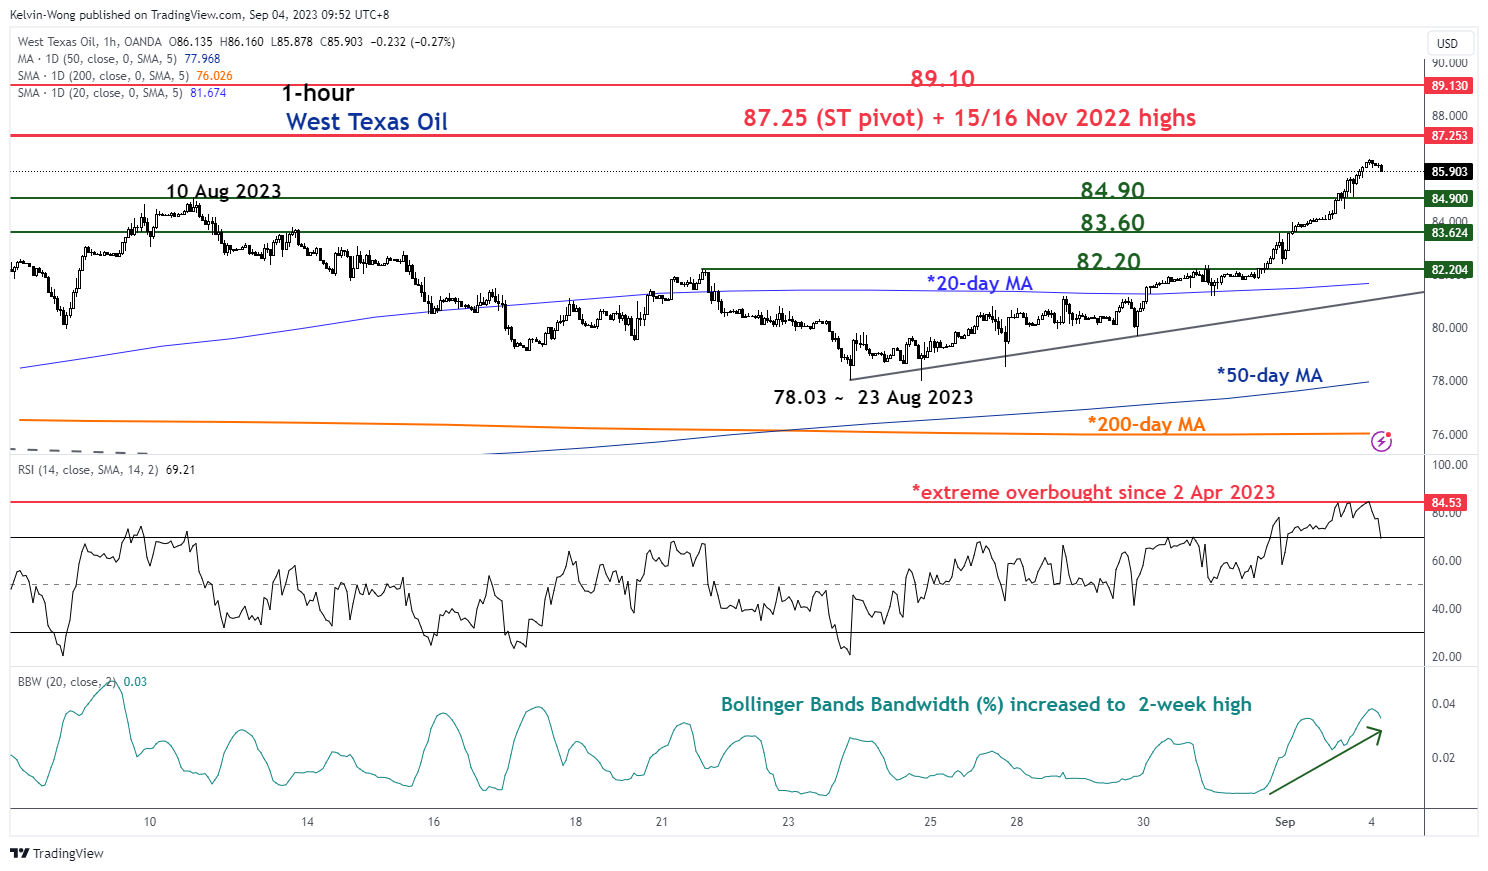
Fig 2: West Texas Oil minor short-term trend as of 4 Sep 2023 (Source: TradingView, click to enlarge chart)
However, the current up move of +10.7% from its 23 August 2023 low of US$78.03 to its 1 September 2023 high of US$86.36 seems overstretched which suggests that the current short-term uptrend phase is due for a potential minor pull-back/setback.
Two key technical conditions are advocating this potential minor pull-back/setback scenario for West Texas Oil within its ongoing short to medium-term uptrend phases.
Firstly, the hourly RSI oscillator has exploded to an extreme overbought condition of 84.53, its highest level since 2 April 2023. Secondly, the hourly Bollinger Bands Bandwidth (%) has increased to a two-week high which indicates a significant expansion in short-term volatility.
An expansion in short-term volatility as indicated by the widening of the hourly Bollinger Bands Bandwidth (%) tends to lead to a normalization of such a heightened level of volatility in the next few trading sessions which supports an imminent potential minor pull-back/setback for price actions.
Watch the US$87.25 key short-term pivotal resistance to maintain the potential minor pull-back/setback scenario for West Texas Oil towards the intermediate supports at US$84.90 and US$83.60.
However, a clearance above US$87.25 invalidates the minor bearish tone for a continuation of the bullish impulsive up move sequence to see the next resistance at US$89.10 (Fibonacci retracement/extension cluster; 38.2% Fibonacci retracement of the major downtrend from 7 March 2022 high to 4 May 2023 low & 0.618 Fibonacci extension of the medium-term uptrend from 28 June 2023 low to 10 August 2023 high projected to 23 August 2023 low).


 have managed to snap its prior two weeks of consecutive losing streak and cleared above the US$84.90 resistance as highlighted in our previous report. Also, it recorded a weekly gain of +7.35% for the week ended last Friday, 1 September.)