
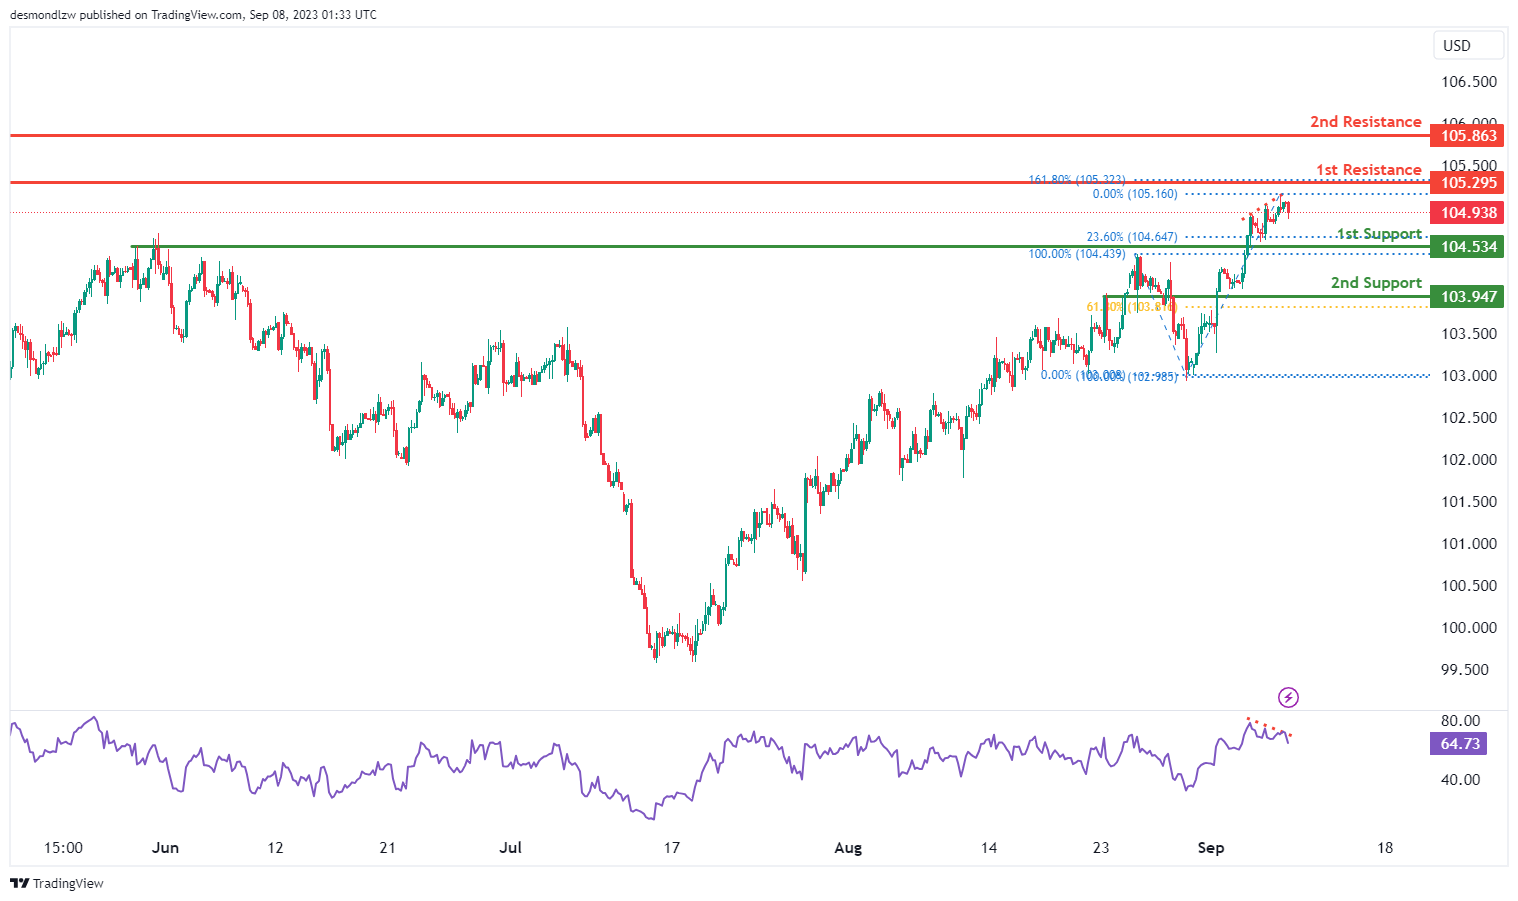
DXY:
The DXY chart presently demonstrates a bearish momentum, indicating a predisposition for further downward movement.
The 1st support level at 104.53 and the 2nd support level at 103.94 are both recognized as overlap supports, underlining their significance in potentially halting price declines.
Conversely, on the resistance side, the 1st resistance at 105.29 is classified as a swing high resistance, while the 2nd resistance at 105.86 also functions as a swing high resistance.
Furthermore, it is worth noting that the Relative Strength Index (RSI) is exhibiting bearish divergence in comparison to the price. This observation implies an increased likelihood of a swift and substantial price decline in the near term.
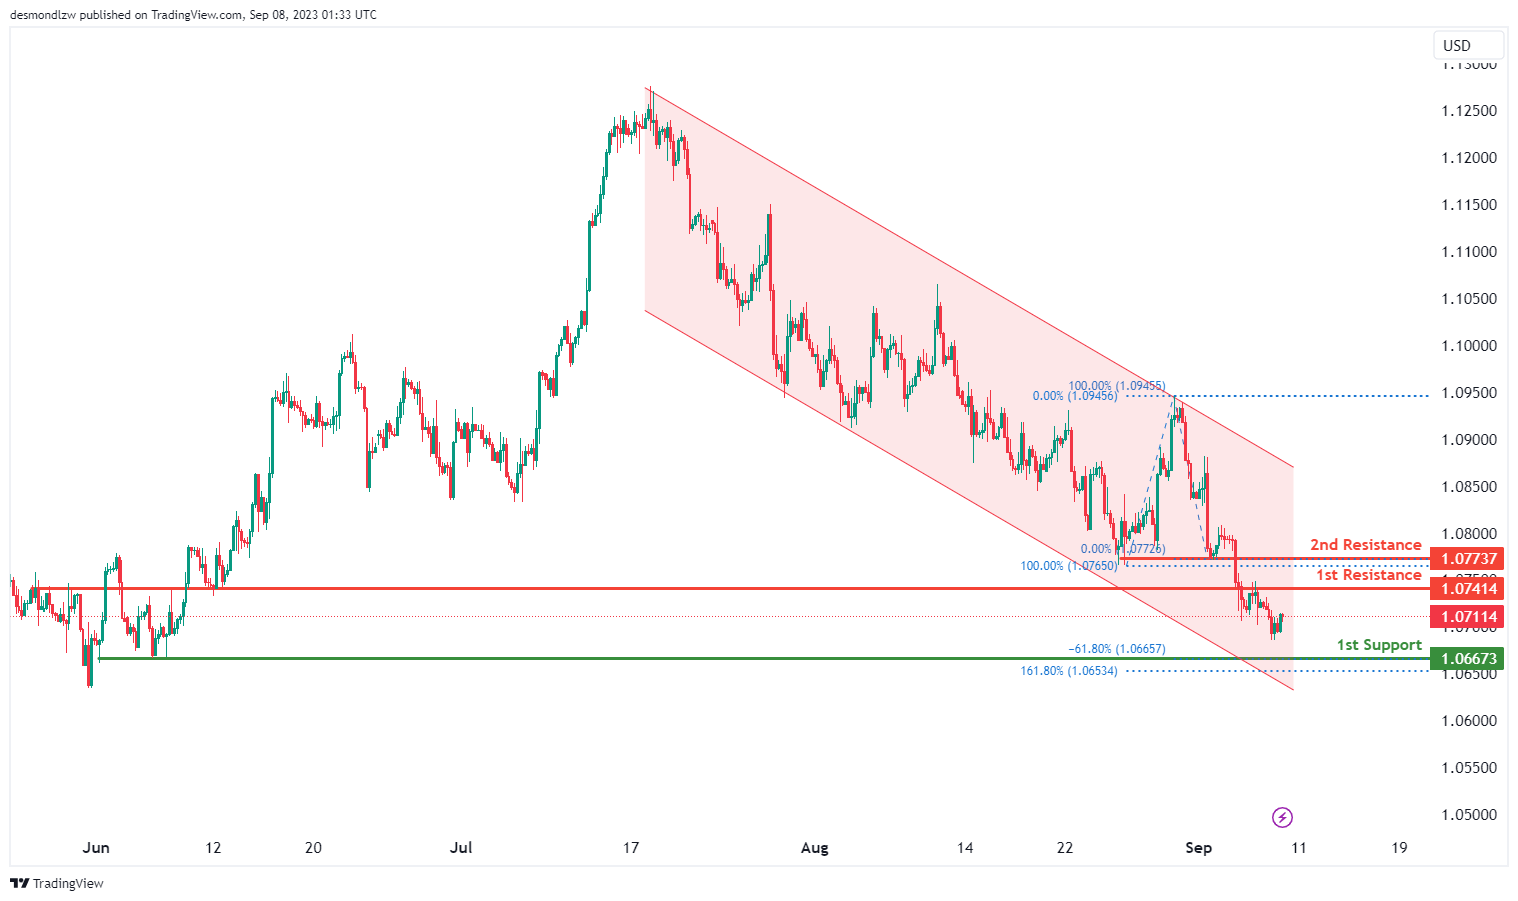
EUR/USD:
The EUR/USD chart currently maintains a bearish momentum, as indicated by its position within a bearish descending channel.
There’s a potential for a bearish continuation towards the first support level at 1.0667. This support is significant due to its alignment with swing low support, the presence of the 161.80% Fibonacci Extension, and the -61.8% Fibonacci Expansion, indicating a strong Fibonacci confluence.
On the resistance side, the first resistance at 1.0741 is identified as an overlap resistance, while the second resistance at 1.0773 also functions as a pullback resistance. These levels could potentially act as barriers to any bullish movements.
EUR/JPY:
The instrument EUR/JPY currently exhibits a bearish overall momentum on the chart.
In this context, there is a potential for price to have a bearish reaction off the 1st resistance level and drop towards the 1st support.
The 1st support level at 157.10 is considered strong because it represents multi-swing low support.
Additionally, there is a 2nd support level at 156.54, which is significant as it represents an overlap support.
On the resistance side, the 1st resistance level at 157.89 is noteworthy because it serves as an overlap resistance and aligns with both a 50% Fibonacci Retracement and a 61.80% Fibonacci Projection, indicating Fibonacci confluence.
Furthermore, the 2nd resistance level at 158.50 is considered significant as it represents multi-swing high resistance and aligns with a 50% Fibonacci Retracement.
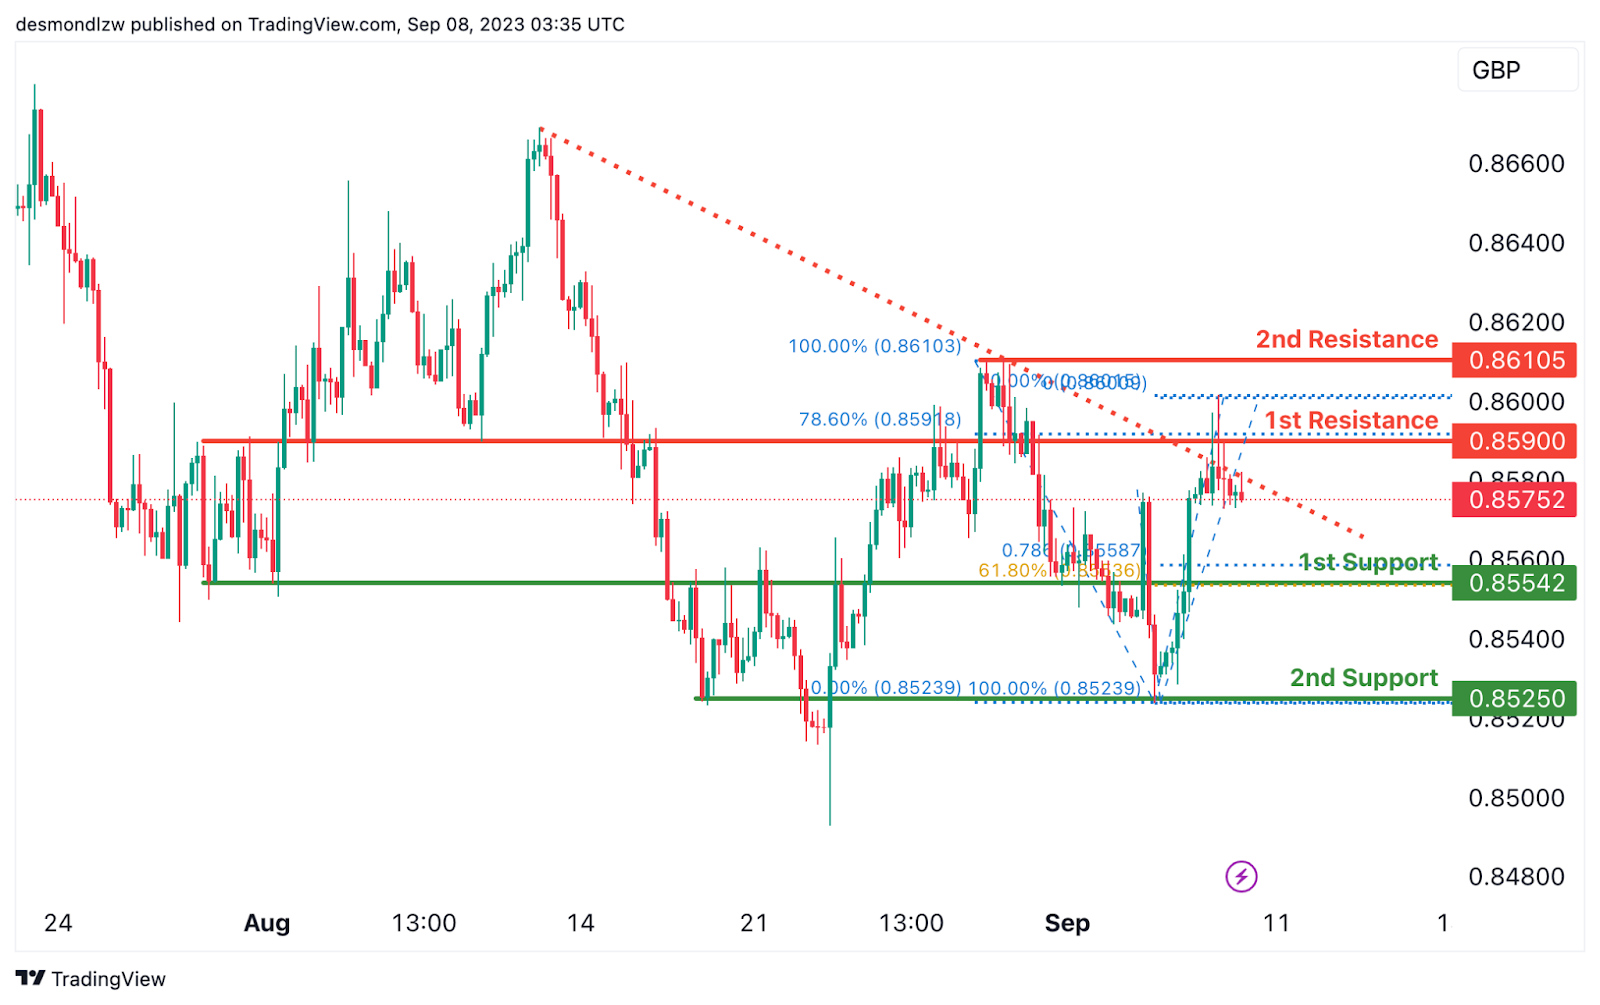
EUR/GBP:
The instrument EUR/GBP currently has a bearish overall momentum, and this momentum is influenced by the fact that the price is below a major descending trend line, indicating a bearish bias.
In this scenario, there’s a potential for price to continue in a bearish direction towards the 1st support level.
The 1st support level at 0.8554 is considered strong as it represents a pullback support, aligning with the 61.80% Fibonacci Retracement and it coincides with the 78.6% Fibonacci Projection, indicating Fibonacci confluence.
Additionally, there is a 2nd support level at 0.8525, which is significant as it represents an overlap support.
On the resistance side, the 1st resistance level at 0.8590 is noteworthy because it serves as an overlap resistance and aligns with a 78.60% Fibonacci Retracement.
Furthermore, the 2nd resistance level at 0.8610 is considered significant as it represents a swing high resistance.
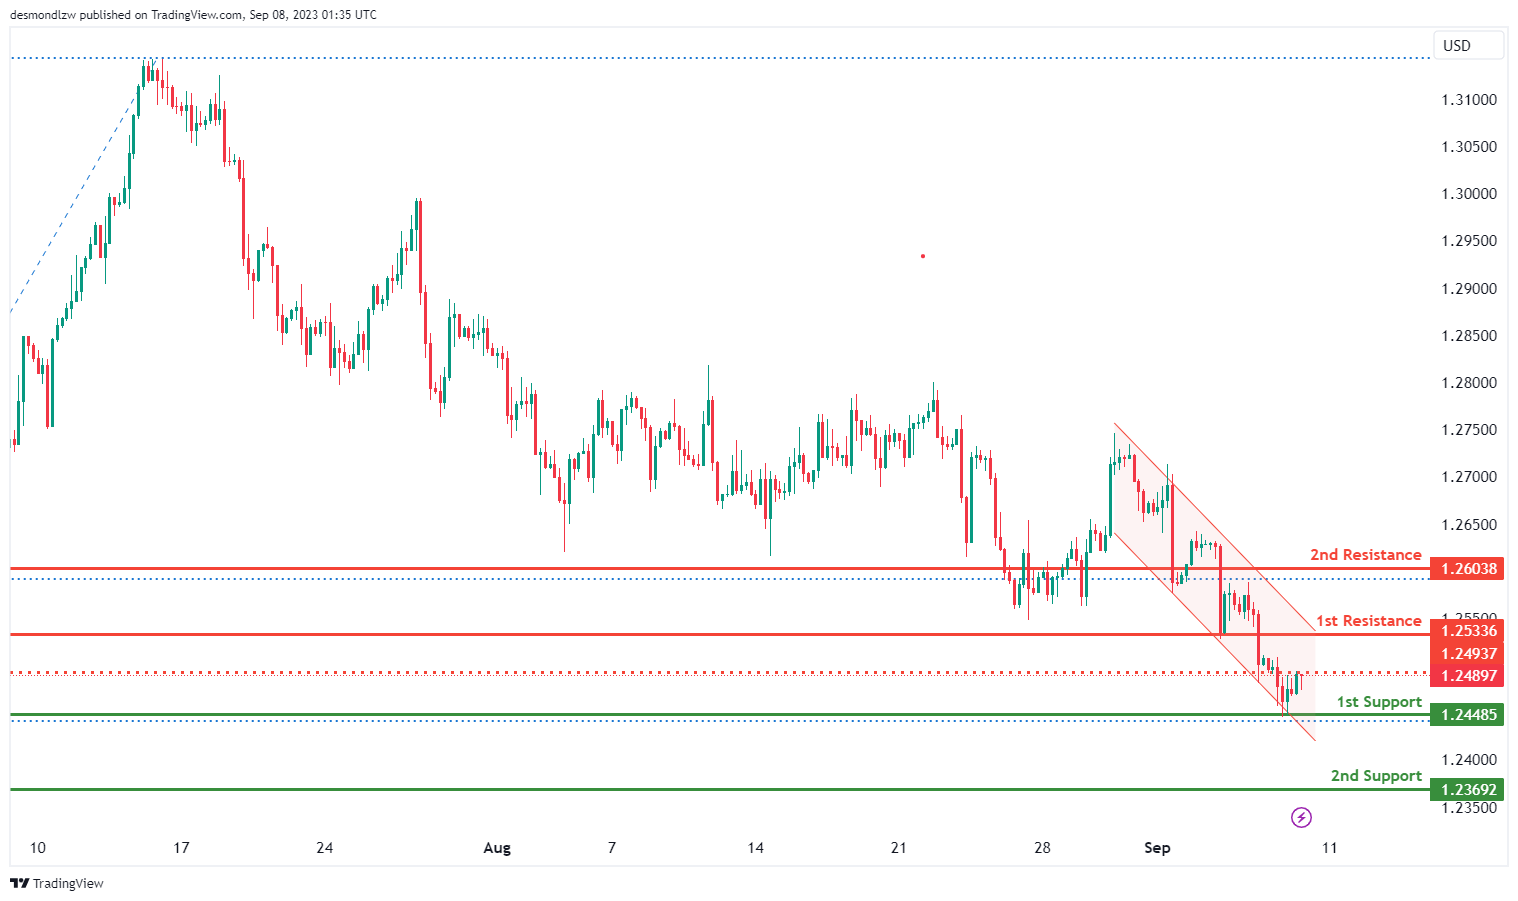
GBP/USD:
The GBP/USD chart currently exhibits a bearish momentum, characterized by its position within a descending channel.
In the short term, there’s a possibility that the price could rise towards the first resistance level at 1.2533 before potentially reversing off it and dropping towards the first support level at 1.2448.
The first support at 1.2448 is identified as an overlap support and aligns with the 127.20% Fibonacci Expansion, adding to its significance as a potential area of price support.
Another first support at 1.2369 is marked as an overlap support, suggesting that historical price action has found support in this area.
On the resistance side, the first resistance at 1.2533 is designated as a pullback resistance, while the second resistance at 1.2603 is also identified as an overlap resistance. Additionally, there’s an intermediate resistance at 1.2495, marked as a pullback resistance
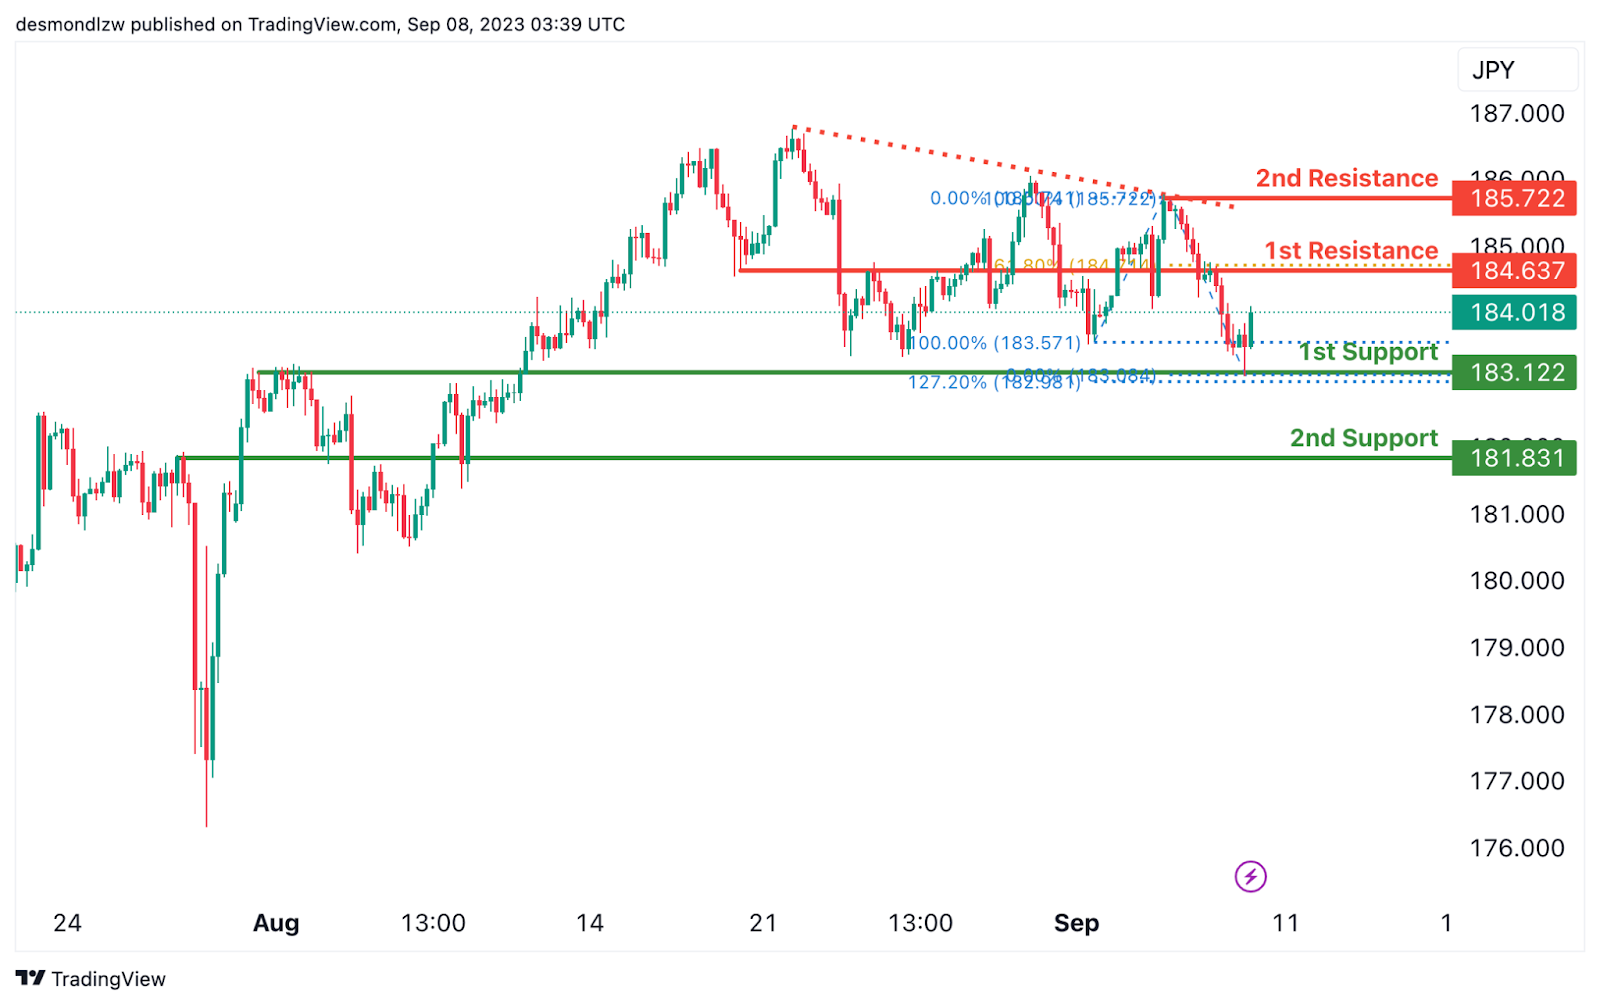
GBP/JPY:
The instrument GBP/JPY currently has a bullish overall momentum, suggesting that buyers are in control of the market.
In this scenario, there’s a potential for price to continue its bullish move towards the 1st resistance level.
The 1st support level at 183.12 is considered strong as it represents an overlap support and it aligns with the 127.20% Fibonacci Extension, indicating a potential extension of the previous uptrend.
Additionally, there is a 2nd support level at 181.83, which is significant as it represents an overlap support.
On the resistance side, the 1st resistance level at 184.63 is noteworthy because it serves as an overlap resistance and aligns with a 61.80% Fibonacci Retracement, indicating a potential reversal point.
Furthermore, the 2nd resistance level at 185.72 is considered significant as it represents a swing high resistance.
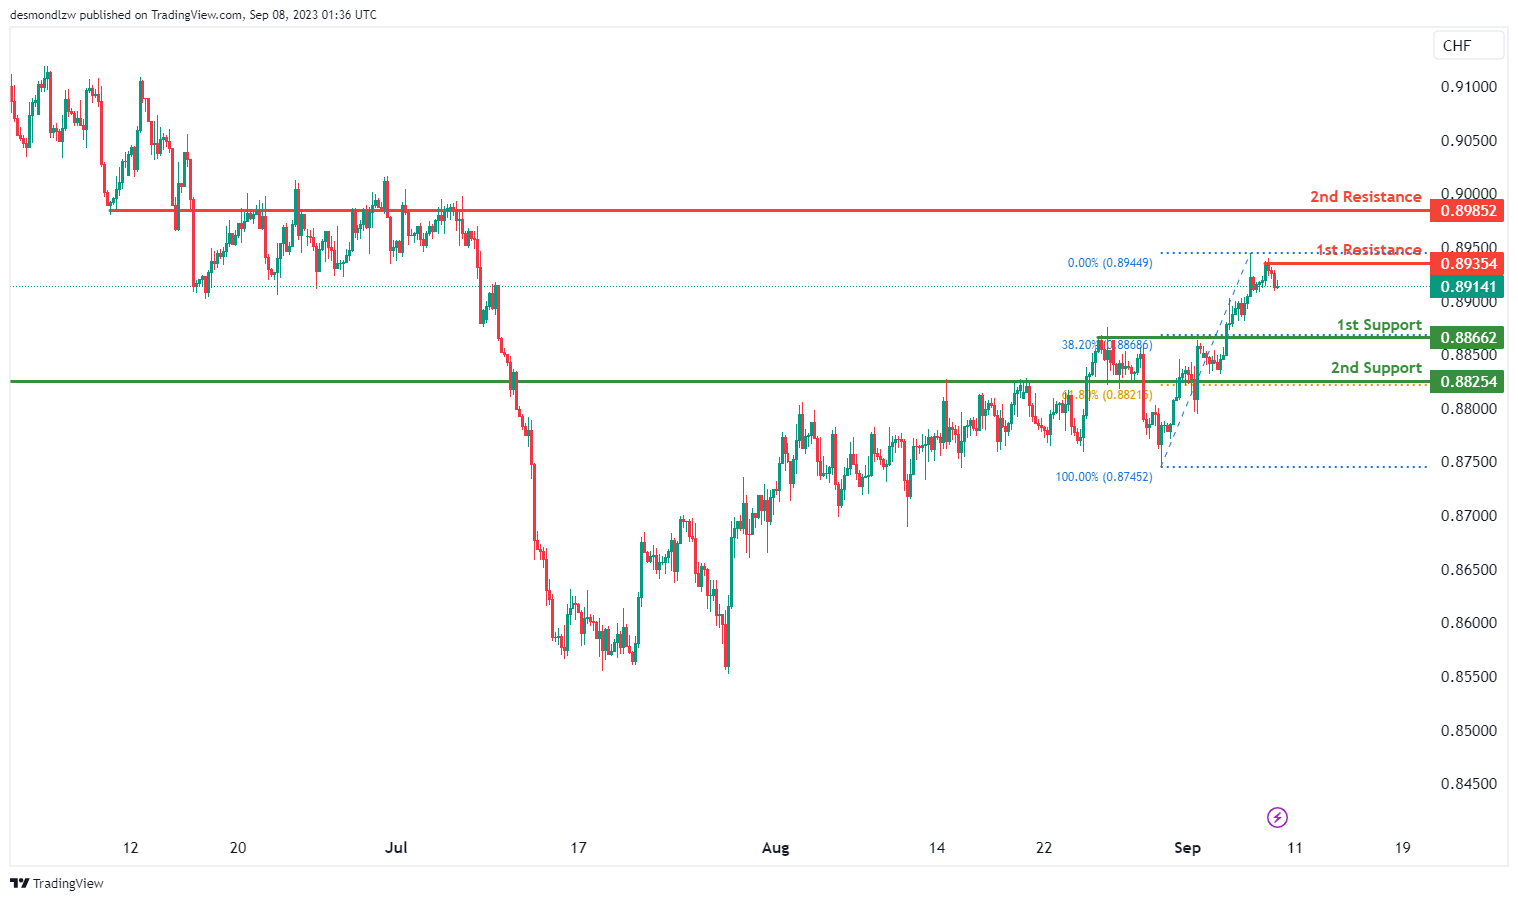
USD/CHF:
The USD/CHF chart currently demonstrates a bearish overall momentum, suggesting a potential downward trend in price movement.
There’s a likelihood of a bearish continuation towards the first support level at 0.8866, which is identified as a pullback support and aligns with the 38.20% Fibonacci Retracement level.
The second support level at 0.8825 is also noted as an overlap support, aligning with the 61.80% Fibonacci Retracement, reinforcing its importance as a potential area of price support.
On the resistance side, the first resistance at 0.8935 is considered significant as it represents swing high resistance. Furthermore, the second resistance at 0.8985 is identified as an overlap resistance, making it a noteworthy zone for potential price reactions. These resistance levels may act as barriers to any potential bullish movements.
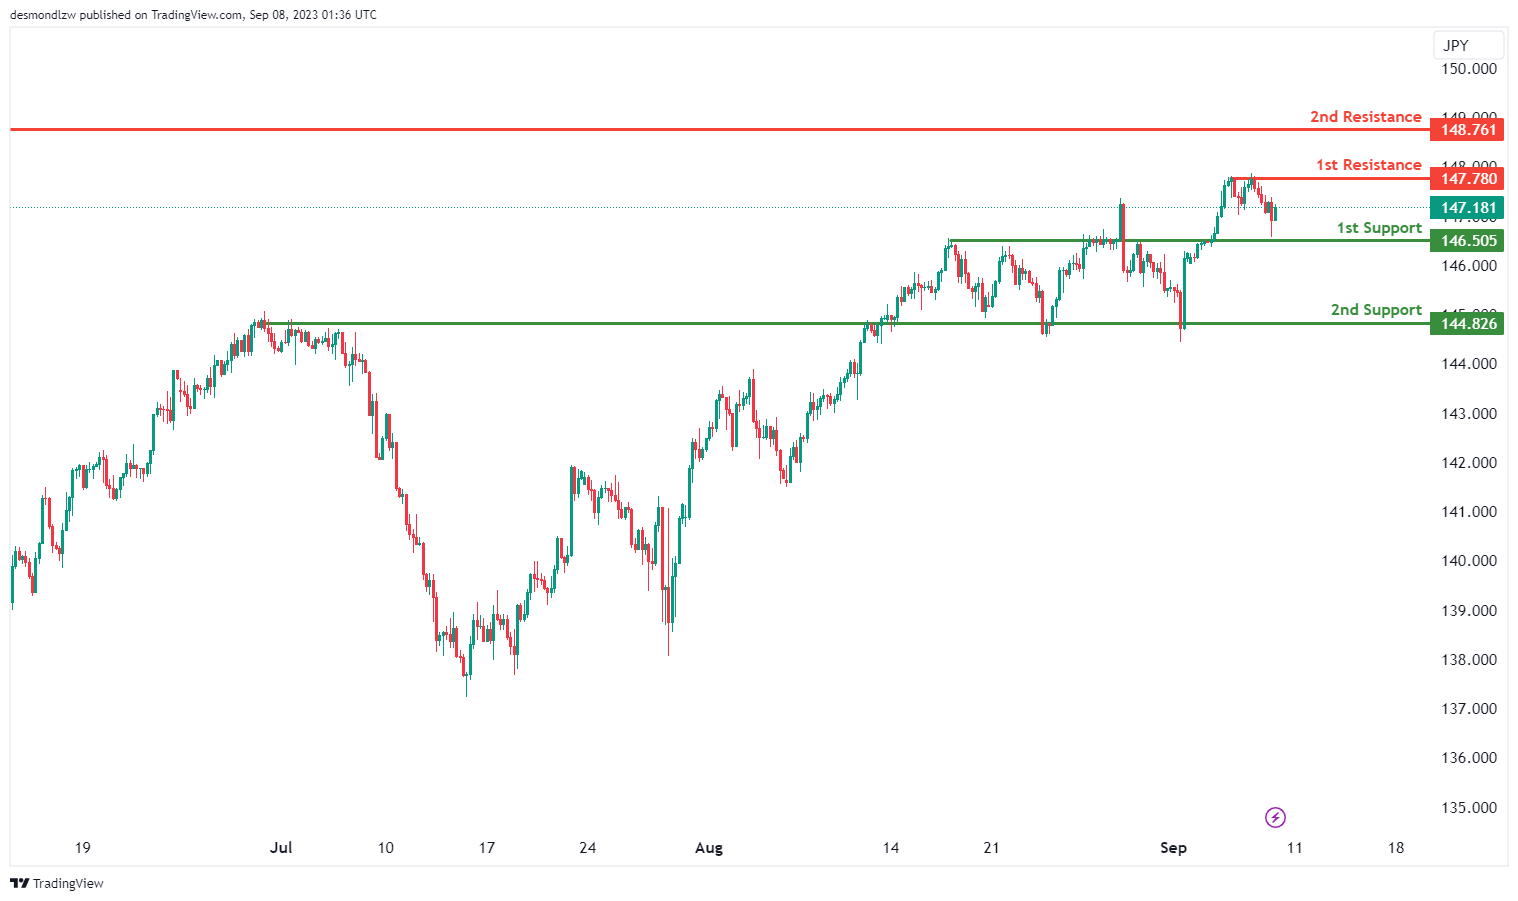
USD/JPY:
The USD/JPY chart currently maintains a bearish overall momentum. There’s a potential scenario where the price could rise towards the first resistance level at 148.76 in the short term before potentially reversing off it and dropping towards the first support.
The first support at 146.50 is identified as an overlap support, indicating historical instances of price finding support around this level. Similarly, the second support at 144.82 is also noted as an overlap support, further reinforcing its significance as a potential area of price support.
On the resistance side, the first resistance at 148.76 is considered significant as it represents swing high resistance. Additionally, the second resistance at 148.76 is also identified as swing high resistance.
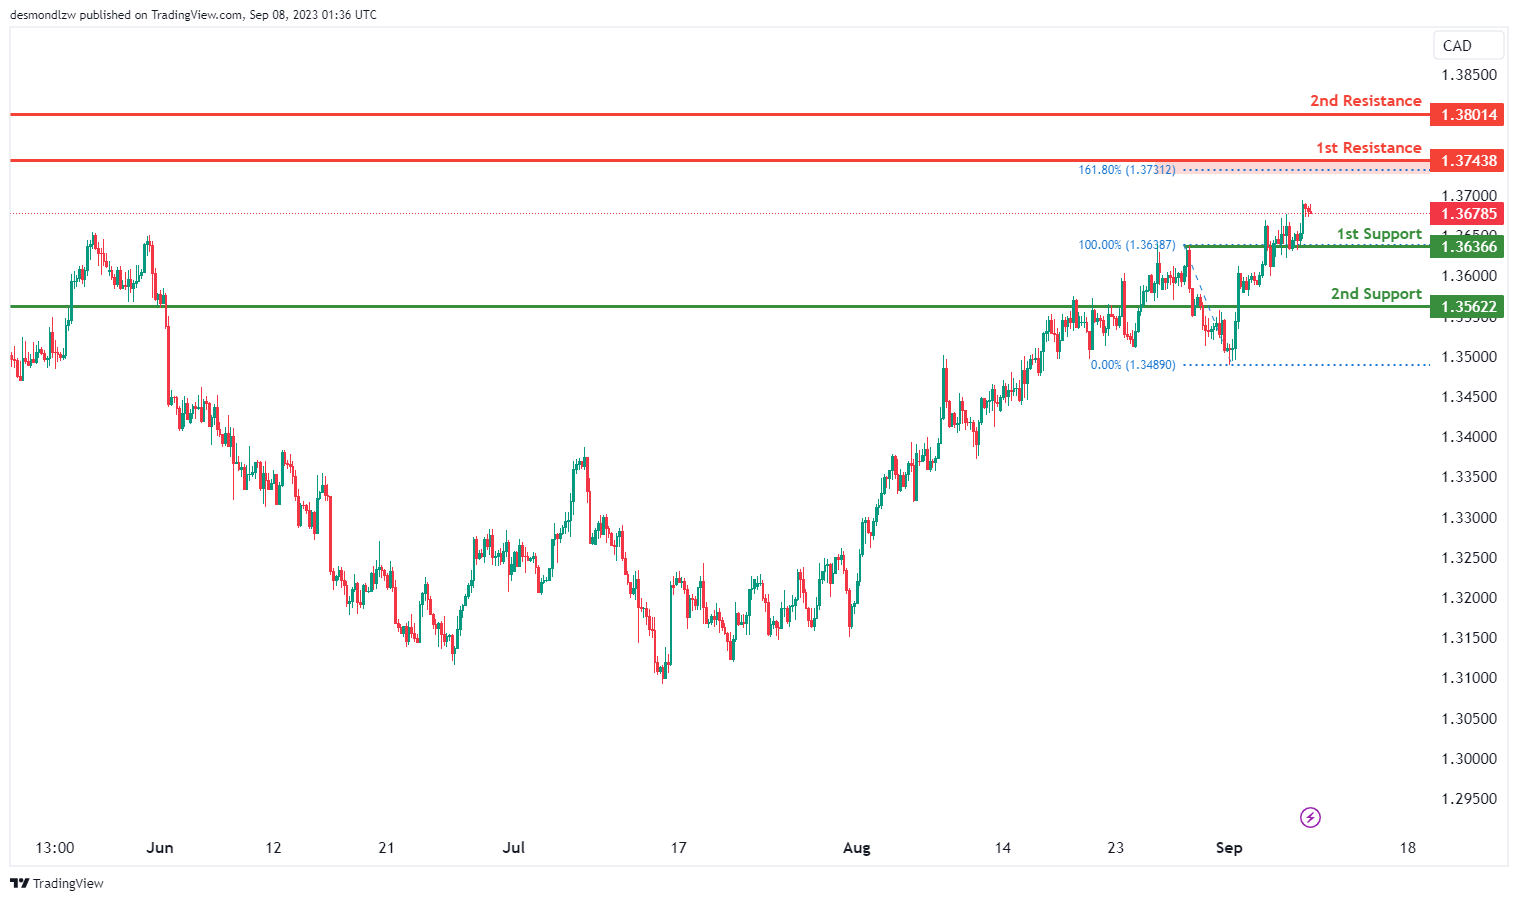
USD/CAD:
The USD/CAD chart currently indicates a bullish overall momentum, suggesting a potential upward trend in price movement.
There’s a possibility of a bullish continuation towards the first resistance level at 1.3743. This resistance is identified as an overlap resistance and aligns with the 161.80% Fibonacci Extension, signifying a strong potential resistance zone.
On the support side, there are two levels to watch. The first support at 1.3636 is considered significant as it represents an overlap support. Additionally, the second support at 1.3562 is noted as a pullback support, reinforcing its role as a potential area of price support.
Furthermore, the second resistance at 1.3801 is identified as an overlap resistance, which could act as a barrier to any potential bullish movements.
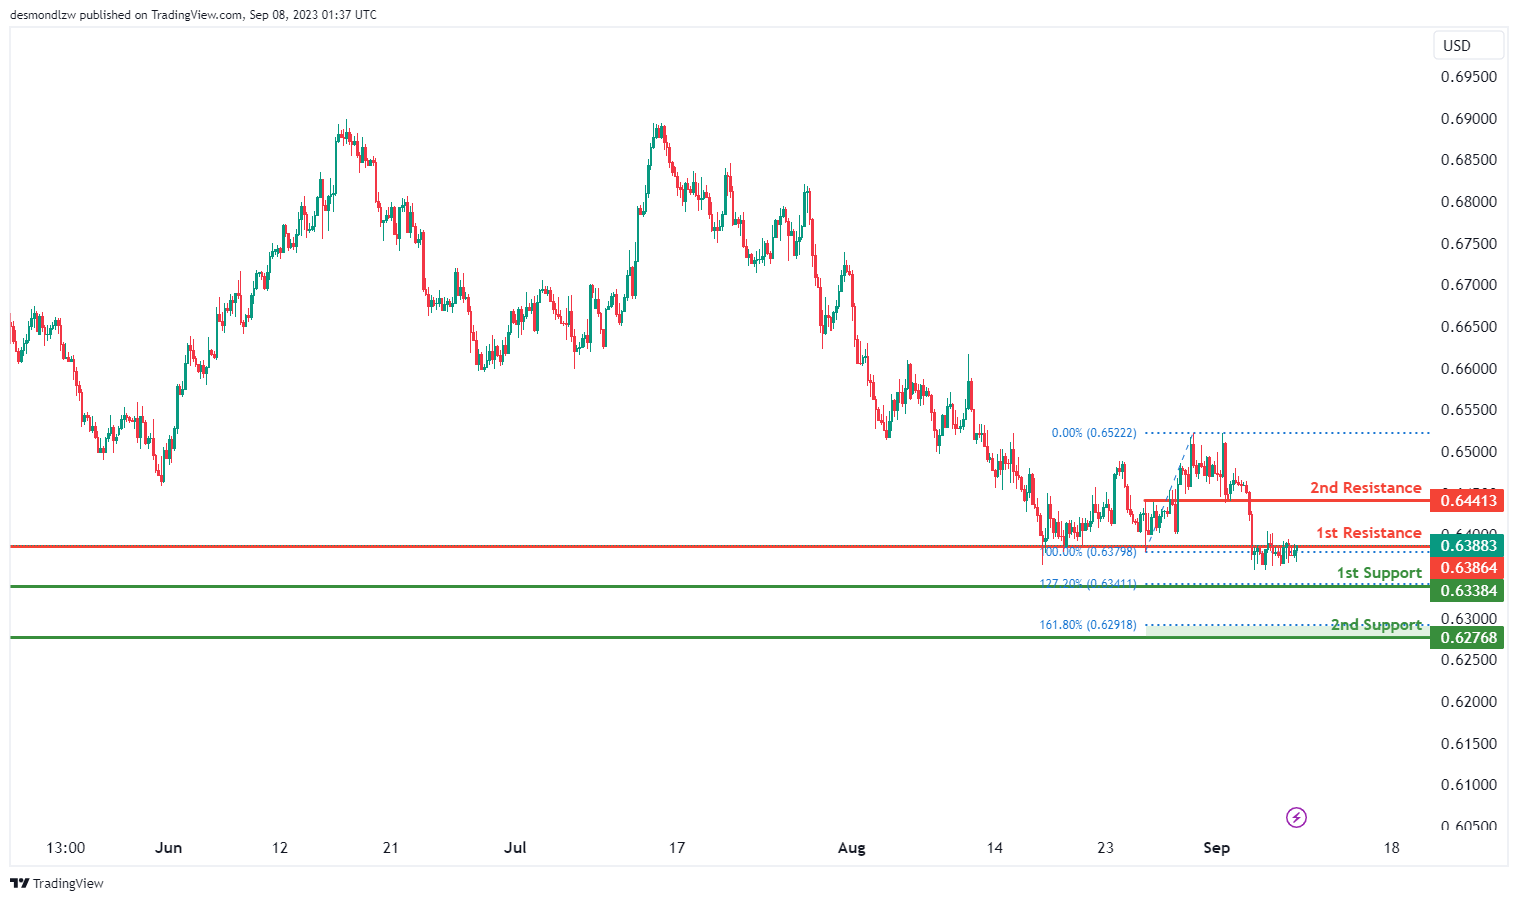
AUD/USD:
The AUD/USD chart currently reflects a neutral overall momentum, indicating a lack of a clear trend in price movement.
There’s a possibility that the price could oscillate within a range defined by the first support level at 0.6338 and the first resistance level at 0.6386.
The first support at 0.6338 is identified as an overlap support and is also aligned with the 127.20% Fibonacci Projection, potentially making it a significant level for price support.
Additionally, the second support at 0.6277 is noted as a pullback support and aligns with the 161.80% Fibonacci Projection, further reinforcing its role as a potential area of price support.
On the resistance side, the first resistance at 0.6386 is considered significant as it represents an overlap resistance, while the second resistance at 0.6441 is marked as a pullback resistance.
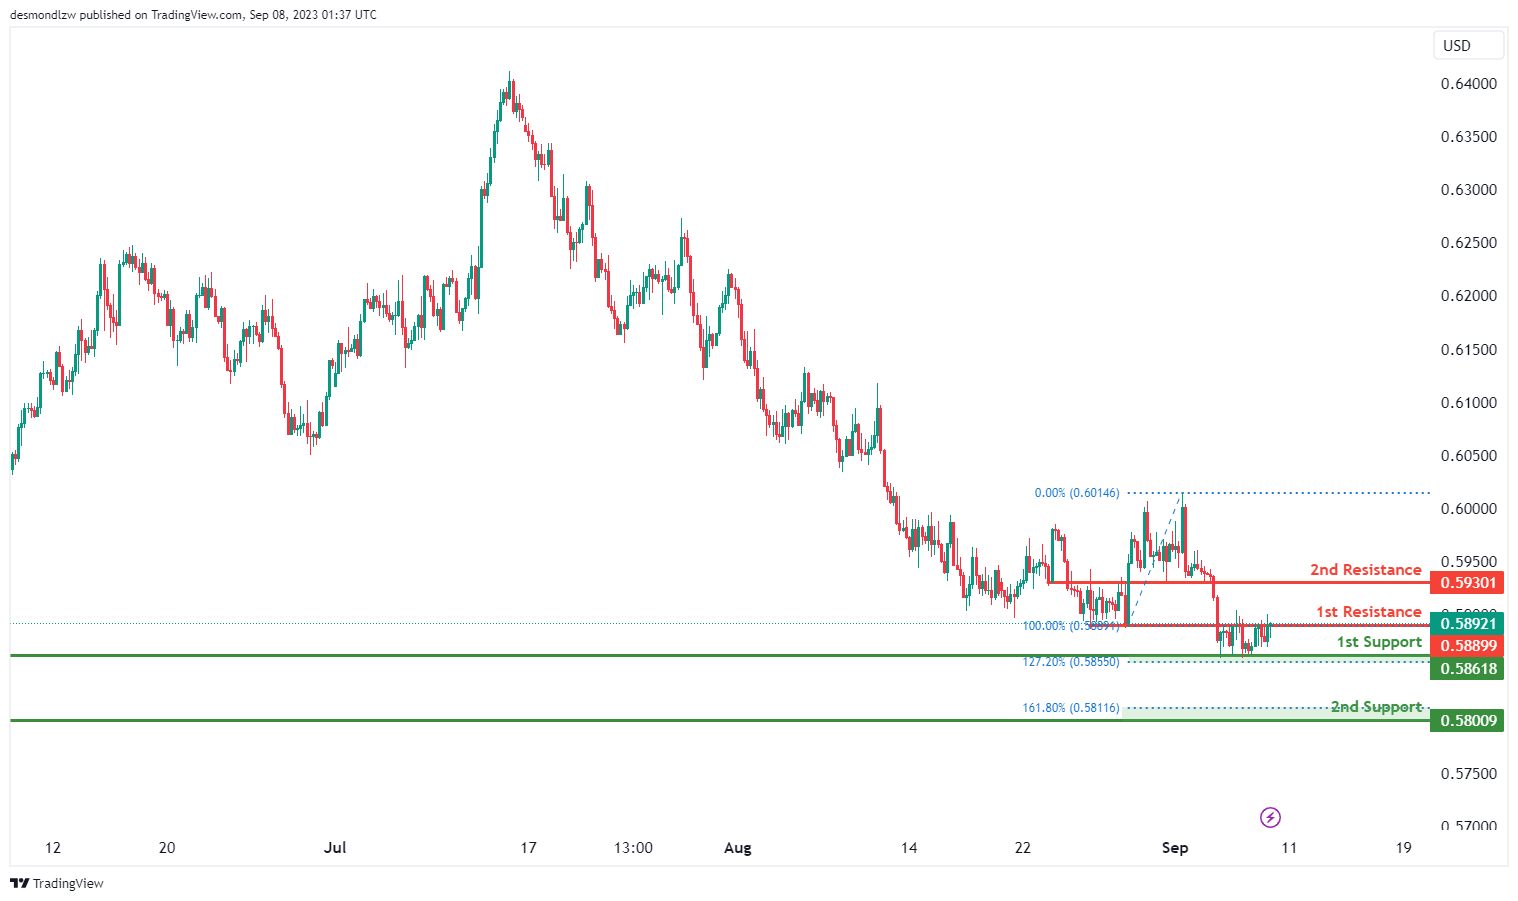
NZD/USD
The NZD/USD chart currently exhibits a neutral overall momentum, indicating a lack of a clear trend in price movement.
There’s a potential scenario where the price may fluctuate within a range defined by the first support level at 0.5800 and the first resistance level at 0.5889.
The first support at 0.5800 is identified as an overlap support and is also aligned with the 127.20% Fibonacci Extension, potentially making it a significant level for price support.
Similarly, the second support at 0.5861 is noted as an overlap support and aligns with the 161.80% Fibonacci Extension, reinforcing its role as a potential area of price support.
On the resistance side, the first resistance at 0.5889 is considered significant as it represents an overlap resistance, while the second resistance at 0.5930 is marked as a pullback resistance.
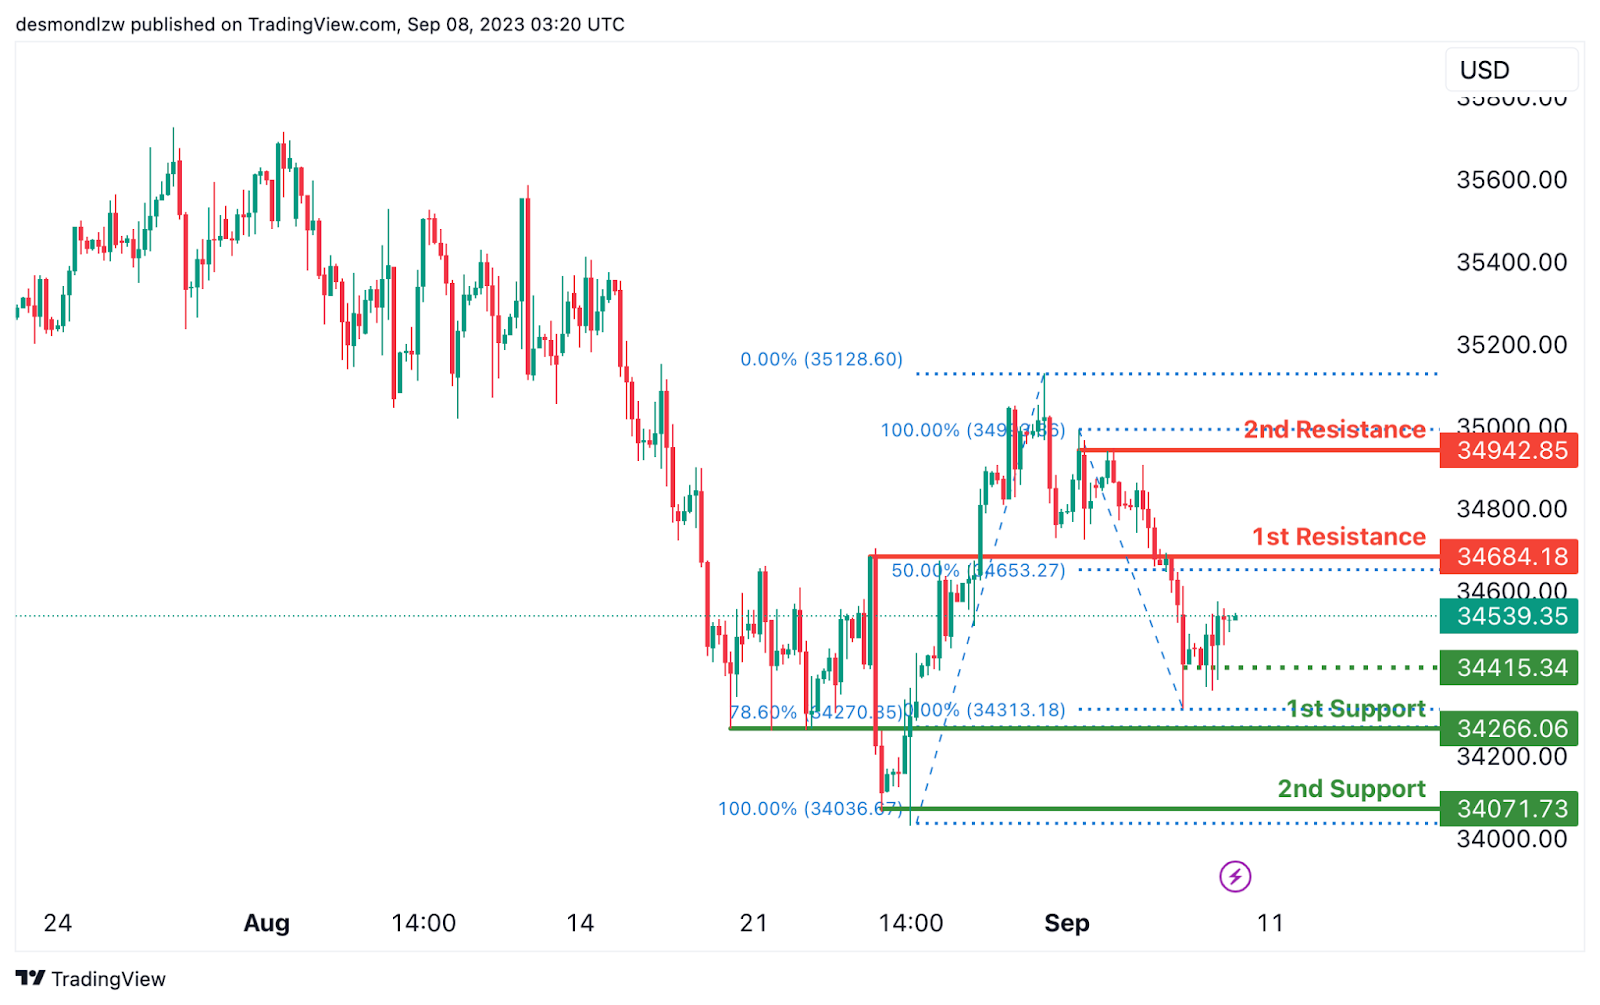
DJ30:
The instrument DJ30 (Dow Jones Industrial Average) currently exhibits a bullish overall momentum on the chart.In this context, there is a potential for price to continue its bullish movement towards the 1st resistance level.
The 1st support level at 34266.06 is considered strong because it represents pullback support and aligns with a 78.60% Fibonacci Retracement.
Additionally, there is a 2nd support level at 34071.73, which is significant as it represents swing low support.
On the resistance side, the 1st resistance level at 34684.18 is noteworthy as it serves as pullback resistance and aligns with a 50% Fibonacci retracement.
Furthermore, the 2nd resistance level at 34942.85 is considered significant as it represents multi-swing high resistance.
An intermediate support level at 34415.34 is also present, which serves as swing low support.
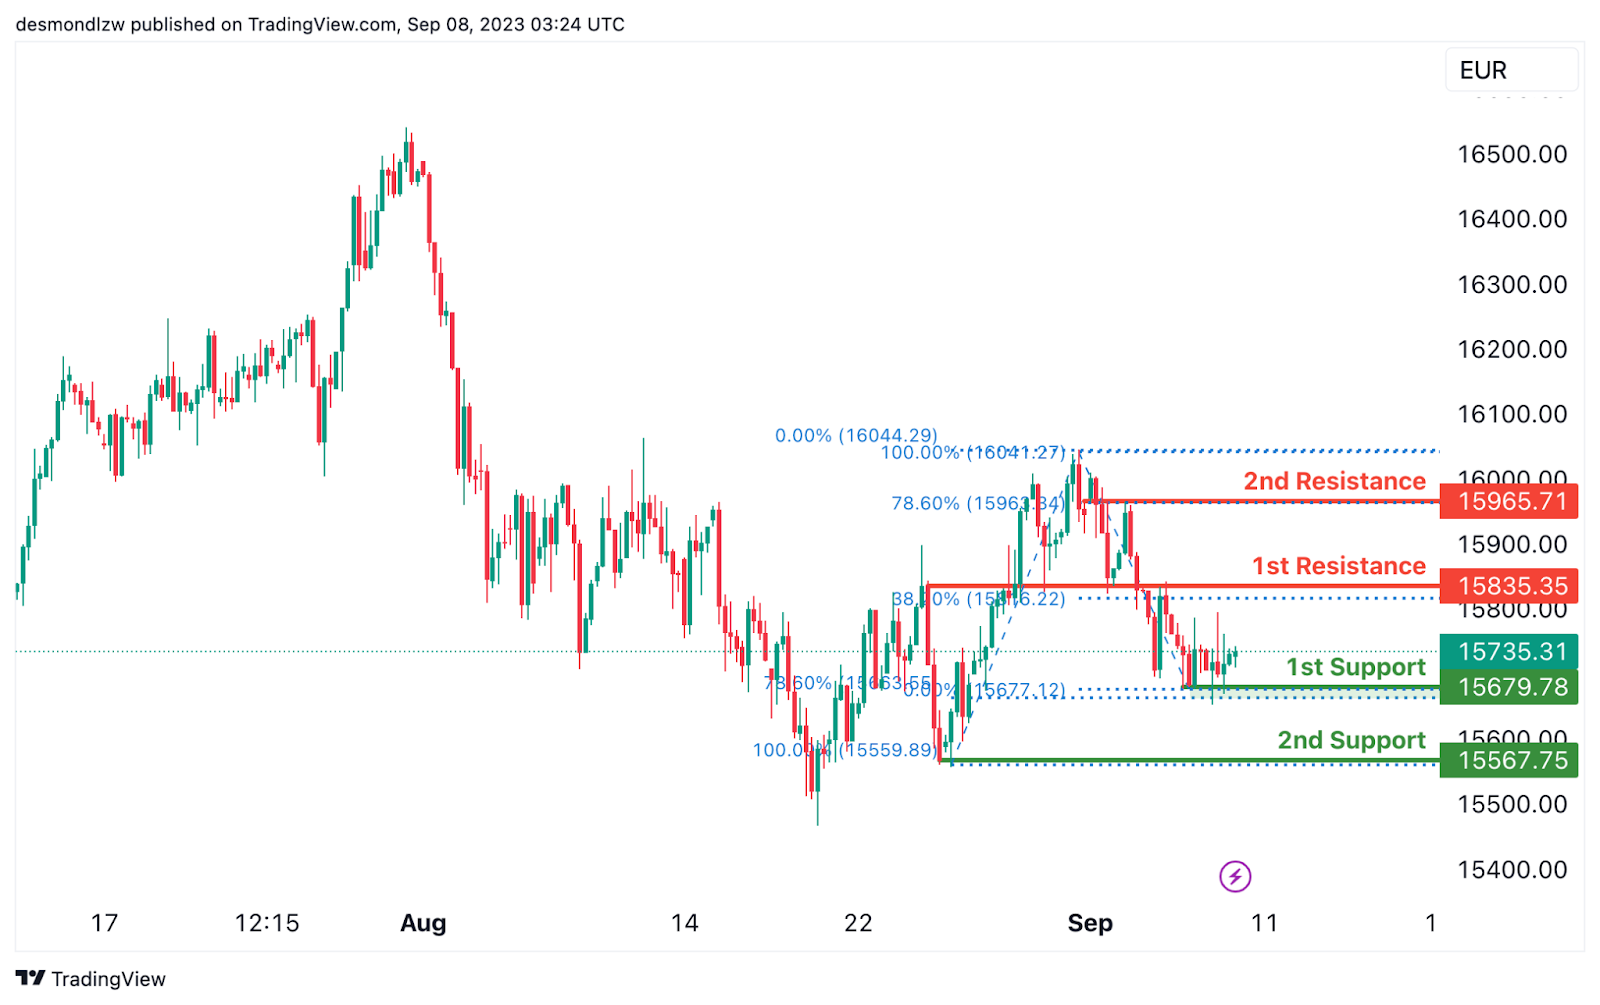
GER30:
The instrument GER30 currently shows a bullish overall momentum on the chart.
In this scenario, there is a potential for the price to continue its bullish movement towards the 1st resistance level.
The 1st support level at 15679.78 is considered strong because it represents swing low support and aligns with a 78.60% Fibonacci Retracement.
Additionally, there is a 2nd support level at 15567.75, which is significant as it represents swing low support.
On the resistance side, the 1st resistance level at 15835.35 is noteworthy because it serves as overlap resistance and aligns with a 38.20% Fibonacci Retracement.
Furthermore, the 2nd resistance level at 15965.71 is considered significant as it represents overlap resistance and aligns with a 78.60% Fibonacci Retracement.
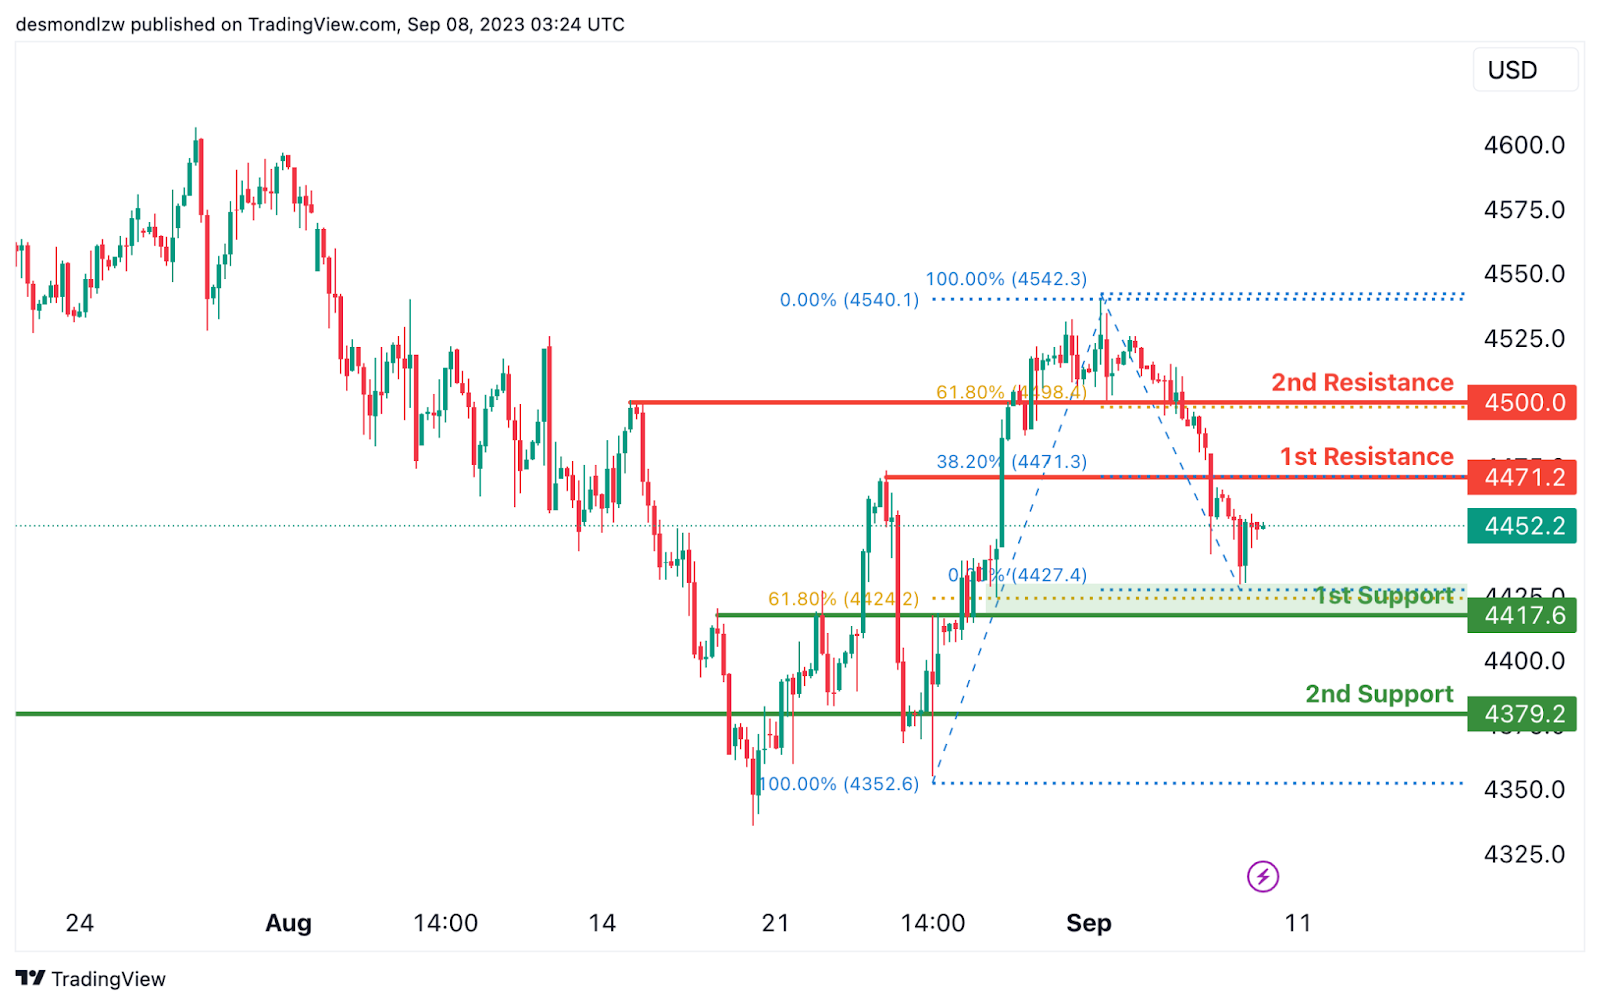
US500
The instrument US500 (S&P 500) currently exhibits a bullish overall momentum on the chart.
In this context, there is a potential for price to continue its bullish movement towards the 1st resistance level.
The 1st support level at 4417.6 is considered strong because it represents pullback support and aligns with a 61.80% Fibonacci Retracement.
Additionally, there is a 2nd support level at 4379.2, which is significant as it represents pullback support.
On the resistance side, the 1st resistance level at 4471.2 is noteworthy because it serves as pullback resistance and aligns with a 38.20% Fibonacci Retracement.
Furthermore, the 2nd resistance level at 4500.0 is considered significant as it represents pullback resistance and aligns with a 61.80% Fibonacci Retracement.
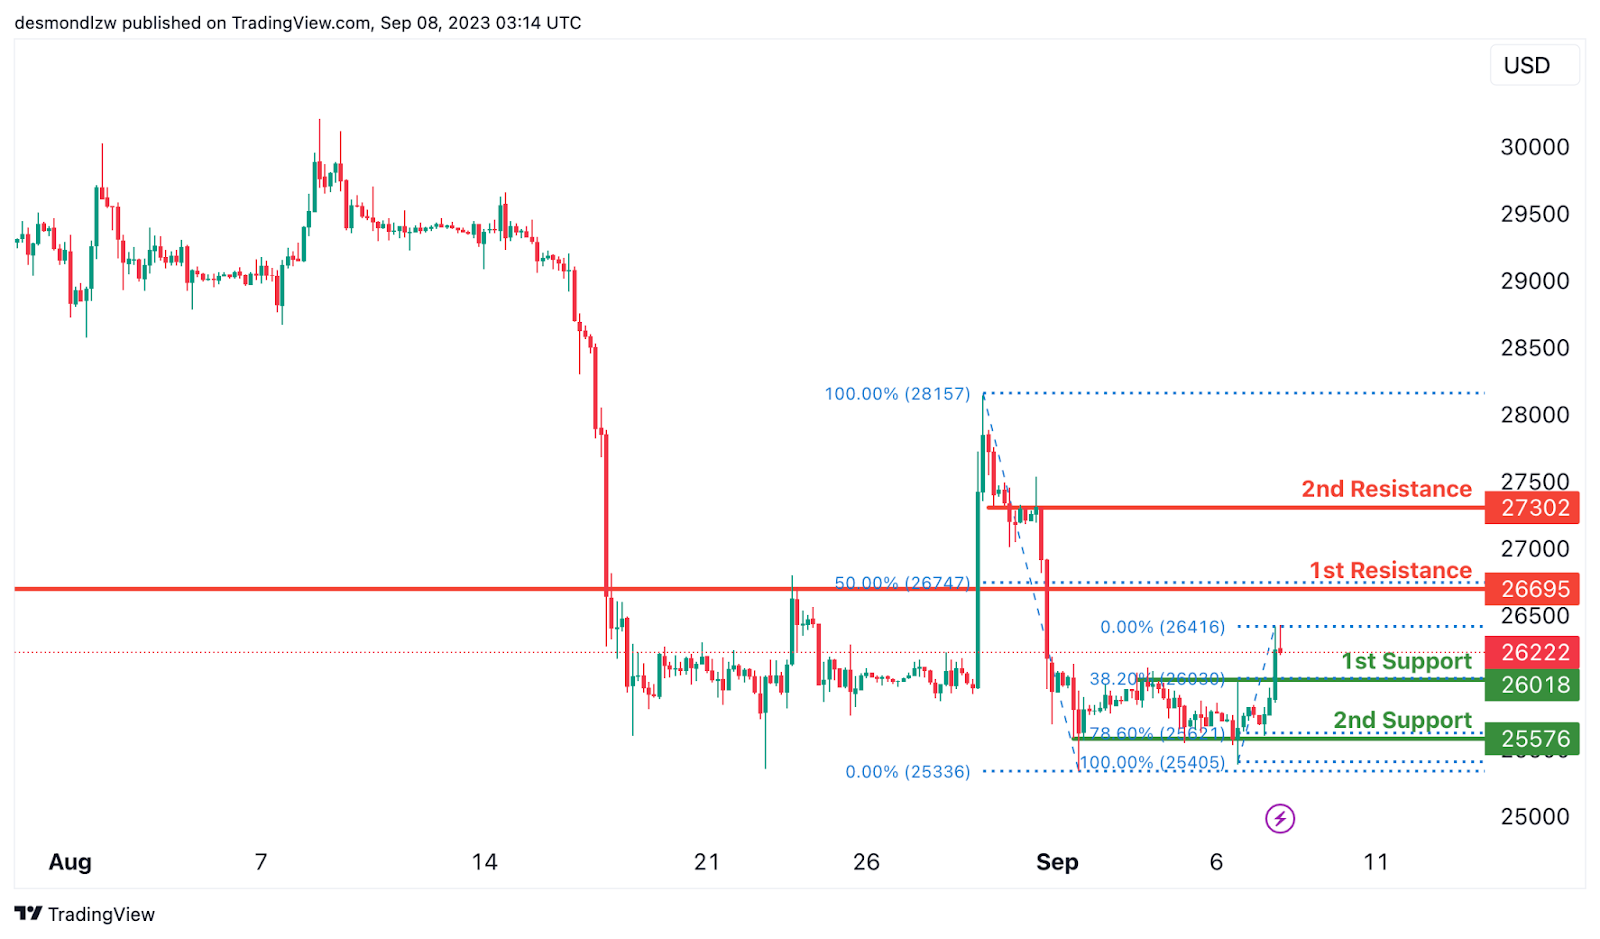
BTC/USD:
The instrument BTC/USD currently reflects a bullish overall momentum on the chart.
In this scenario, there is a potential for price to temporarily drop further in the short term towards the 1st support level at 26018 before bouncing from that level and potentially rising towards the 1st resistance at 26695.
The 1st support level at 26018 is considered strong because it represents pullback support and aligns with a 38.20% Fibonacci Retracement.
Additionally, there is a 2nd support level at 25576, which is significant as it represents multi-swing low support and aligns with a 78.60% Fibonacci Retracement.
On the resistance side, the 1st resistance level at 26695 is noteworthy because it serves as pullback resistance and aligns with a 50% Fibonacci Retracement.
Furthermore, the 2nd resistance level at 27302 is considered significant as it represents overlap resistance.
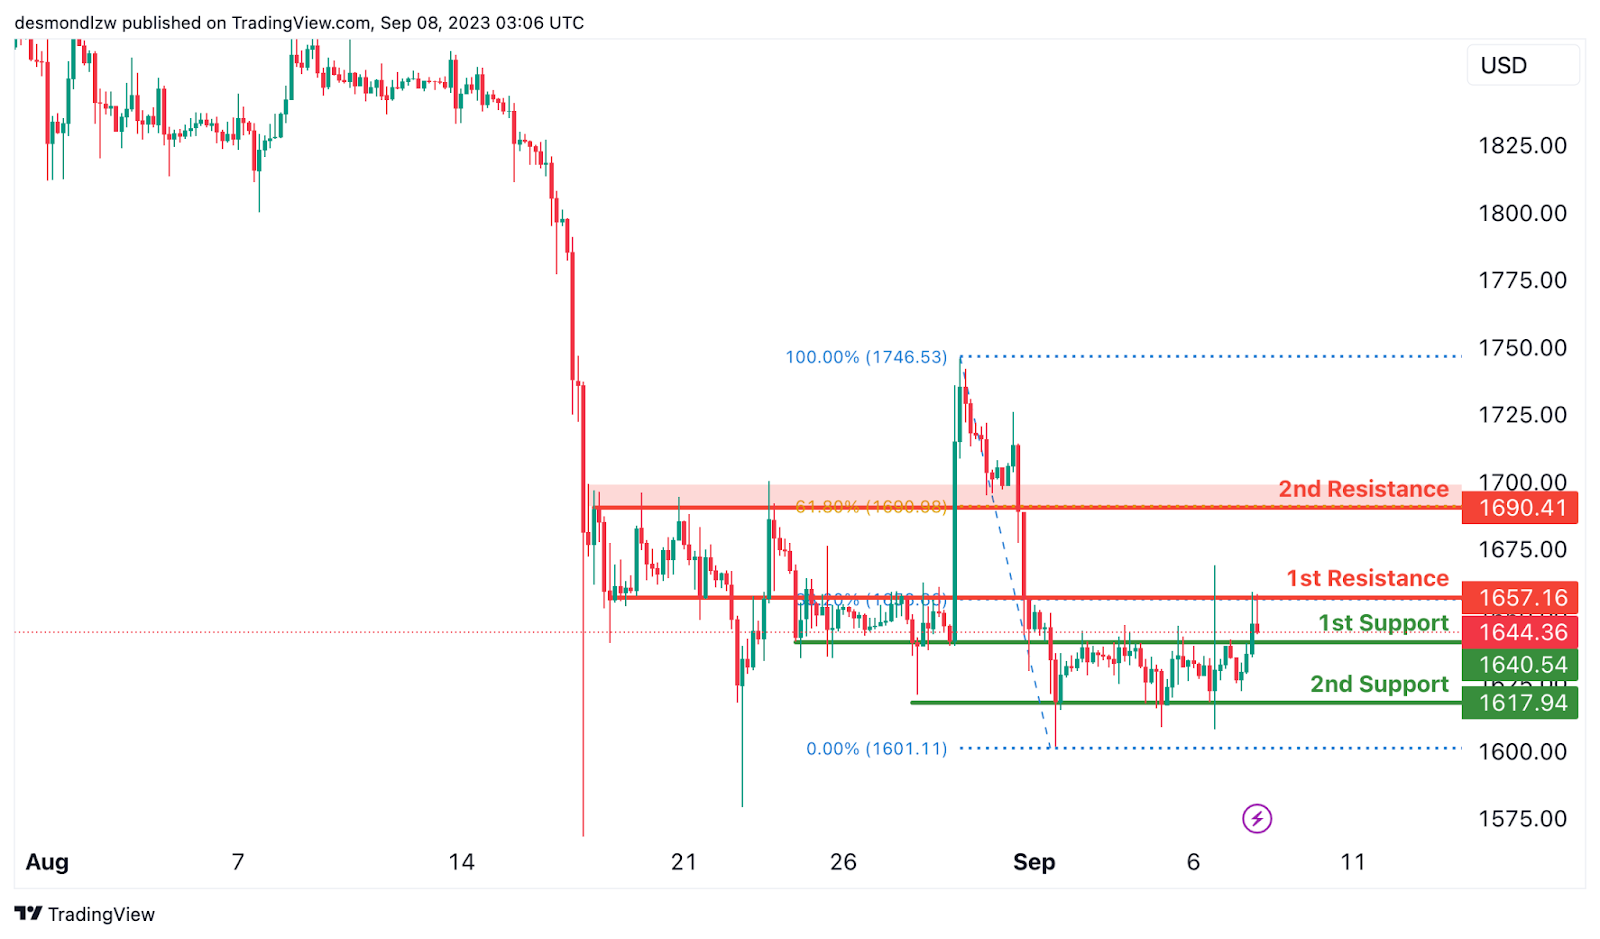
ETH/USD:
The instrument ETH/USD currently reflects a bullish overall momentum on the chart.
In this scenario, there is a potential for the price to experience a short-term drop towards the 1st support level at 1640.54 before bouncing from that level and potentially rising towards the 1st resistance at 1657.16.
The 1st support level at 1640.54 is considered strong because it represents overlap support.
Additionally, there is a 2nd support level at 1617.94, which is significant as it represents swing low support.
On the resistance side, the 1st resistance level at 1657.16 is noteworthy because it serves as overlap resistance and aligns with a 38.20% Fibonacci Retracement.
Furthermore, the 2nd resistance level at 1690.41 is considered significant as it represents pullback resistance and aligns with a 61.80% Fibonacci Retracement.
WTI/USD:
The WTI chart currently demonstrates a bearish overall momentum, indicating a potential downward trend in price movement.
There’s a likelihood of a bearish continuation towards the first support level at 84.05, which is identified as a pullback support.
Additionally, the second support at 81.64 is noted as an overlap support, suggesting that historical price action has found support in this area.
On the resistance side, the first resistance at 87.15 is marked as an overlap resistance and aligns with the 161.80% Fibonacci Projection, as well as the 61.80% Fibonacci Projection. This confluence of Fibonacci levels adds to its significance as a potential resistance zone.
Furthermore, the second resistance level at 89.26 is considered significant as it represents an overlap resistance, potentially acting as a barrier to any bullish movements in the WTI price.
a href=”https://www.actionforex.com/wp-content/uploads/2023/09/icmarkets2023090726.png”>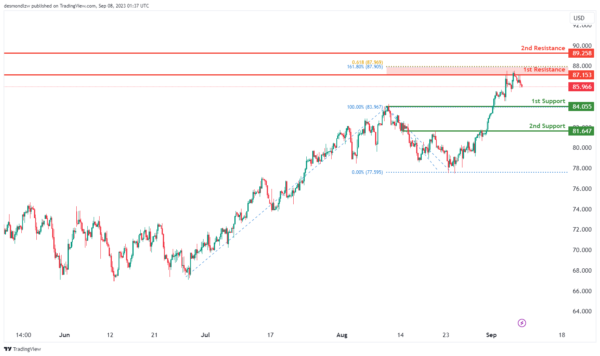
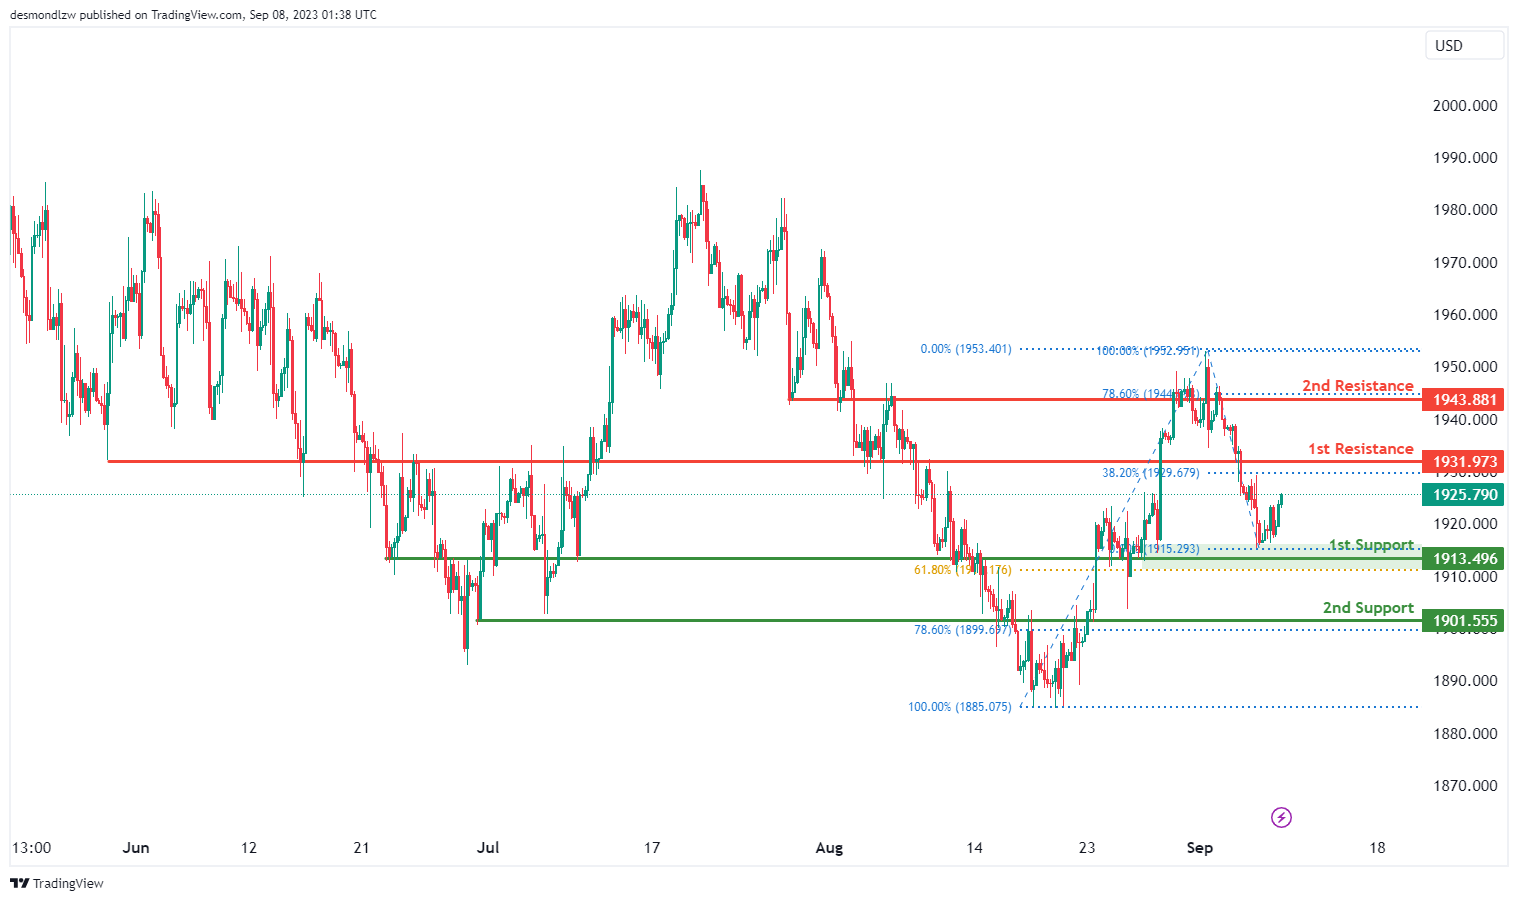
XAU/USD (GOLD):
The XAU/USD chart currently displays a bullish overall momentum, suggesting a potential upward trend in price movement. There’s a likelihood of a bullish continuation towards the first resistance.
The first support at 1913.49 is considered strong as it represents an overlap support and aligns with the 61.80% Fibonacci Retracement level, reinforcing its significance as a potential area of price support. Similarly, the second support at 1901.55 is also noted as an overlap support, aligning with the 78.60% Fibonacci Retracement, further enhancing its importance as a potential support zone.
On the resistance side, the first resistance at 1931.97 is marked as a pullback resistance and aligns with the 38.20% Fibonacci Retracement, making it noteworthy. The second resistance at 1943.88 is identified as an overlap resistance and aligns with the 78.60% Fibonacci Retracement, further enhancing its potential as a resistance level.


