
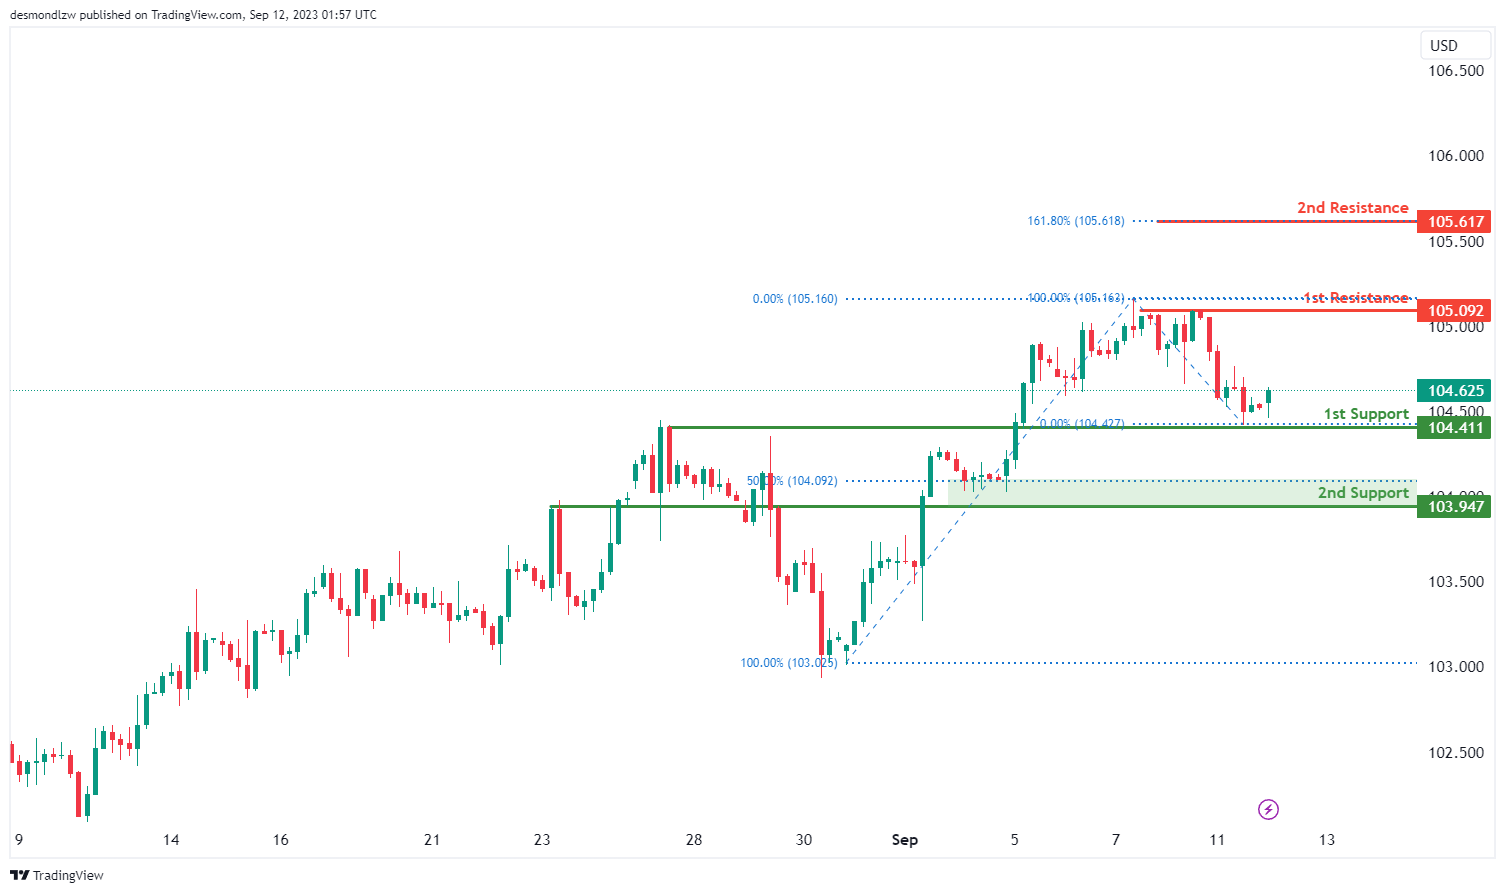
DXY:
The current analysis of the DXY (US Dollar Index) chart indicates a prevailing bullish momentum. There is a prospect of a bullish rebound anticipated at the 1st support level at 104.41, which is characterized as an overlap support. Furthermore, the 2nd support level at 103.94 corresponds to an overlap support and conveniently aligns with the 50% Fibonacci Retracement level.
Conversely, on the resistance front, the 1st resistance at 105.09 signifies multi-swing high resistance, while the 2nd resistance at 105.61 is associated with the 161.80% Fibonacci Retracement. These levels are of particular interest as they are indicative of potential inflection points in the price movement.
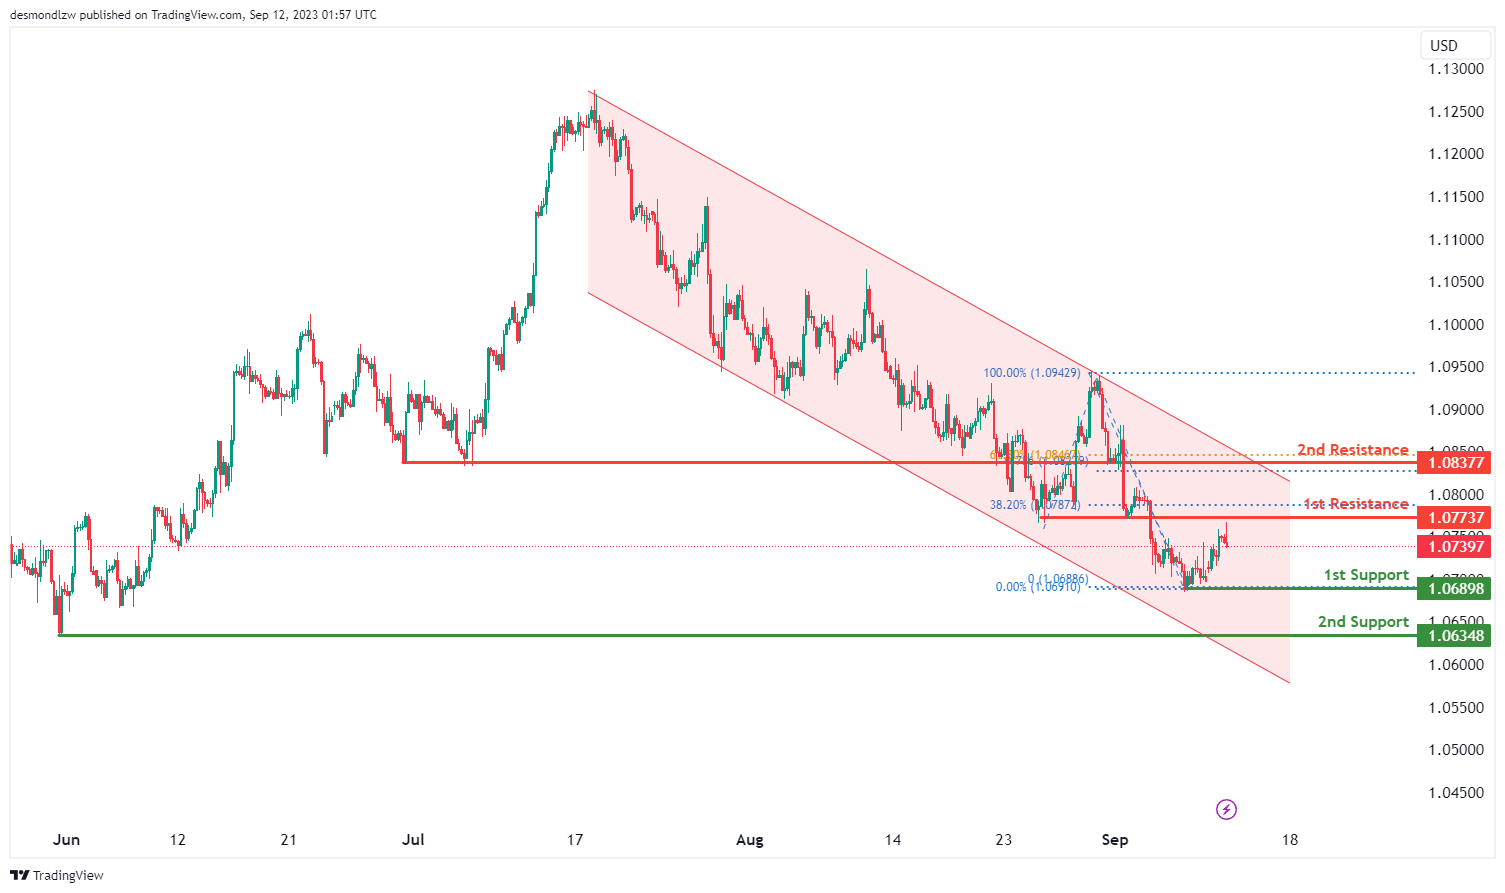
EUR/USD:
The EUR/USD chart currently demonstrates a bearish overall momentum, primarily attributed to its confinement within a bearish descending channel.
There’s a possibility of a bearish continuation in the near term, potentially leading the price to the 1st support level at 1.0689. This support level holds significance as it aligns with a swing low support. Additionally, the 2nd support at 1.0634, also corresponding to a swing low support, reinforces its potential role as a support zone.
On the resistance side, the 1st resistance at 1.0773 is noteworthy as it serves as overlap resistance and aligns with the 38.20% Fibonacci Retracement level. Furthermore, the 2nd resistance level at 1.0837 is significant as it represents overlap resistance and aligns with the 61.80% Fibonacci Retracement.
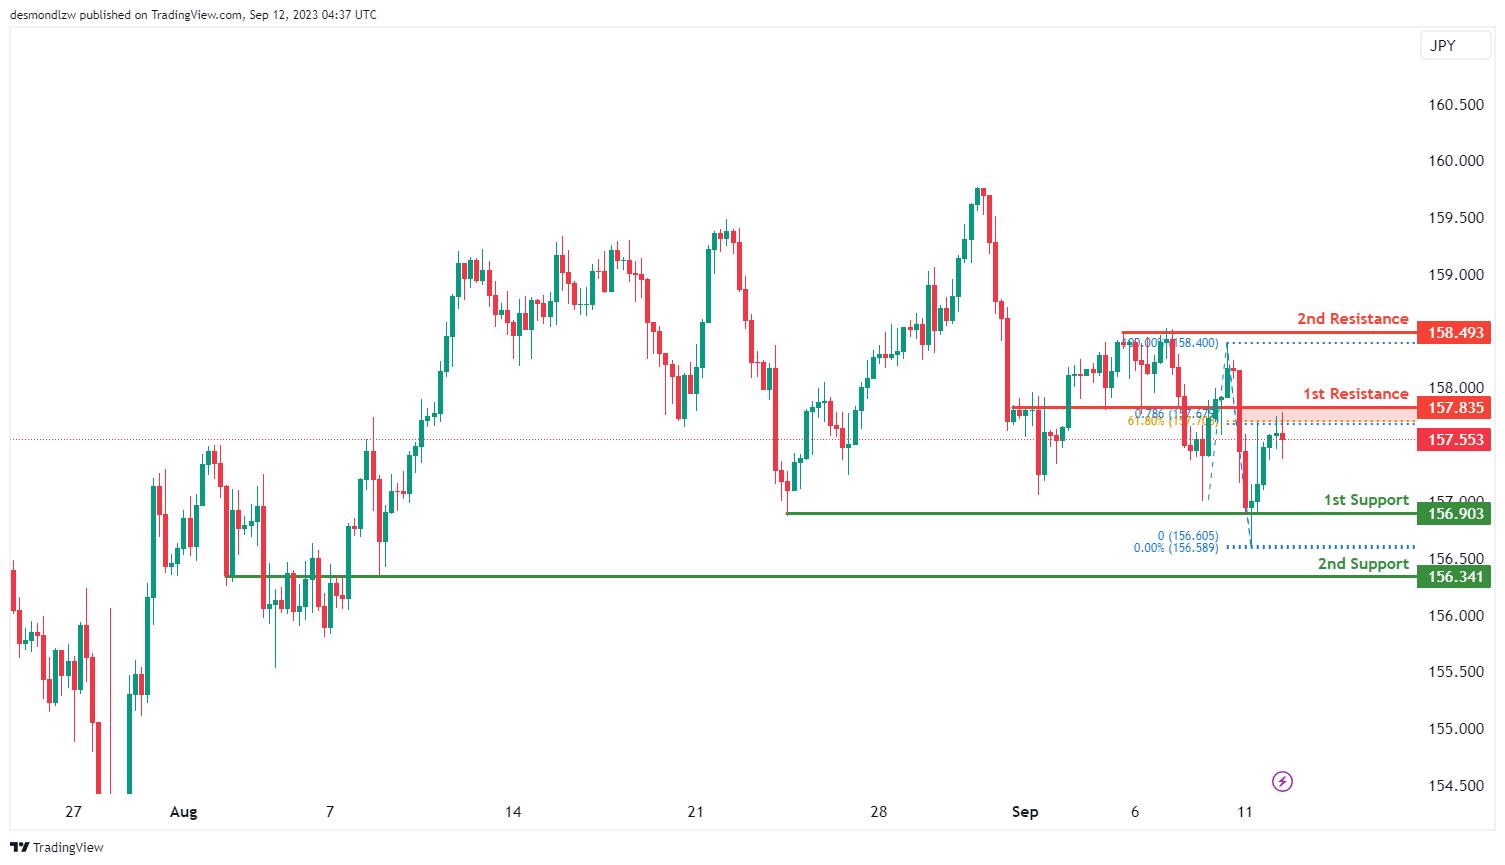
EUR/JPY:
For EUR/JPY, the overall momentum of the chart is currently bearish, indicating a downward trend.
There is potential for the price to continue its bearish movement towards the 1st support level at 156.90. This 1st support level is considered significant because it represents multi-swing low support, suggesting potential stability at this level.
In case of a further decline, the 2nd support level at 156.34 is also noteworthy as it acts as an overlap support, potentially providing additional reinforcement for the price.
On the upper side, if there’s a reversal in the price, it may face resistance at the 1st resistance level of 157.83. This 1st resistance is considered important due to its characteristics as a swing high resistance, supported by both the 78.60% Fibonacci Projection and the 61.80% Fibonacci Retracement, indicating a Fibonacci confluence and potential resistance to upward movement.
Further upward movement may encounter resistance at the 2nd resistance level of 158.49, characterized as multi-swing high resistance, which could pose a significant barrier to the bullish momentum.
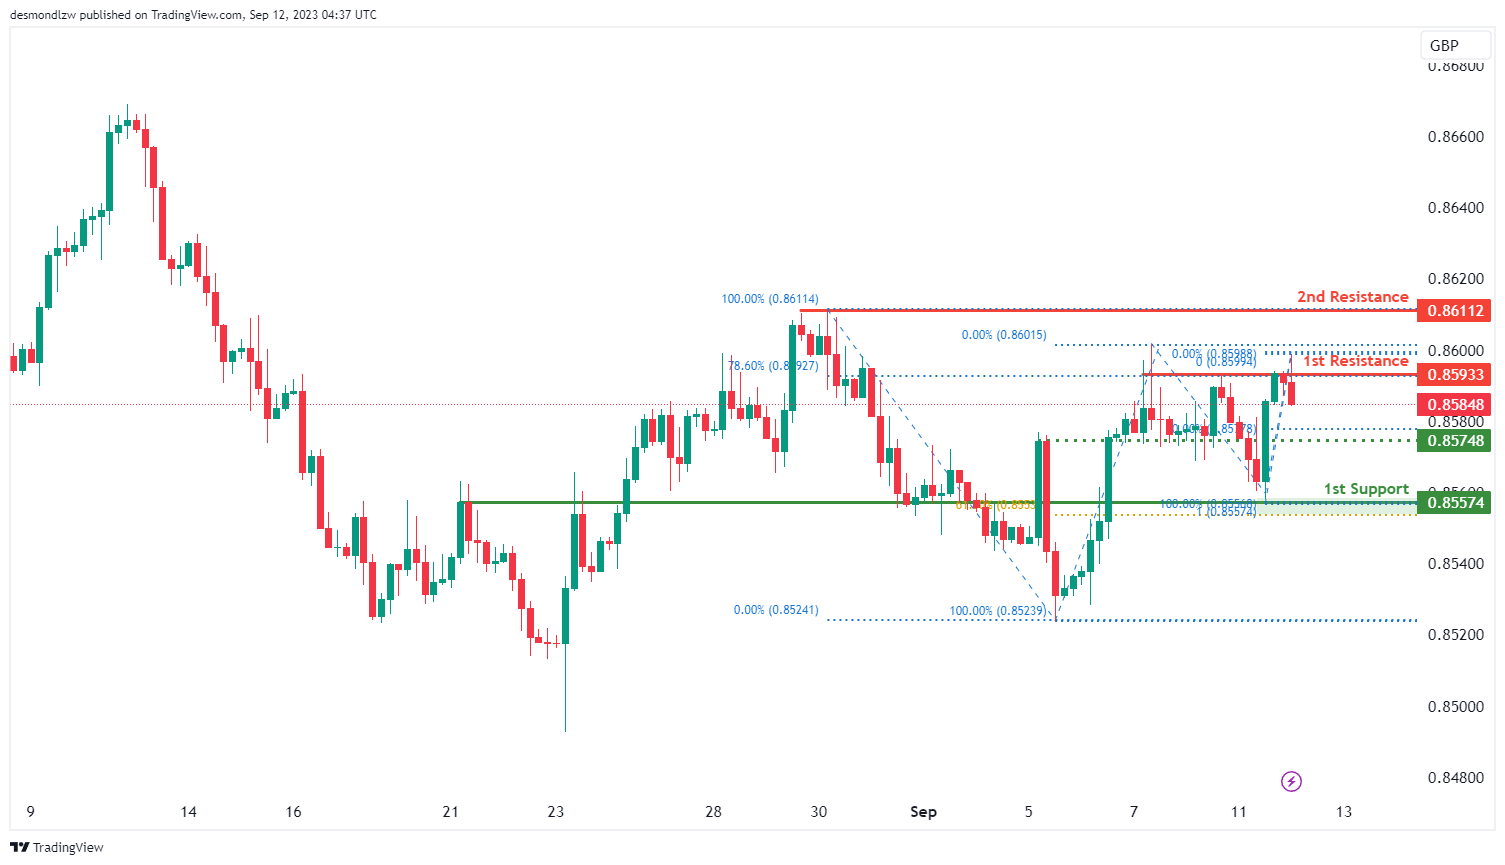
EUR/GBP:
For EUR/GBP, the overall momentum of the chart is currently bearish, indicating a downward trend.
There is potential for the price to continue its bearish movement towards the 1st support level at 0.8557. This 1st support level is considered significant because it represents an overlap support and aligns with both the 100% Fibonacci Projection and the 61.80% Fibonacci Retracement, indicating strong potential support due to Fibonacci confluence.
On the upper side, if there’s a reversal in the price, it may face resistance at the 1st resistance level of 0.8593. This 1st resistance is considered important because it represents multi-swing high resistance and is supported by the 78.60% Fibonacci Retracement.
Further upward movement could encounter resistance at the 2nd resistance level of 0.8611, characterized as swing high resistance, which may act as a barrier to the bullish momentum within the observed range.
Additionally, there is an intermediate support level at 0.8574, identified as pullback support and aligning with the 50% Fibonacci Retracement. This level may temporarily slow down the bearish momentum within the observed range.
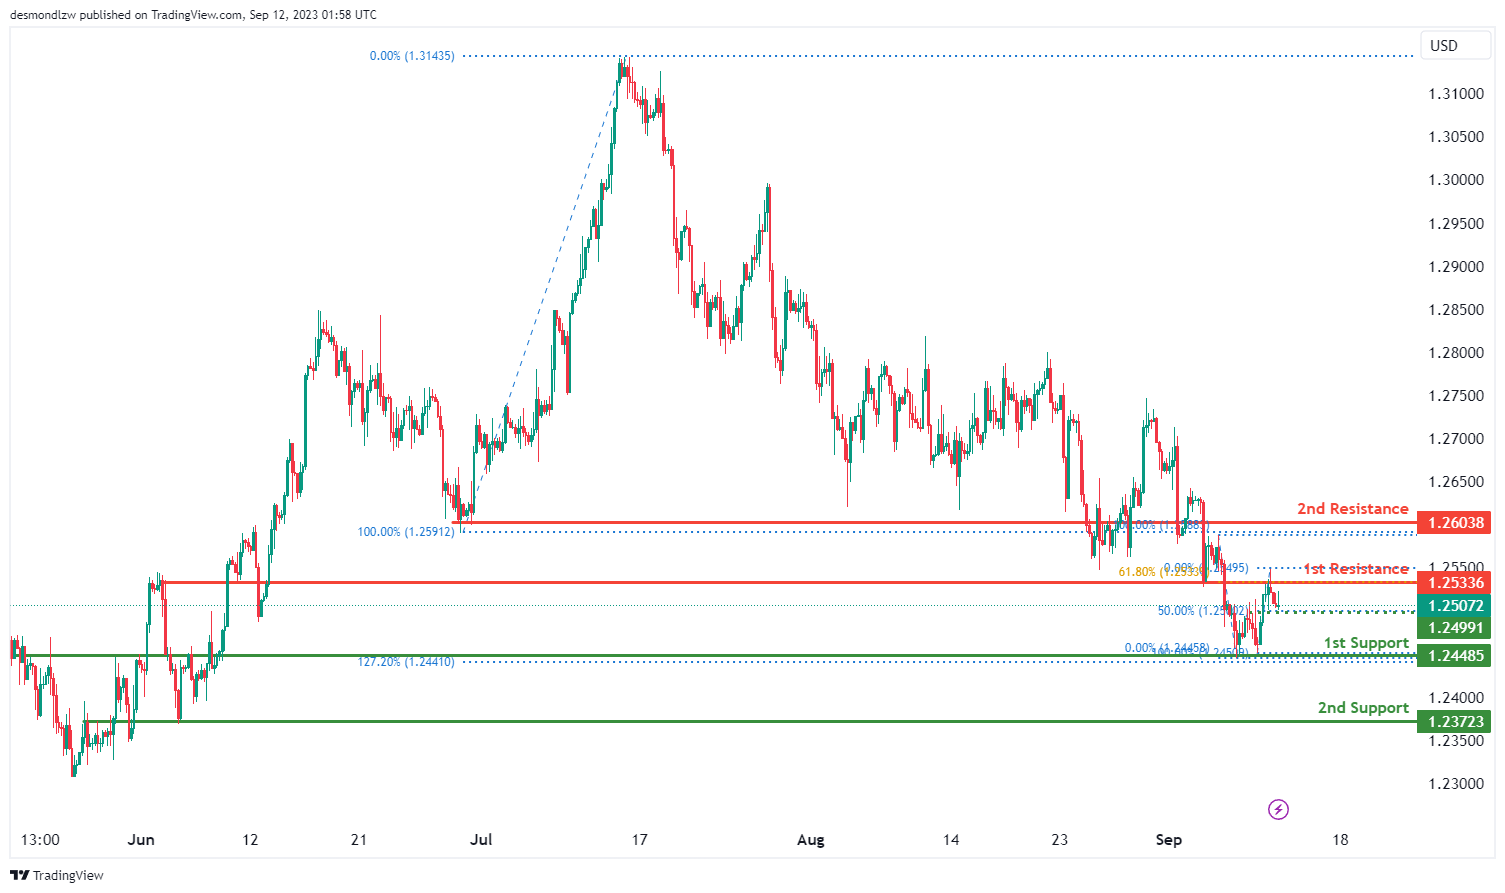
GBP/USD:
The GBP/USD chart currently indicates a bearish overall momentum, suggesting a potential continuation of the bearish trend.
There’s a likelihood of a bearish continuation in the near term, potentially taking the price towards the 1st support level at 1.2448. This support level is significant as it aligns with an overlap support and the 127.20% Fibonacci Expansion.
Additionally, there’s another 1st support at 1.2372, marked as an overlap support, further reinforcing its potential as a support zone.
On the resistance side, the 1st resistance at 1.2533 is identified as an overlap resistance and aligns with the 61.80% Fibonacci Retracement level.
Furthermore, the 2nd resistance level at 1.2603 is marked as an overlap resistance. These resistance levels may act as barriers to any bullish movements.
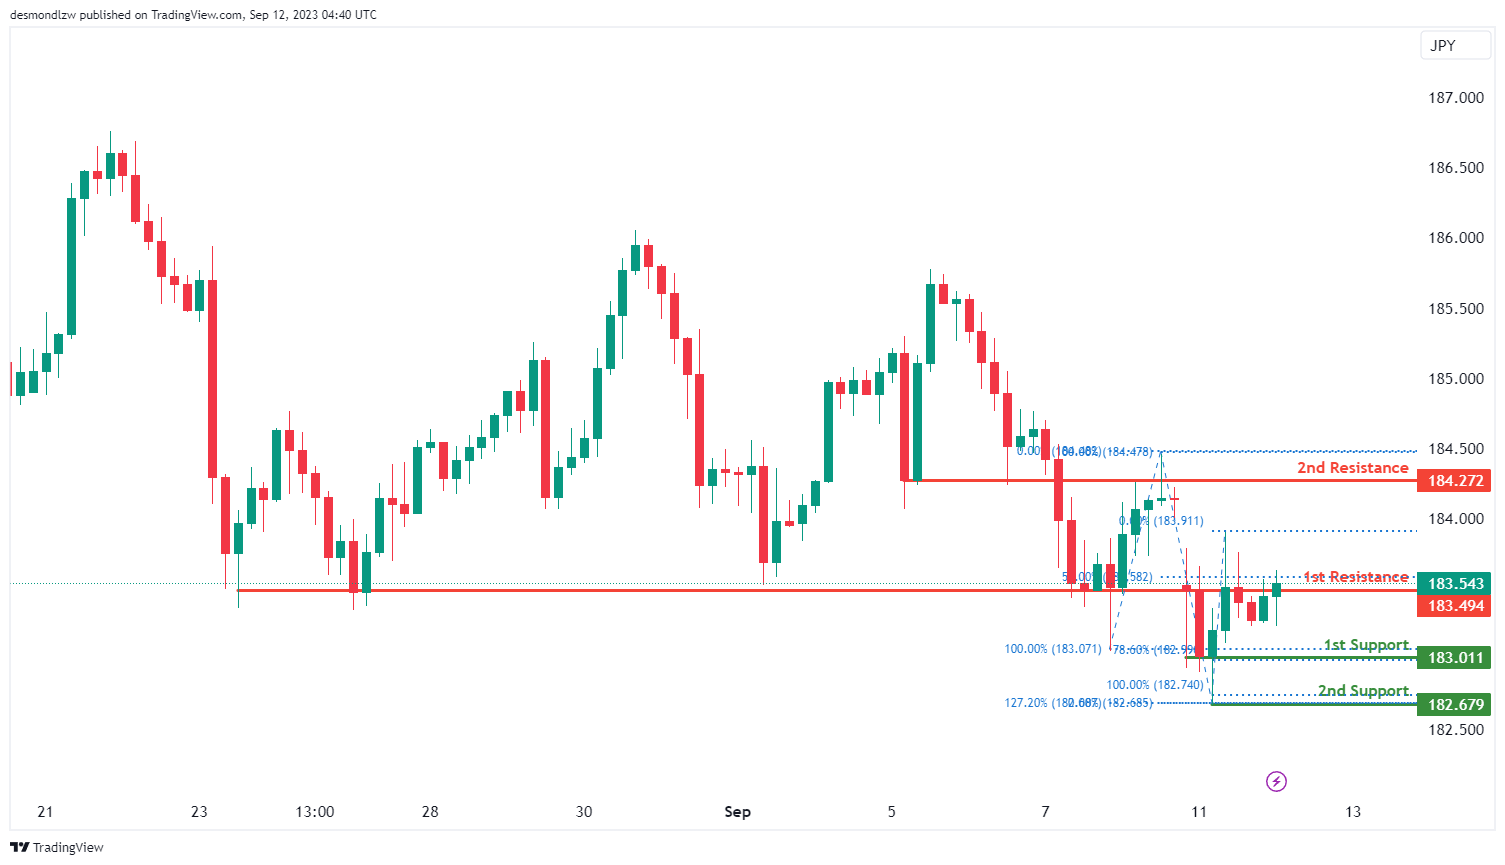
GBP/JPY:
For GBP/JPY, the overall momentum of the chart is currently bearish, indicating a downward trend.
There is potential for the price to have a bearish reaction off the 1st resistance level at 183.49 and drop to the 1st support at 183.01.
The 1st support at 183.01 is considered significant because it represents a swing low support and aligns with the 78.60% Fibonacci Retracement level, indicating potential stability and support at this level.
In case of a more substantial decline, the 2nd support level at 182.67 is also noteworthy as it represents a swing low support and aligns with the 127.20% Fibonacci Extension, potentially providing additional support for the price.
On the upper side, the 1st resistance at 183.49 is considered important due to its characteristics as an overlap resistance and its alignment with the 50% Fibonacci Retracement level.
Further upward movement may encounter resistance at the 2nd resistance level of 184.27, characterized as an overlap resistance, which could pose a barrier to the bullish momentum within the observed range.
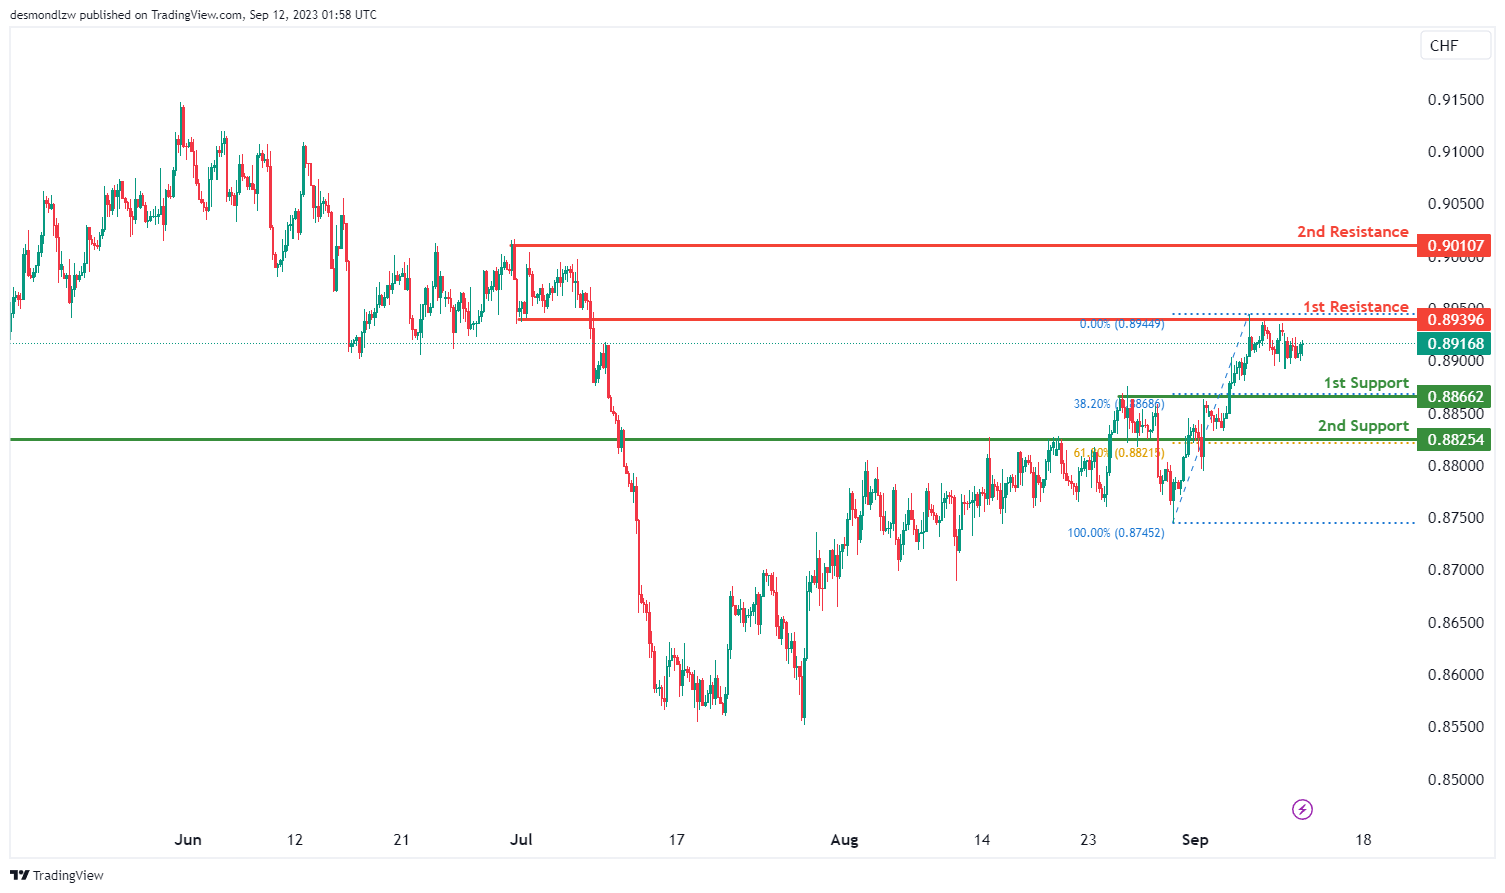
USD/CHF:
The USD/CHF chart currently reflects a neutral overall momentum, suggesting a lack of a clear directional trend.
Price is expected to potentially oscillate within a range defined by the 1st support at 0.8866 and the 1st resistance at 0.8939.
The 1st support level at 0.8866 is considered a suitable level for potential price rebounds, characterized as a pullback support. Similarly, the 2nd support at 0.8825 serves as another pullback support.
Conversely, the 1st resistance at 0.8939 is identified as an overlap resistance, while the 2nd resistance at 0.9010 represents a swing high resistance. These levels may act as barriers to any significant bullish movements.
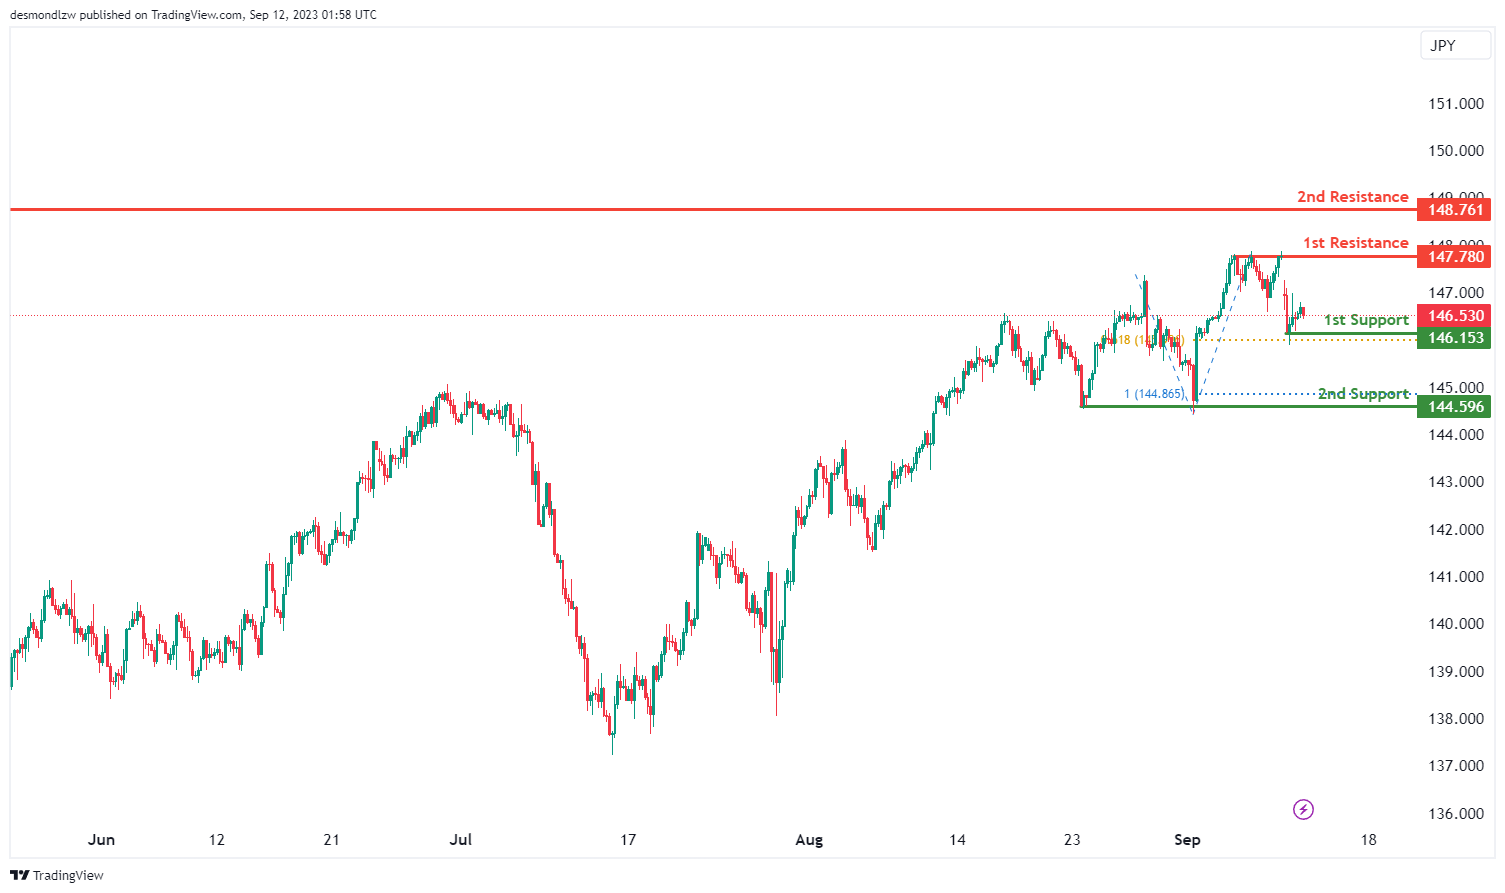
USD/JPY:
The USD/JPY chart currently indicates a bearish overall momentum, suggesting a potential downward trend in price movement.
In the short term, there’s a possibility of a price rise towards the 1st resistance level at 147.78 before potentially reversing and moving lower towards the 1st support.
The 1st support level at 146.15 is identified as a significant level for potential price rebounds, characterized as a swing low support and aligning with the 61.80% Fibonacci Projection.
Additionally, the 2nd support at 144.59 is considered another critical support level, marked as a multi-swing low support and aligning with the 100% Fibonacci Projection.
On the resistance side, the 1st resistance at 147.78 represents a multi-swing high resistance, while the 2nd resistance at 148.76 is characterized as a swing high resistance. These levels may act as barriers to any substantial bullish movements.
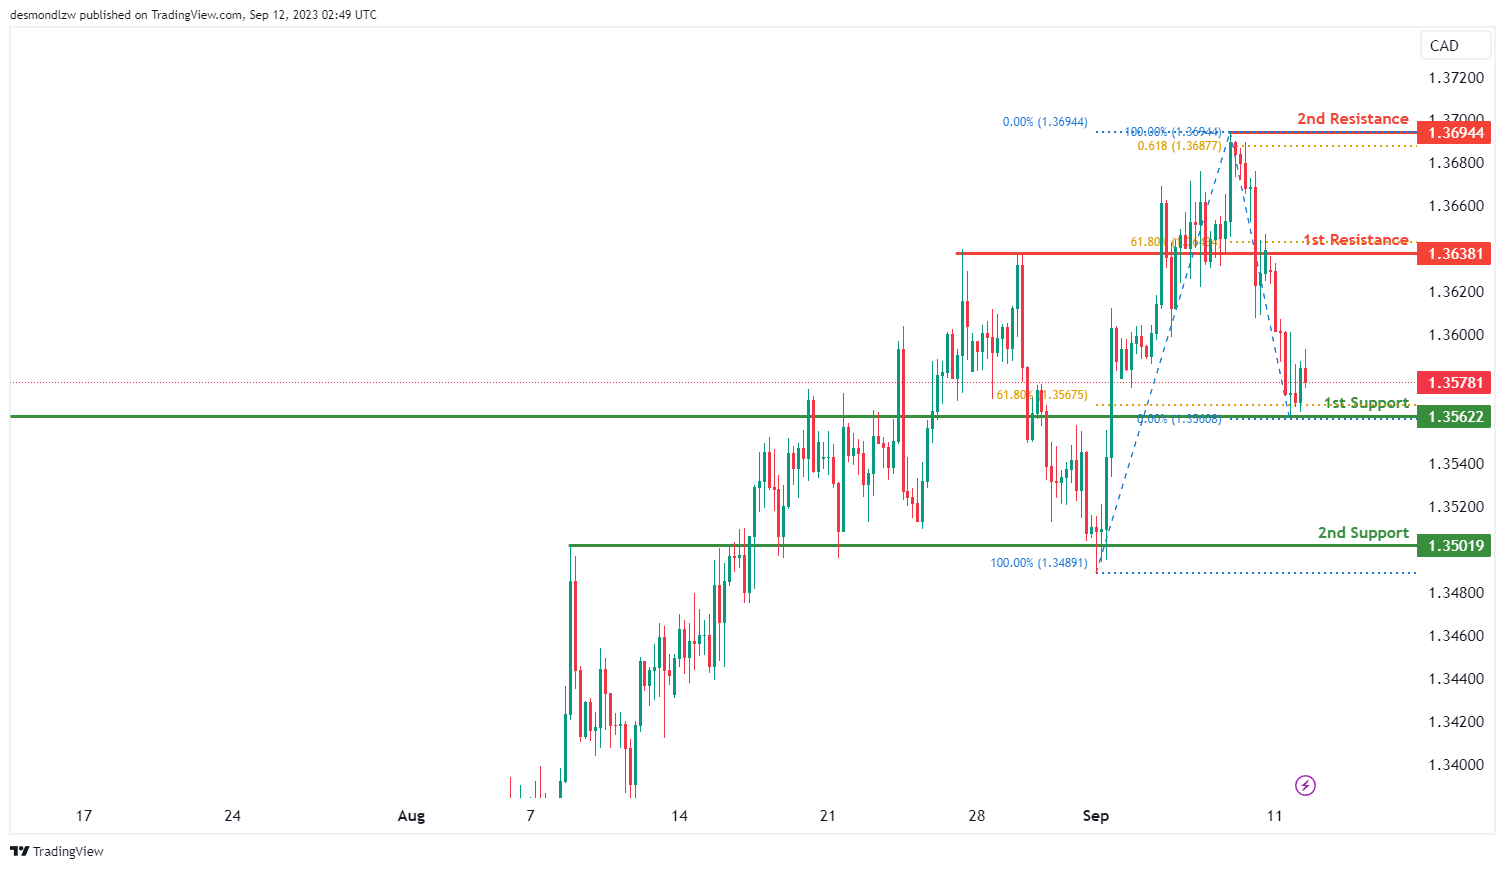
USD/CAD:
The USD/CAD chart currently displays an overall bearish momentum, indicating a potential continuation of the bearish trend towards the 1st support level.
The 1st support level at 1.3562 is identified as an overlap support that aligns with the 61.80% Fibonacci retracement level. Additionally, the 2nd support level at 1.3502 is also marked as an overlap support, reinforcing its potential as a support zone.
To the upside, the 1st resistance level at 1.3638 is identified as an overlap resistance that aligns with the 61.80% Fibonacci retracement level. Furthermore, the 2nd resistance level at 1.3694 is identified as a swing-high resistance that aligns with the 61.80% Fibonacci projection level.
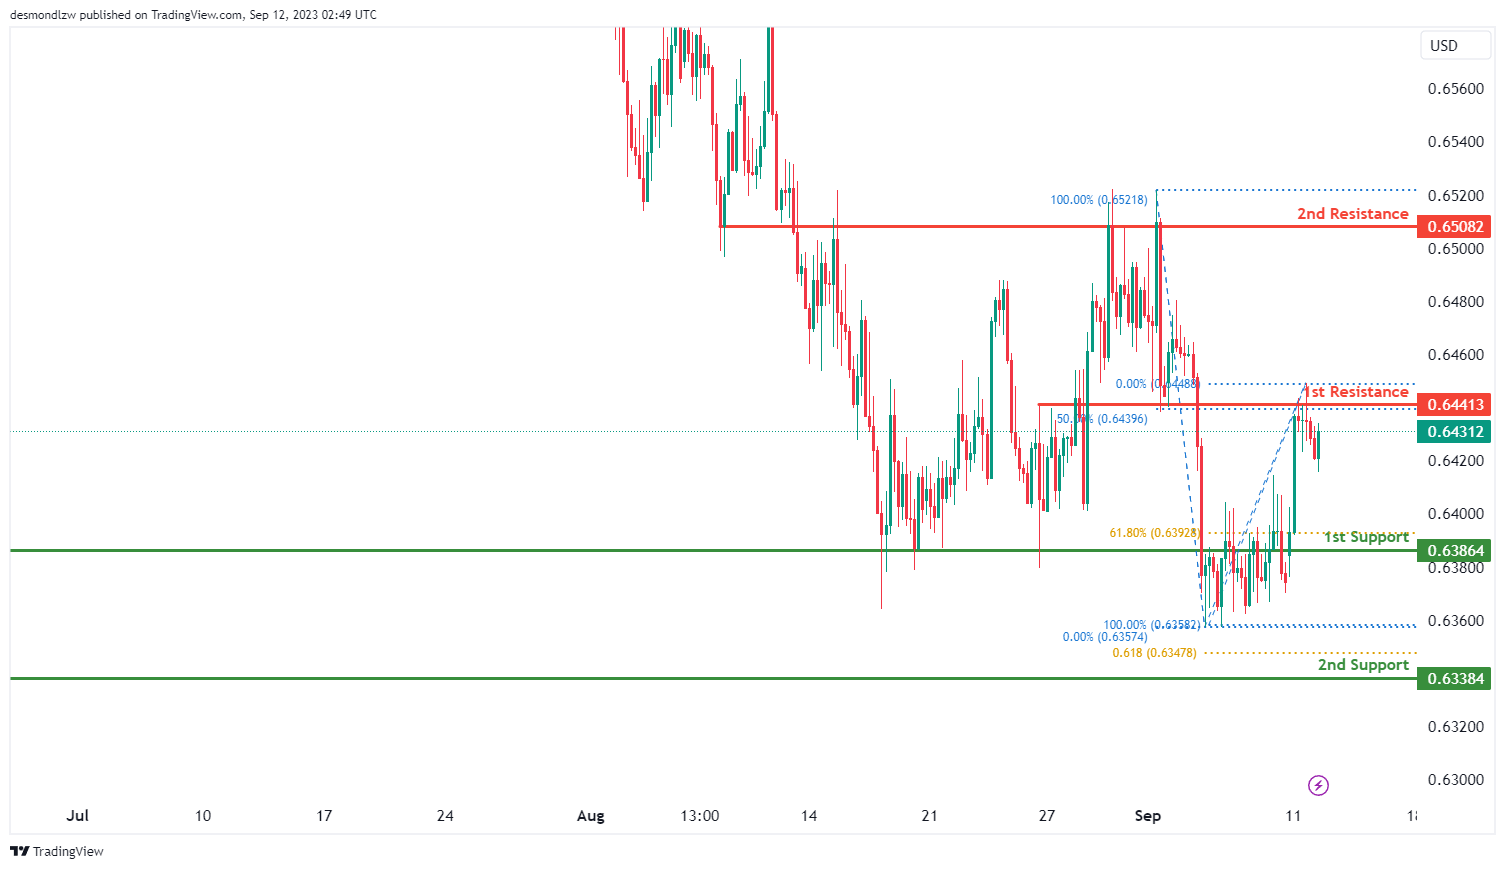
AUD/USD:
The AUD/USD chart currently exhibits an overall bullish momentum, suggesting a potential upward trend in price movement. There is a possibility of a bullish continuation towards the 1st resistance level.
The 1st resistance level at 0.6441 is identified as an overlap resistance that aligns with the 50.00% Fibonacci retracement level. Furthermore, the 2nd resistance level at 0.6508 is marked as an overlap resistance, indicating its significance as a potential barrier to further bullish movements.
To the downside, the 1st support level at 0.6386 is identified as an overlap support that aligns with the 61.80% Fibonacci retracement level. Additionally, the 2nd support level at 0.6338 is marked as a pullback support that aligns with the 61.80% Fibonacci projection level, reinforcing its potential role as a support level.
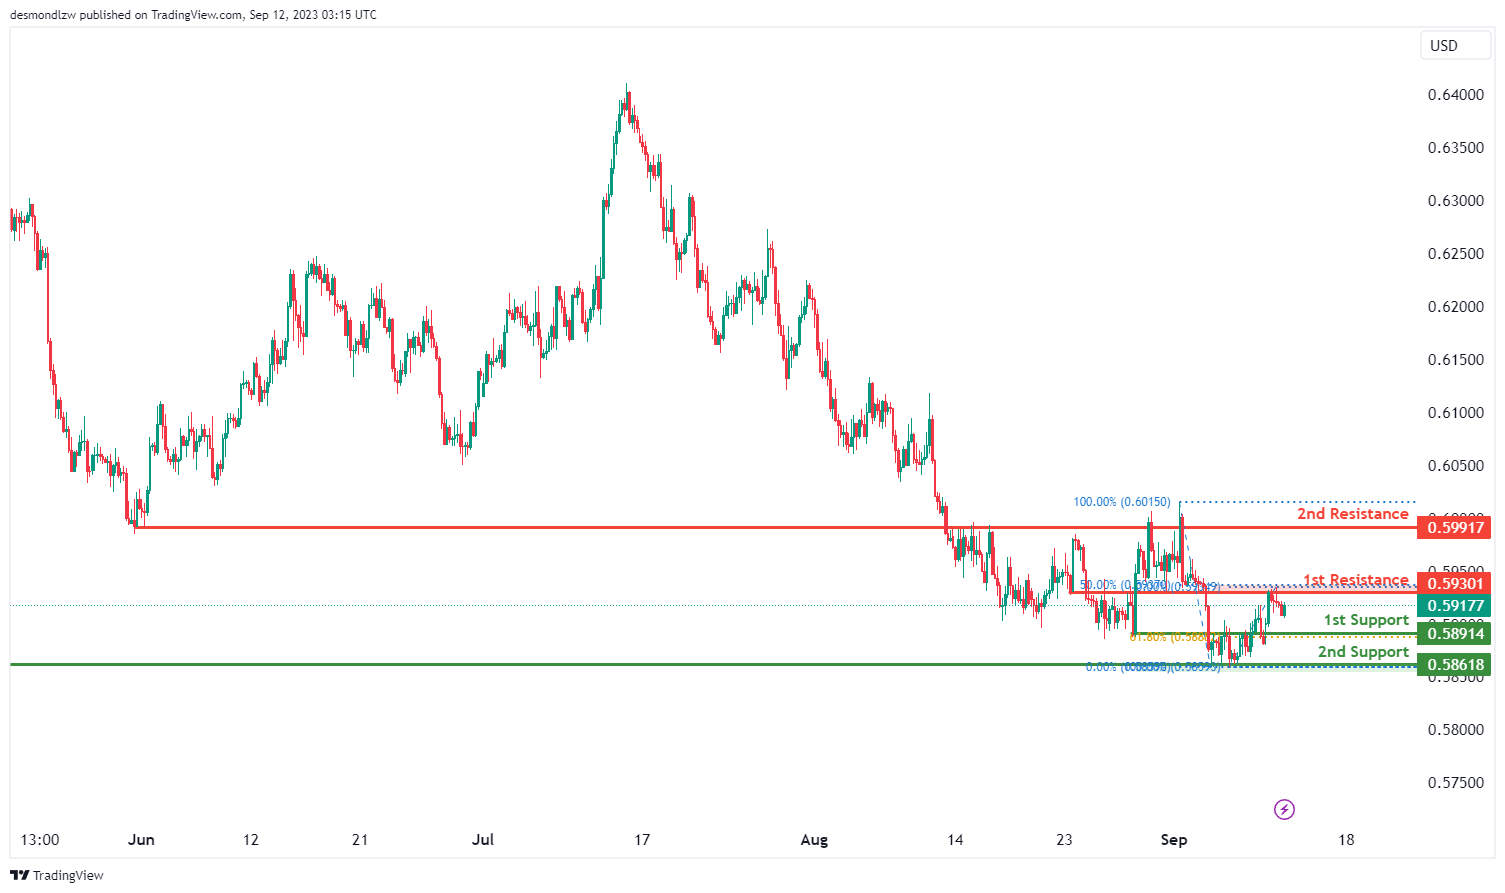
NZD/USD
The NZD/USD chart currently indicates an overall bullish momentum, suggesting a potential upward trend in price movement. There is a possibility of a bullish continuation towards the 1st resistance level.
The 1st resistance level at 0.5930 is identified as an overlap resistance that aligns with the 50.00% Fibonacci retracement level. Furthermore, the 2nd resistance level at 0.5992 is marked as an overlap resistance, reinforcing its potential role as a barrier to further bullish movements.
To the downside, the 1st support level at 0.5891 is identified as an overlap support that aligns with the 61.80% Fibonacci retracement level. Additionally, the 2nd support level at 0.5862 is marked as a pullback support, reinforcing its potential role as a support level.
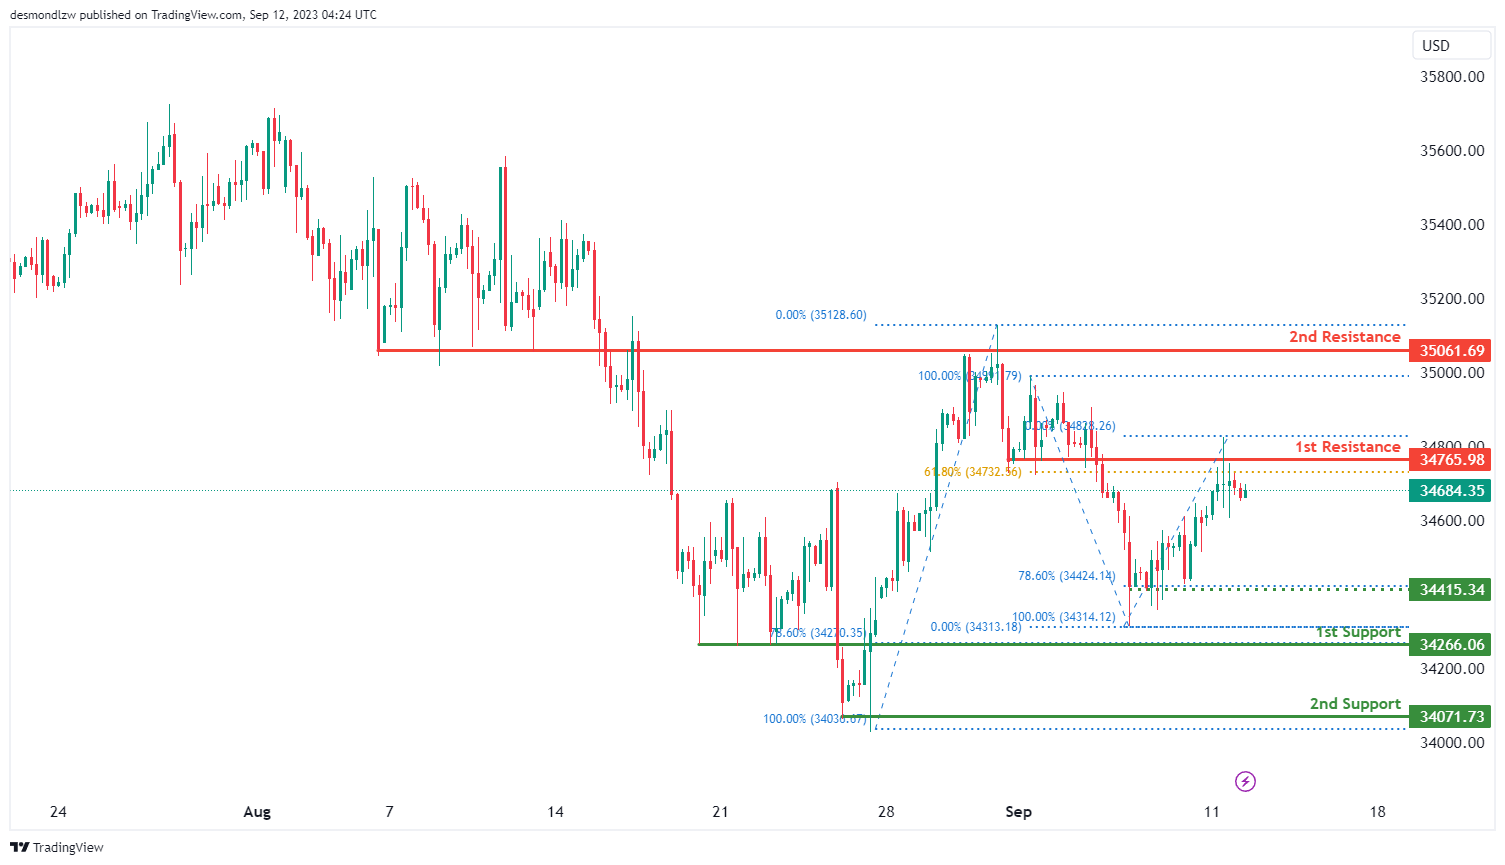
DJ30:
For DJ30, the overall momentum of the chart is currently bearish, indicating a downward trend.
There is potential for the price to continue its bearish movement towards the 1st support level at 34266.06.
The 1st support at 34266.06 is considered significant because it represents a pullback support and aligns with the 78.60% Fibonacci Retracement level, suggesting potential stability and support at this level.
In case of a more significant decline, the 2nd support level at 34071.73 is also noteworthy as it represents a swing low support, offering additional reinforcement for the price.
On the upper side, the 1st resistance at 34765.98 is considered important because it represents an overlap resistance, supported by the 61.80% Fibonacci Retracement level. This level may act as a barrier to upward movement.
Further upward movement could face resistance at the 2nd resistance level of 35061.69, characterized as an overlap resistance, which could pose a significant challenge to the bullish momentum.
Additionally, there is an intermediate support level at 34415.34, identified as multi-swing low support, which may temporarily slow down the bearish momentum within the observed range.
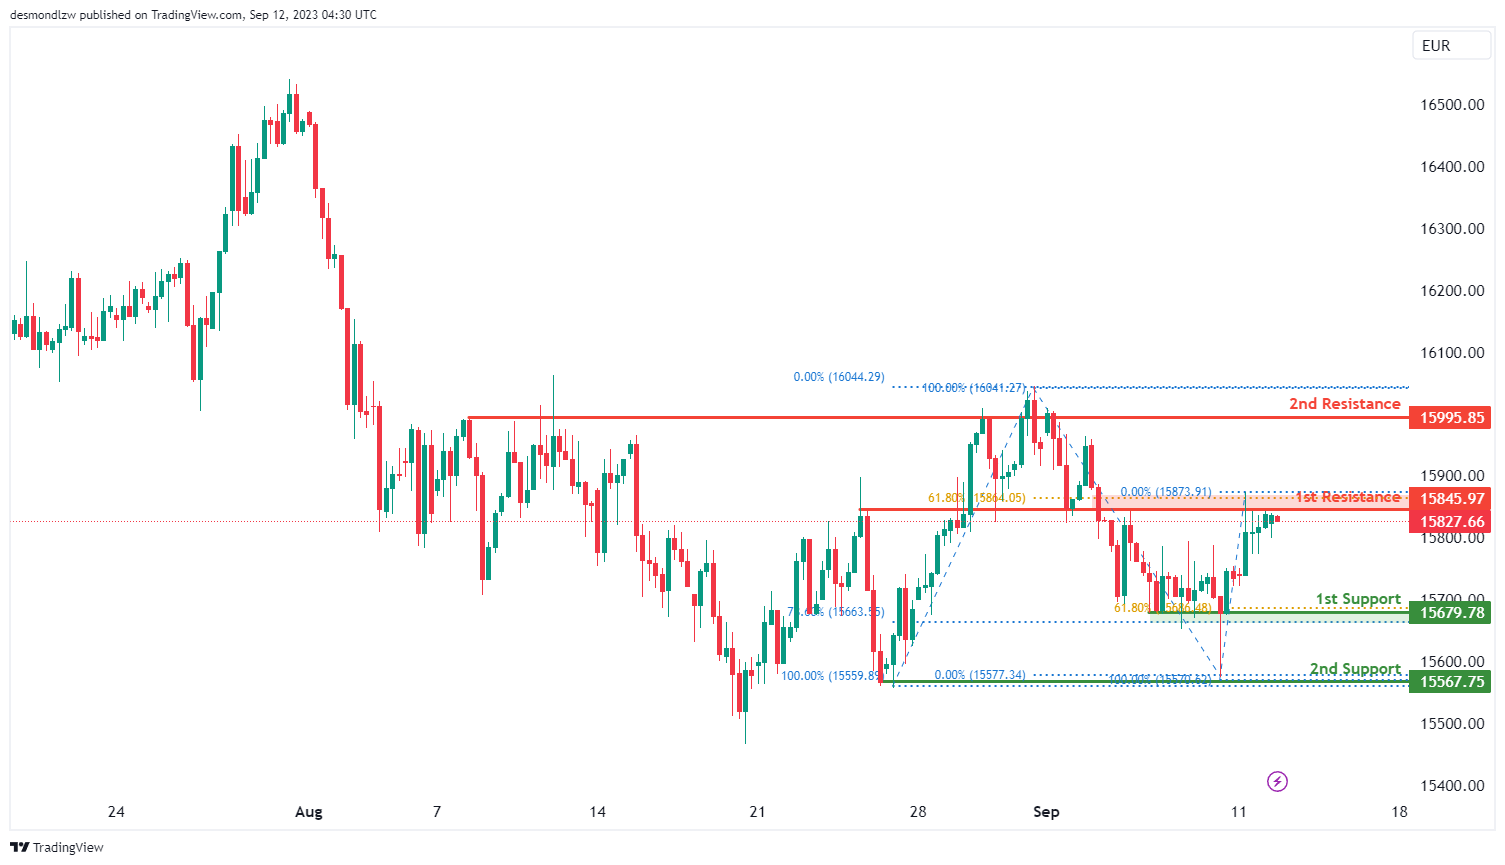
GER30:
For GER30, the overall momentum of the chart is currently bearish, indicating a downward trend.
There is potential for the price to continue its bearish movement towards the 1st support level at 15679.78. This 1st support level is considered significant because it represents multi-swing low support and aligns with both the 61.80% Fibonacci Retracement and the 78.60% Fibonacci Retracement, indicating a strong potential for support at this level due to Fibonacci confluence.
In case of a more significant decline, the 2nd support level at 15567.75 is also noteworthy, representing multi-swing low support and aligning with the 38.20% Fibonacci Retracement, providing additional reinforcement for the price.
On the upper side, if there’s a reversal in the price, it may face resistance at the 1st resistance level of 15845.97, identified as an overlap resistance and supported by the 61.80% Fibonacci Retracement.
Further upward movement could encounter resistance at the 2nd resistance level of 15995.85, characterized as multi-swing high resistance, which may act as a barrier to the bullish momentum within the observed range.
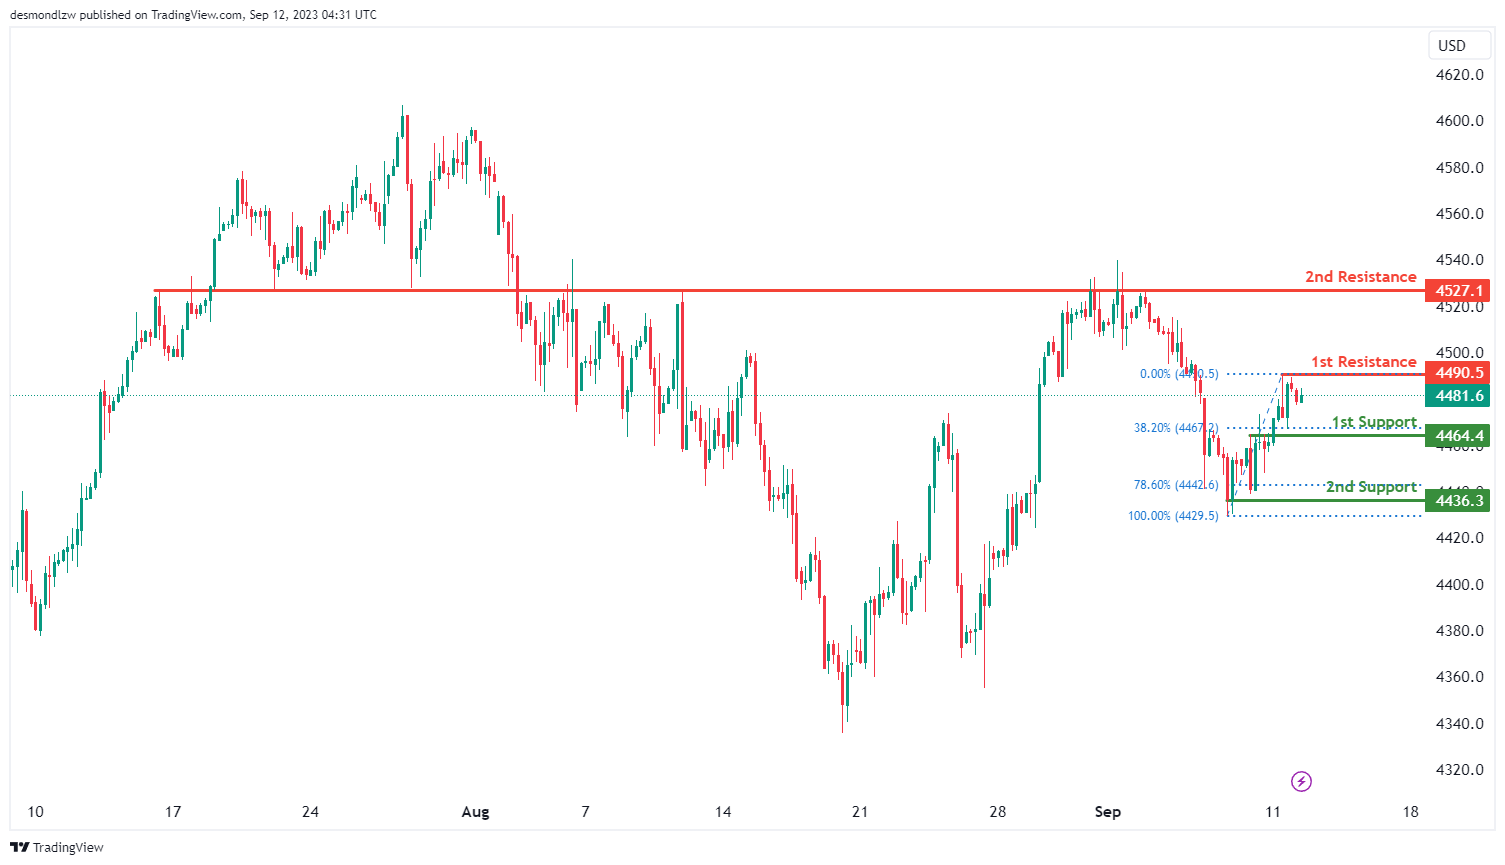
US500
For US500, the overall momentum of the chart is currently bearish, indicating a downward trend.
There is potential for the price to continue its bearish movement towards the 1st support level at 4464.4. This 1st support is considered significant because it represents a pullback support and aligns with the 38.20% Fibonacci Retracement level, suggesting potential stability and support at this level.
In case of a more substantial decline, the 2nd support level at 4436.3 is also noteworthy. This support level is characterized as a swing low support and aligns with the 78.60% Fibonacci Projection, adding further significance to it.
On the upper side, if there’s a reversal in the price, it may encounter resistance at the 1st resistance level of 4490.5, identified as a swing high resistance.
Further upward movement could face resistance at the 2nd resistance level of 4527.1, characterized as an overlap resistance, which may act as a barrier to the bullish momentum within the observed range.
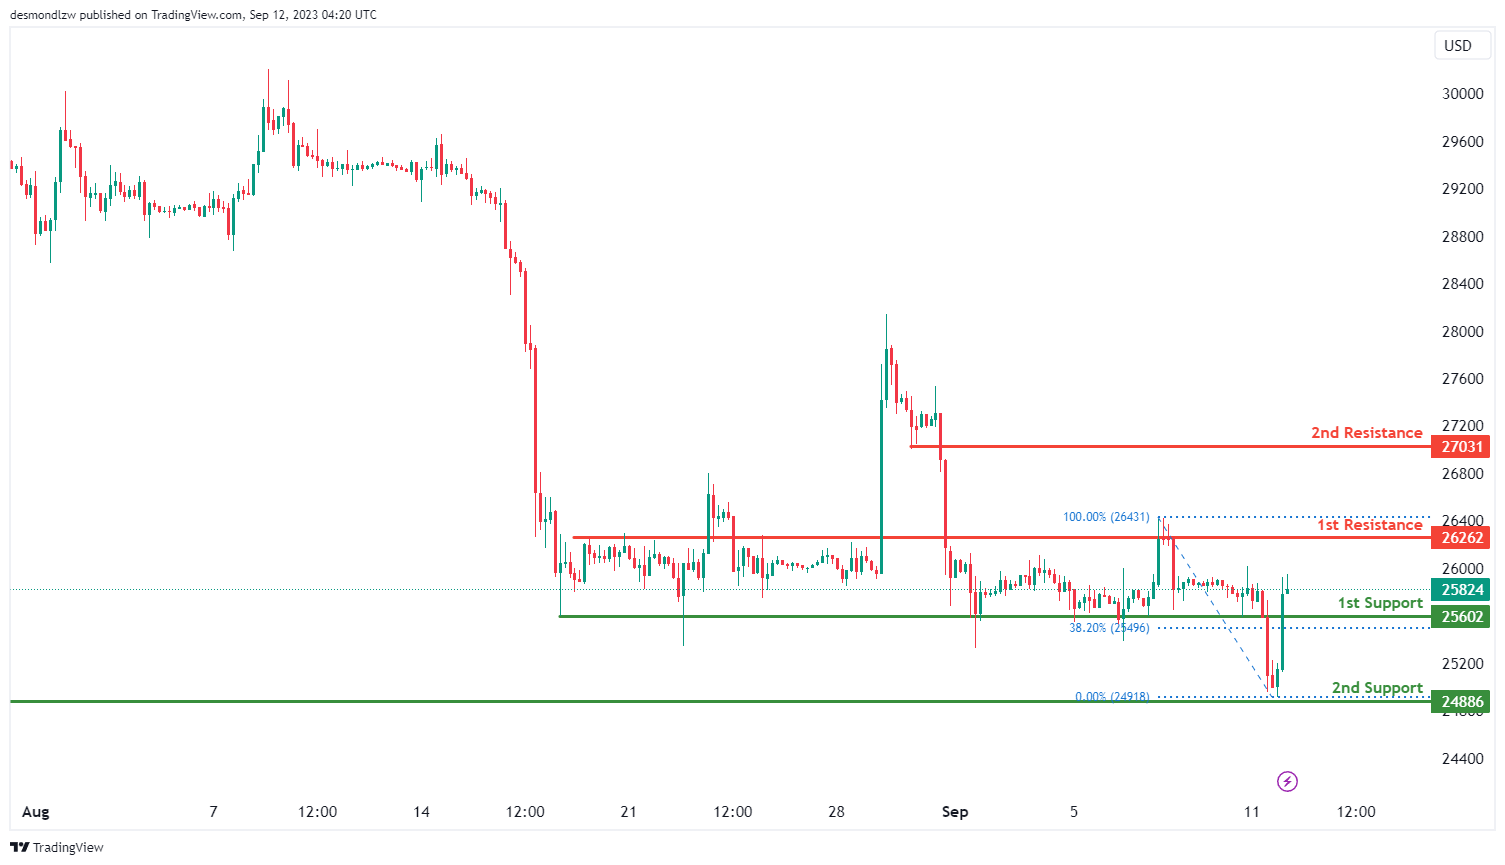
BTC/USD:
For BTC/USD, the overall momentum of the chart is currently bullish, indicating an upward trend.
There is potential for the price to make a bullish move by bouncing off the 1st support level at 25602 and heading towards the 1st resistance at 26262.
The 1st support at 25602 is considered significant because it represents a pullback support and aligns with the 38.20% Fibonacci Retracement level, suggesting potential stability and support at this level.
In case of a more substantial retracement, the 2nd support level at 24886 is also noteworthy as it represents multi-swing low support, which can provide additional support to the price.
On the upper side, the 1st resistance at 26262 is considered important because it represents an overlap resistance.
Further upward movement may encounter resistance at the 2nd resistance level of 27031, identified as a pullback resistance, which could pose a barrier to the bullish momentum.
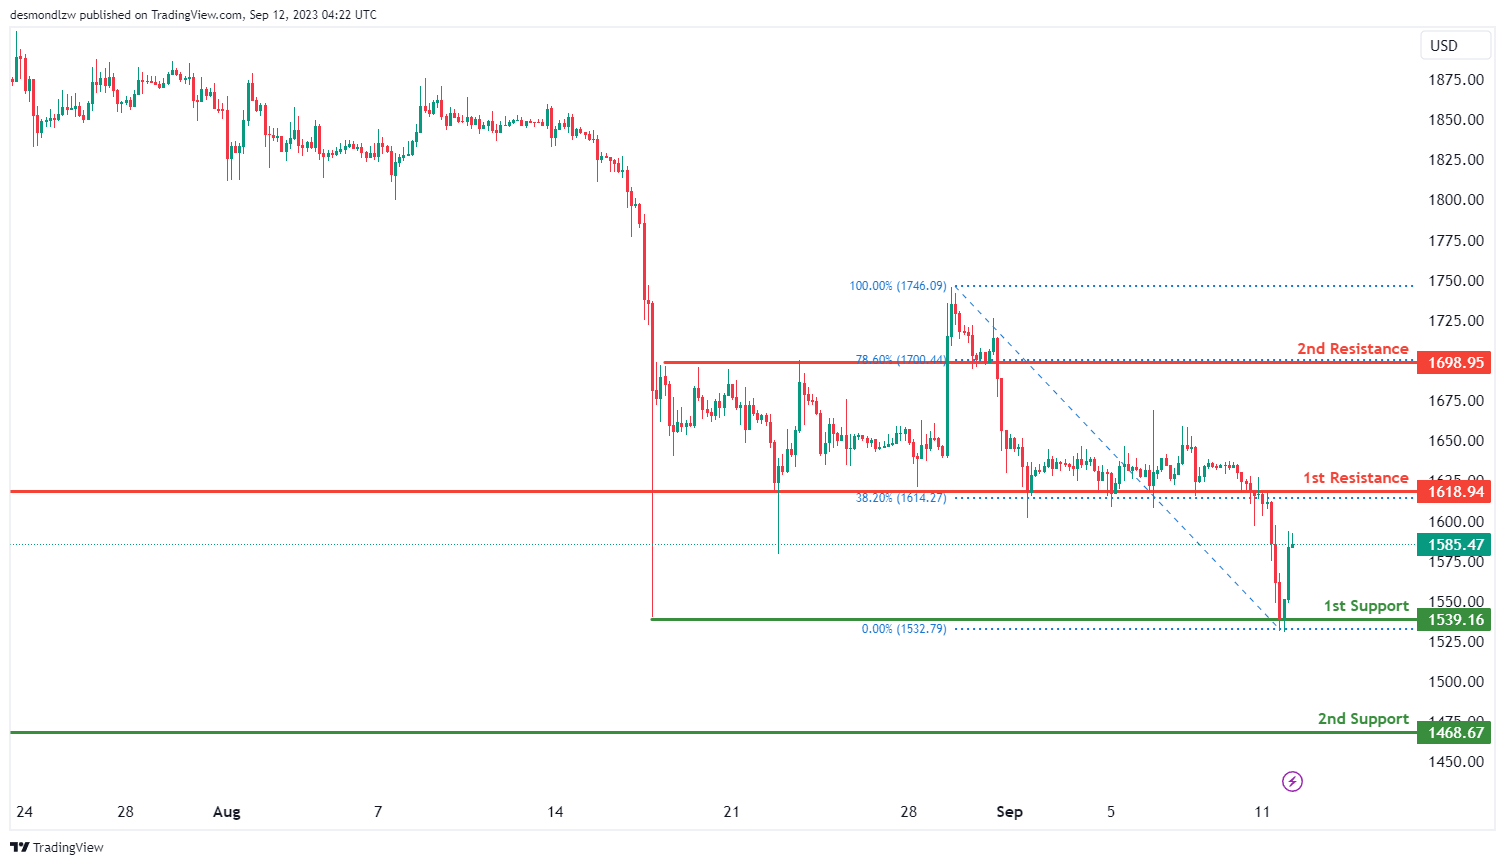
ETH/USD:
For ETH/USD, the overall momentum of the chart is currently bullish, indicating an upward trend.
There is potential for the price to continue its bullish movement towards the 1st resistance level at 1618.94.
The 1st support at 1539.16 is considered good because it represents multi-swing low support, indicating potential stability at this level.
In case of a more substantial retracement, the 2nd support level at 1468.67 is also noteworthy as it represents a swing low support, offering additional reinforcement for the price.
On the upper side, the 1st resistance at 1618.94 is considered important due to its characteristics as pullback resistance, supported by the 38.20% Fibonacci Retracement level. This level may act as a barrier to upward movement.
Further upward movement could face resistance at the 2nd resistance level of 1698.95, characterized as pullback resistance and aligned with the 78.60% Fibonacci Retracement level, potentially posing a significant obstacle to the bullish momentum.
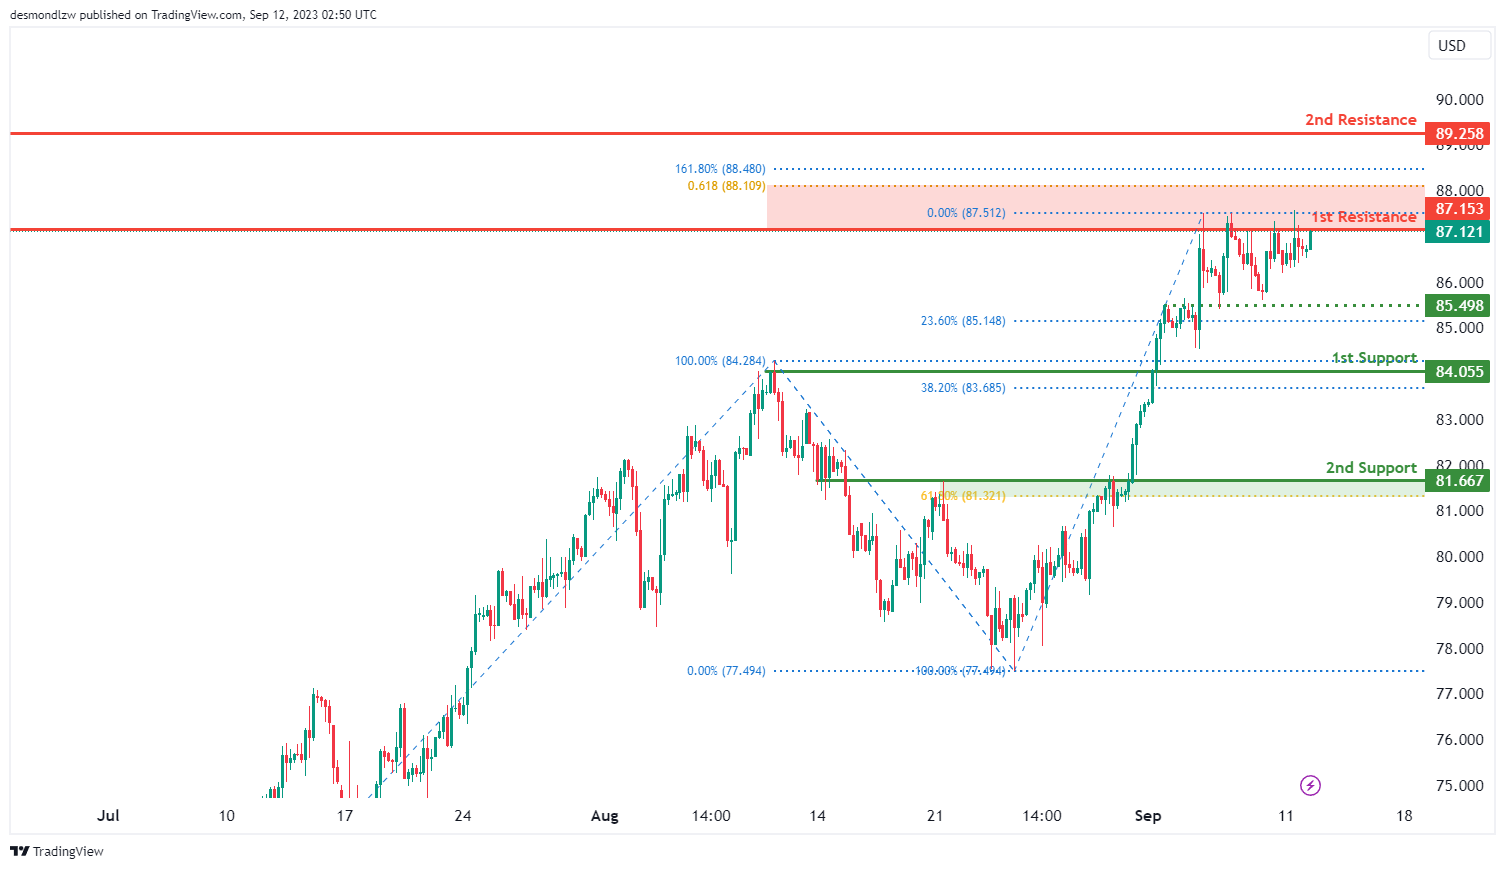
WTI/USD:
The WTI chart currently exhibits an overall bullish momentum, indicating a potential upward trend in price movement.There is a possibility of a bullish breakout beyond the 1st resistance level with the potential to rise towards the 2nd resistance level.
The 1st resistance level at 87.15 is identified as an overlap resistance that aligns with a confluence of Fibonacci levels i.e. the 61.80% projection and the 161.80% extension levels. Furthermore, the 2nd resistance level at 89.26 is marked as an overlap resistance, indicating its potential significance as a barrier to further bullish movements.
To the downside, the Intermediate support level at 85.49 is identified as an overlap support that aligns with the 23.60% Fibonacci retracement level. The 1st support level at 84.06 is identified as a pullback support that aligns with the 38.20% Fibonacci retracement level.
Additionally, the 2nd support level at 81.67 is identified as an overlap support that aligns with the 61.80% Fibonacci retracement level, further reinforcing its potential role as a support level.
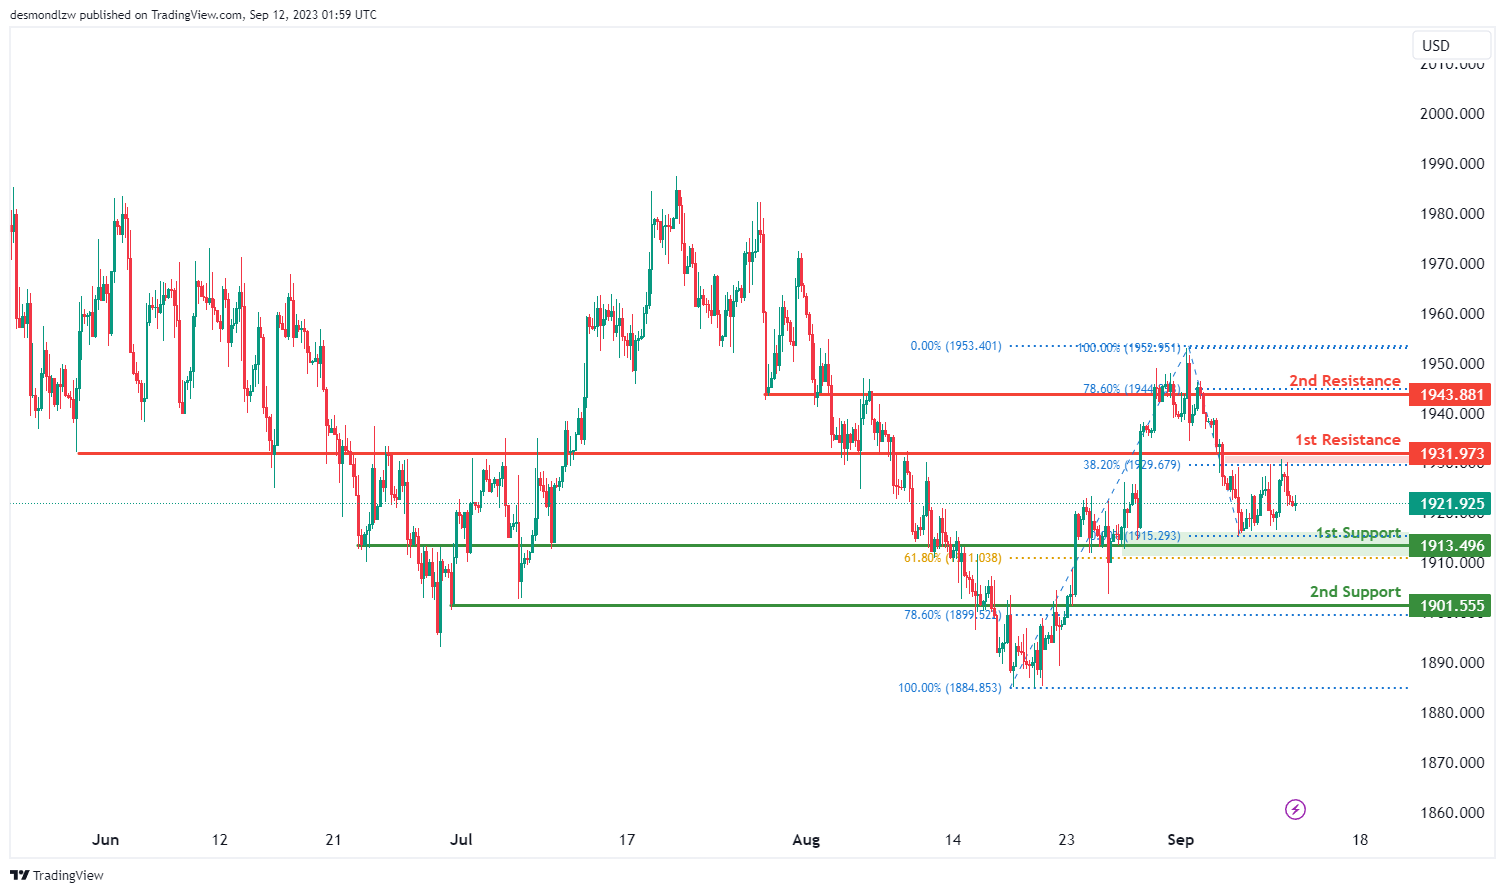
XAU/USD (GOLD):
The XAU/USD chart currently displays a neutral overall momentum, suggesting a lack of a clear directional trend.
Price is anticipated to fluctuate within a range defined by the 1st support at 1913.49 and the 1st resistance at 1931.97.
The 1st support level at 1913.49 is considered significant, representing an overlap support and aligning with the 61.80% Fibonacci Retracement level, indicating potential price support.
Additionally, the 2nd support at 1901.55 is also marked as an overlap support and aligns with the 78.60% Fibonacci Retracement, further reinforcing its potential role as a support level.
On the resistance side, the 1st resistance at 1931.97 is identified as an overlap resistance, potentially acting as a barrier to significant upward price movements.
Furthermore, the 2nd resistance level at 1943.88 is noted as an overlap resistance, indicating another potential resistance area.


