
DXY:
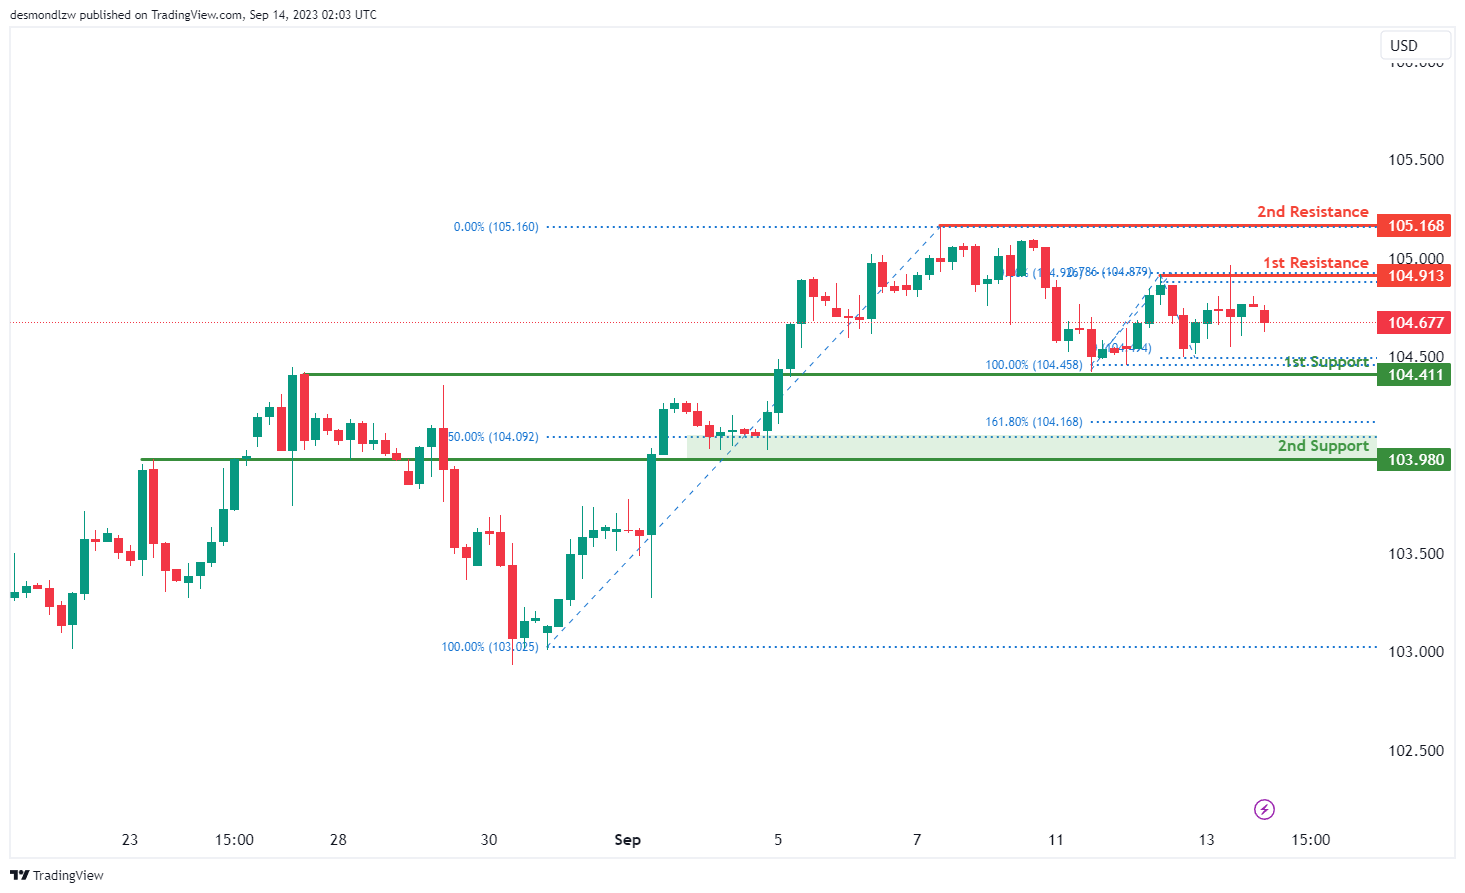
The DXY (US Dollar Index) chart currently reflects a neutral overall momentum, indicating a lack of a clear bullish or bearish bias.
There’s a potential scenario where the price may oscillate within a range, fluctuating between the 1st support and 1st resistance levels.
The 1st support level at 104.41 is considered significant as it represents an overlap support. Additionally, the 2nd support at 103.94 aligns with the 50% Fibonacci Retracement and the 161.80% Fibonacci Extension levels, indicating potential confluence and strength as a support area.
On the resistance side, the 1st resistance at 104.91 is characterized as a swing high resistance, potentially acting as a barrier to any bullish movements. Similarly, the 2nd resistance at 105.16 is identified as a swing high resistance.
EUR/USD:
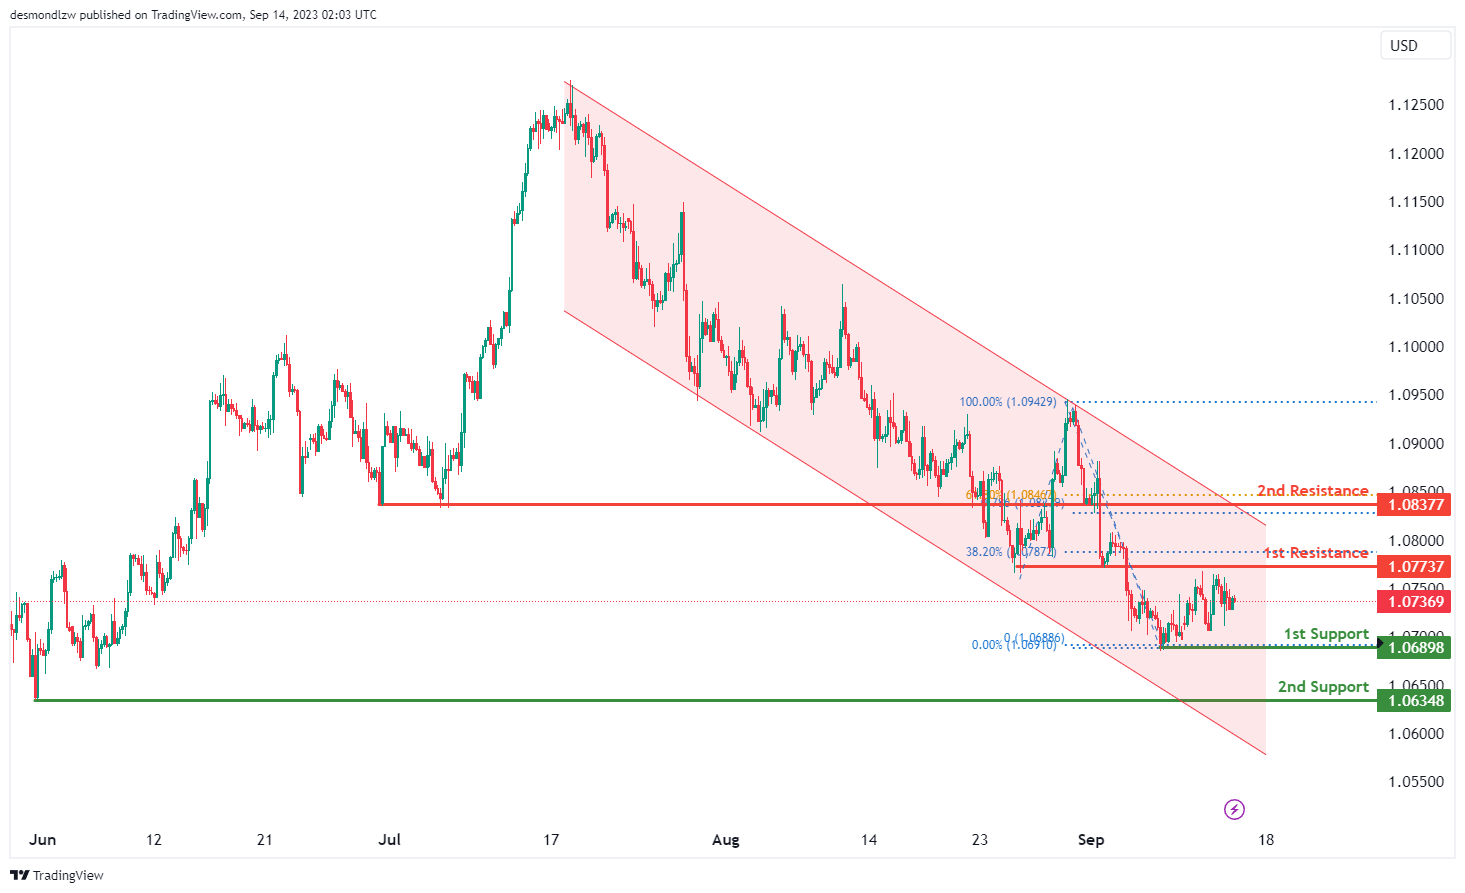
The EUR/USD chart exhibits a bearish overall momentum, driven by its position within a descending channel.
There’s a potential scenario for a bearish continuation towards the 1st support level at 1.0689, which is considered strong due to its alignment with a swing low support. Additionally, the 2nd support at 1.0634 provides further reinforcement as a swing low support.
On the resistance side, the 1st resistance at 1.0773 is marked as an overlap resistance, potentially acting as a barrier to any bullish movements. The 2nd resistance level at 1.0837 is also identified as an overlap resistance, further suggesting resistance in this area.
EUR/JPY:
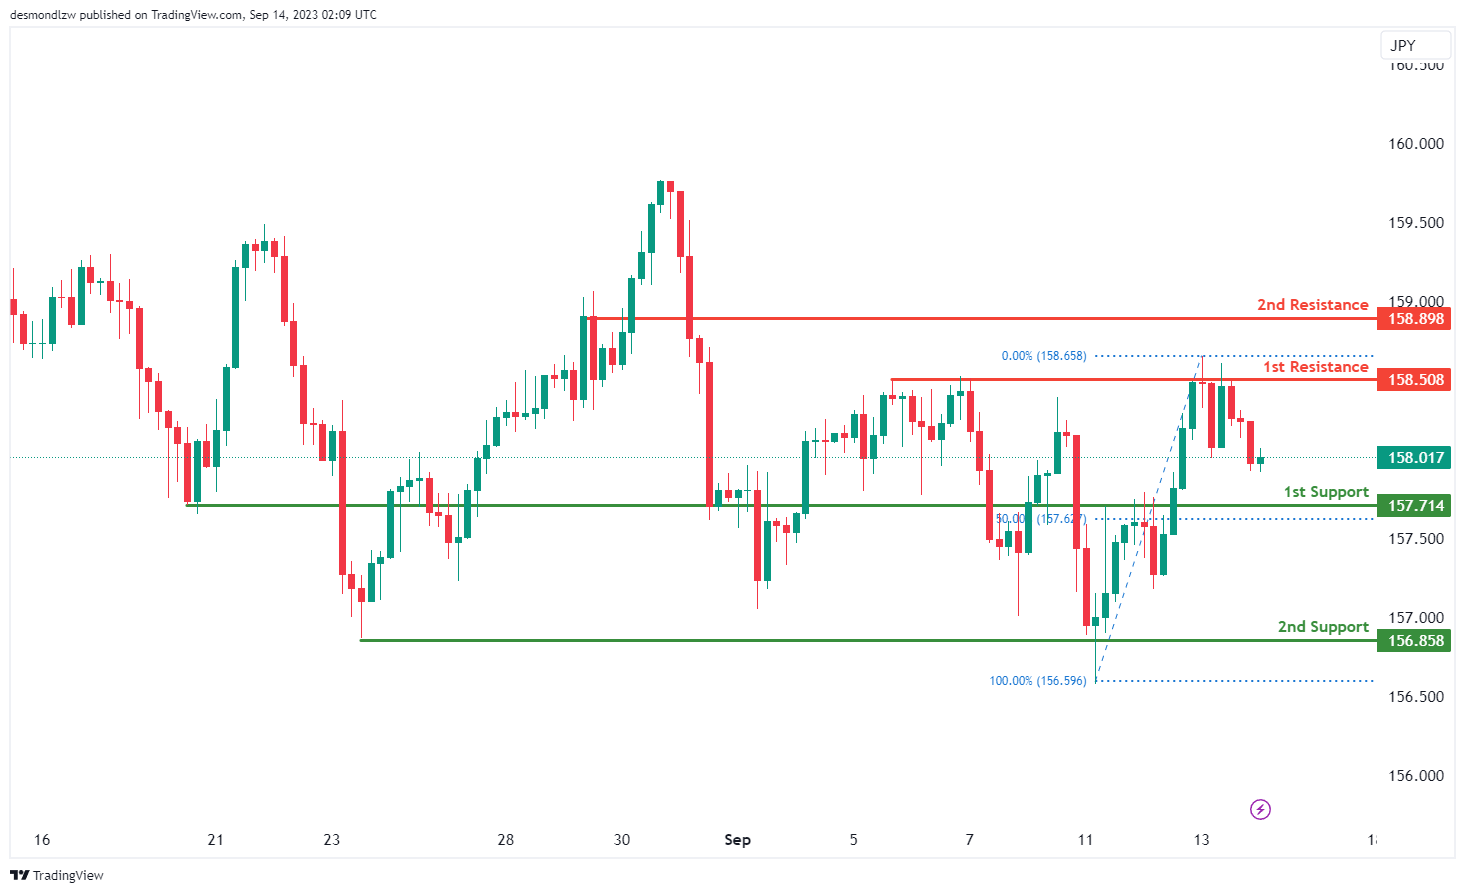
The EUR/JPY chart currently shows a neutral overall momentum, suggesting a lack of a clear trend. Price could potentially fluctuate between the 1st support level and the 1st resistance level.
The 1st support level at 157.71 is identified as an overlap support that aligns with the 50.00% Fibonacci retracement level. Additionally, the 2nd support level at 156.86 is marked as a multi-swing low support, further reinforcing its potential role as a support level.
To the upside, the 1st resistance level at 158.51 is identified as a multi-swing high resistance. Furthermore, the 2nd resistance level at 158.89 is marked as a pullback resistance, suggesting potential resistance in this area.
EUR/GBP:
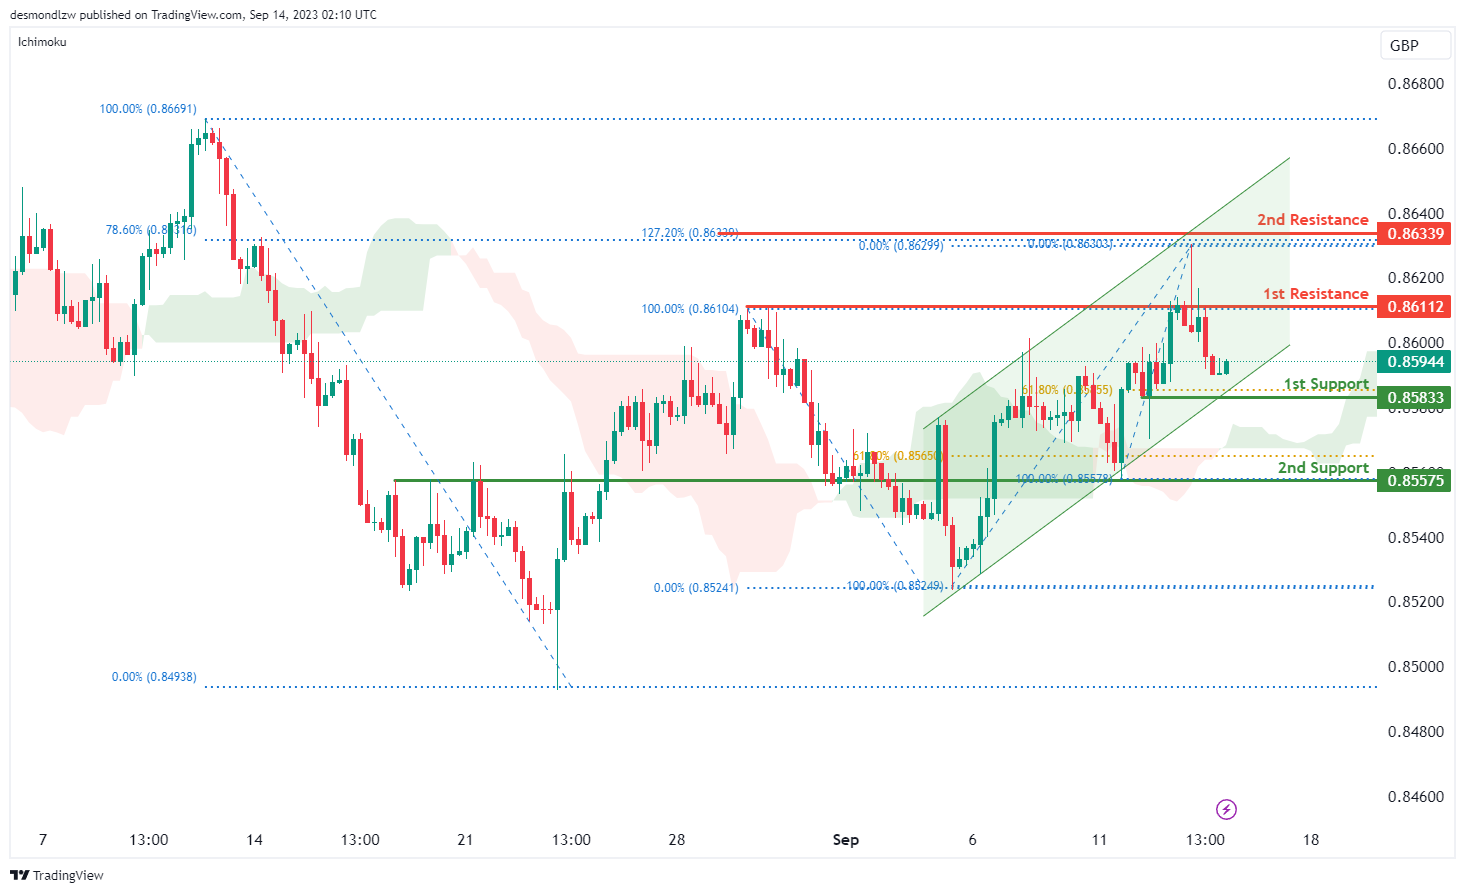
The EUR/GBP chart is currently characterized by a bullish overall momentum due to several contributing factors. These factors include the presence of a bullish ascending channel and the fact that the price is trading above the bullish Ichimoku cloud. These conditions collectively suggest that the price is likely to continue its upward trajectory. In this context, the price is expected to make a bullish move towards the 1st resistance level at 0.8611.
Additionally, several key support and resistance levels have been identified. The 1st support at 0.8593 is considered a strong pullback support, further supported by the presence of the 61.80% Fibonacci Retracement. The 2nd support at 0.8557 is marked as an overlap support, signifying its significance as a potential support zone.
On the resistance side, the 1st resistance at 0.8611 is characterized as a multi-swing high resistance, potentially acting as a barrier to any potential downward movements. The 2nd resistance at 0.8636 is notable as it aligns with both the 127.20% Fibonacci Extension and the 78.60% Fibonacci Retracement, indicating a strong zone of potential resistance.
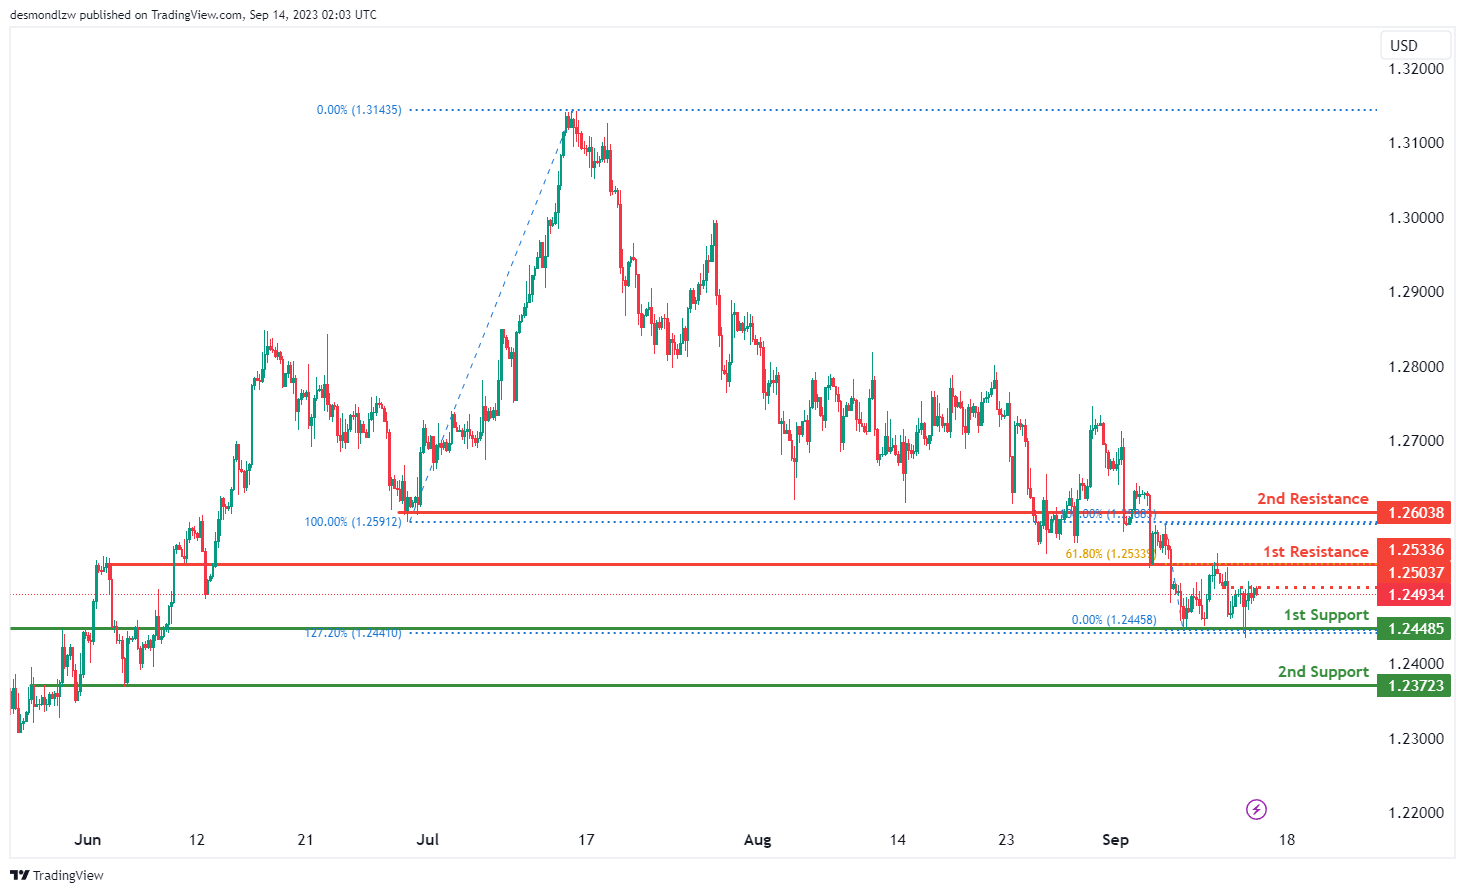
GBP/USD:
The GBP/USD chart currently exhibits a neutral overall momentum, indicating a lack of a clear bullish or bearish trend.
In this neutral scenario, there is a potential for price to fluctuate within a range between the 1st support at 1.2448 and the 1st resistance at 1.2533.
The 1st support at 1.2448 and the 2nd support at 1.2372 are both identified as overlap supports, which suggests that these levels have historical significance and could act as strong areas of price support.
On the resistance side, the 1st resistance at 1.2533 is considered significant as it aligns with the 61.80% Fibonacci Retracement level, potentially serving as a barrier to any bullish movements.
Furthermore, the 2nd resistance at 1.2603 is also marked as an overlap resistance, reinforcing its potential role as a resistance level.
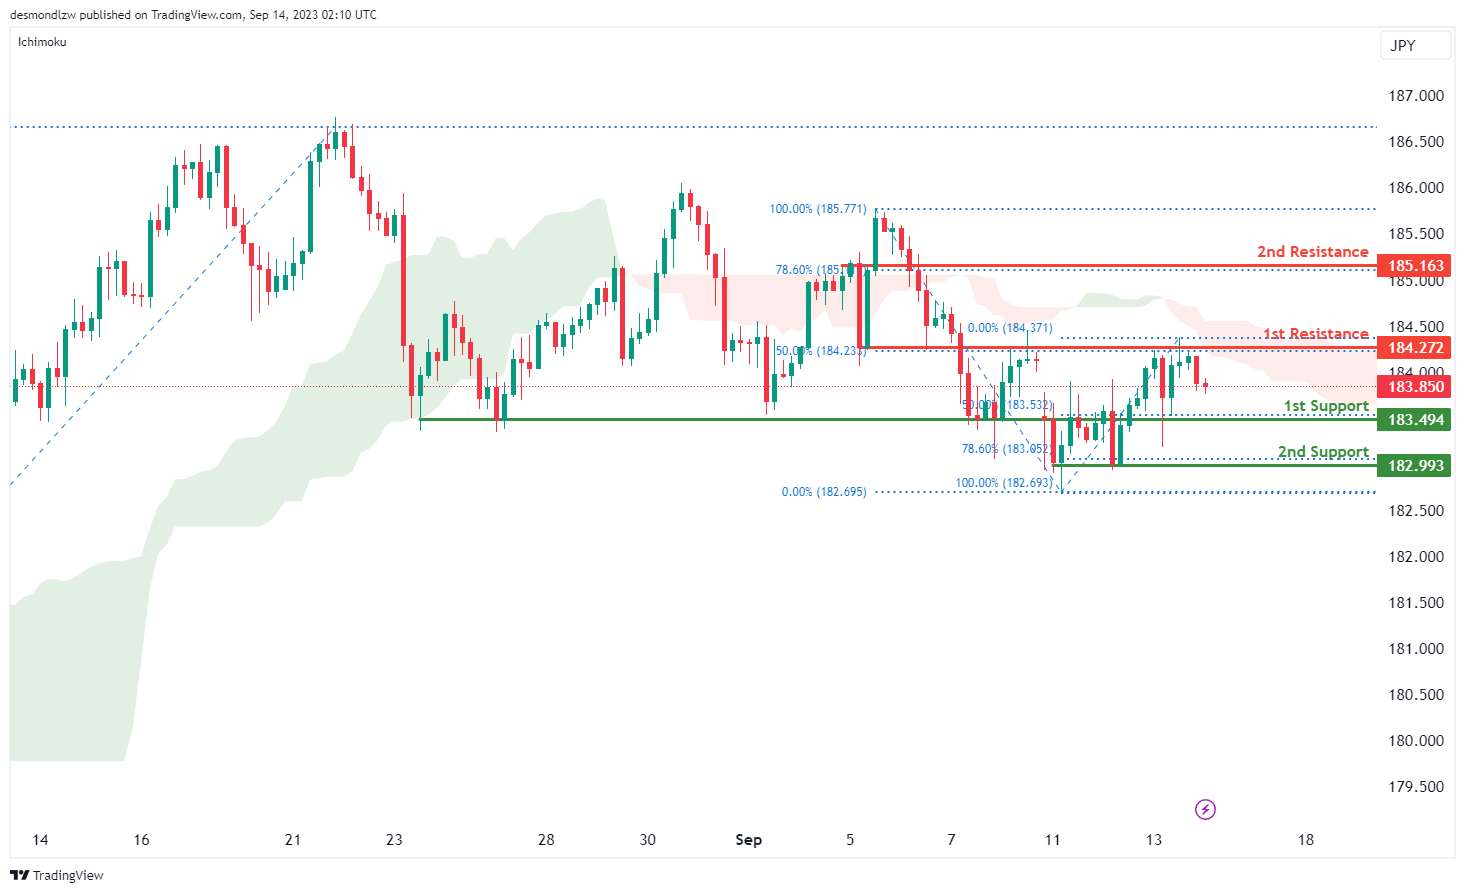
GBP/JPY:
The GBP/JPY chart currently exhibits a bearish overall momentum, suggesting a downward trend in price movement. This bearish momentum is supported by the fact that the price is below the bearish Ichimoku cloud, indicating a continuation of the bearish sentiment.
Price is expected to potentially continue its bearish movement towards the 1st support level at 183.49. This support level is significant as it represents an overlap support and aligns with the 50% Fibonacci Retracement level, indicating a strong potential support zone.
Furthermore, the 2nd support at 182.79 is marked as an overlap support and aligns with the 78.60% Fibonacci Retracement, further reinforcing its potential role as a support level.
On the resistance side, the 1st resistance at 184.27 is identified as an overlap resistance, potentially acting as a barrier to any bullish movements.
Additionally, the 2nd resistance level at 185.16 is noted as a pullback resistance and aligns with the 78.60% Fibonacci Retracement, indicating potential resistance in this area.
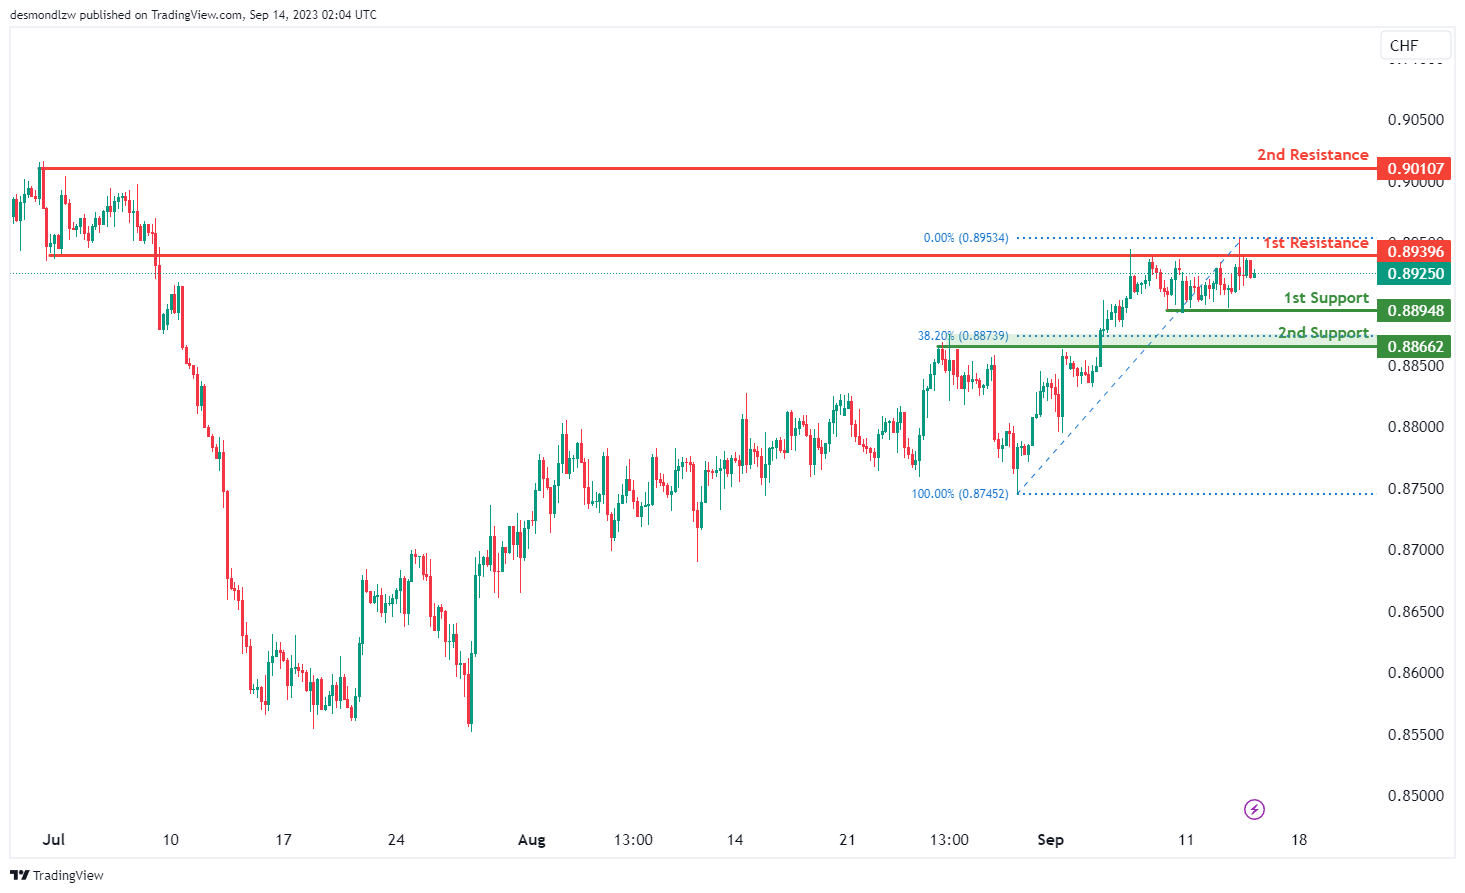
USD/CHF:
The USD/CHF chart currently demonstrates a neutral overall momentum, indicating a lack of a clear bullish or bearish trend.
In this neutral scenario, there is a potential for price to fluctuate within a range between the 1st support at 0.8866 and the 1st resistance at 0.8939.
The 1st support at 0.8866 is identified as a pullback support and aligns with the 38.20% Fibonacci Retracement level, enhancing its significance as a potential area of price support.
On the resistance side, the 1st resistance at 0.8939 is considered significant as it represents an overlap resistance.
Additionally, the 2nd resistance at 0.9010 is noted as a swing high resistance, further reinforcing its potential as a resistance level.
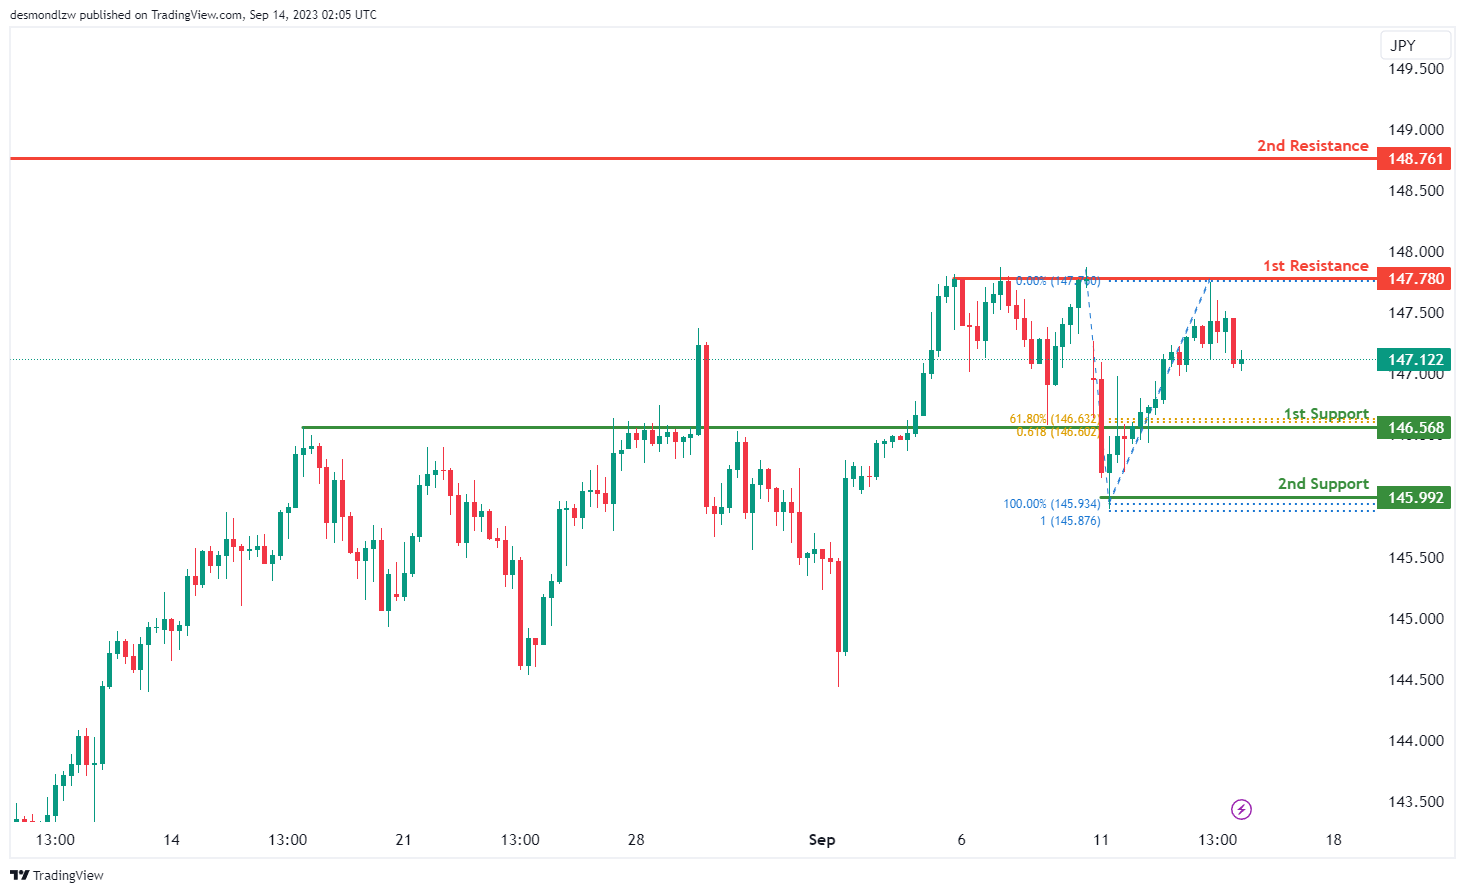
USD/JPY:
The USD/JPY chart currently exhibits a bearish overall momentum, suggesting a potential downward trend in price.
There is a possibility that price may continue its bearish movement towards the 1st support level at 146.56. This support level is considered significant as it aligns with a swing low support and coincides with both the 61.80% Fibonacci Projection and the 61.80% Fibonacci Retracement, indicating a strong potential support zone.
Additionally, the 2nd support level at 145.99 is marked as a multi-swing low support and aligns with the 100% Fibonacci Projection, further reinforcing its potential role as a support level.
On the resistance side, the 1st resistance at 147.78 is considered significant as it represents a multi-swing high resistance.
Furthermore, the 2nd resistance level at 148.76 is identified as a swing high resistance.
USD/CAD:
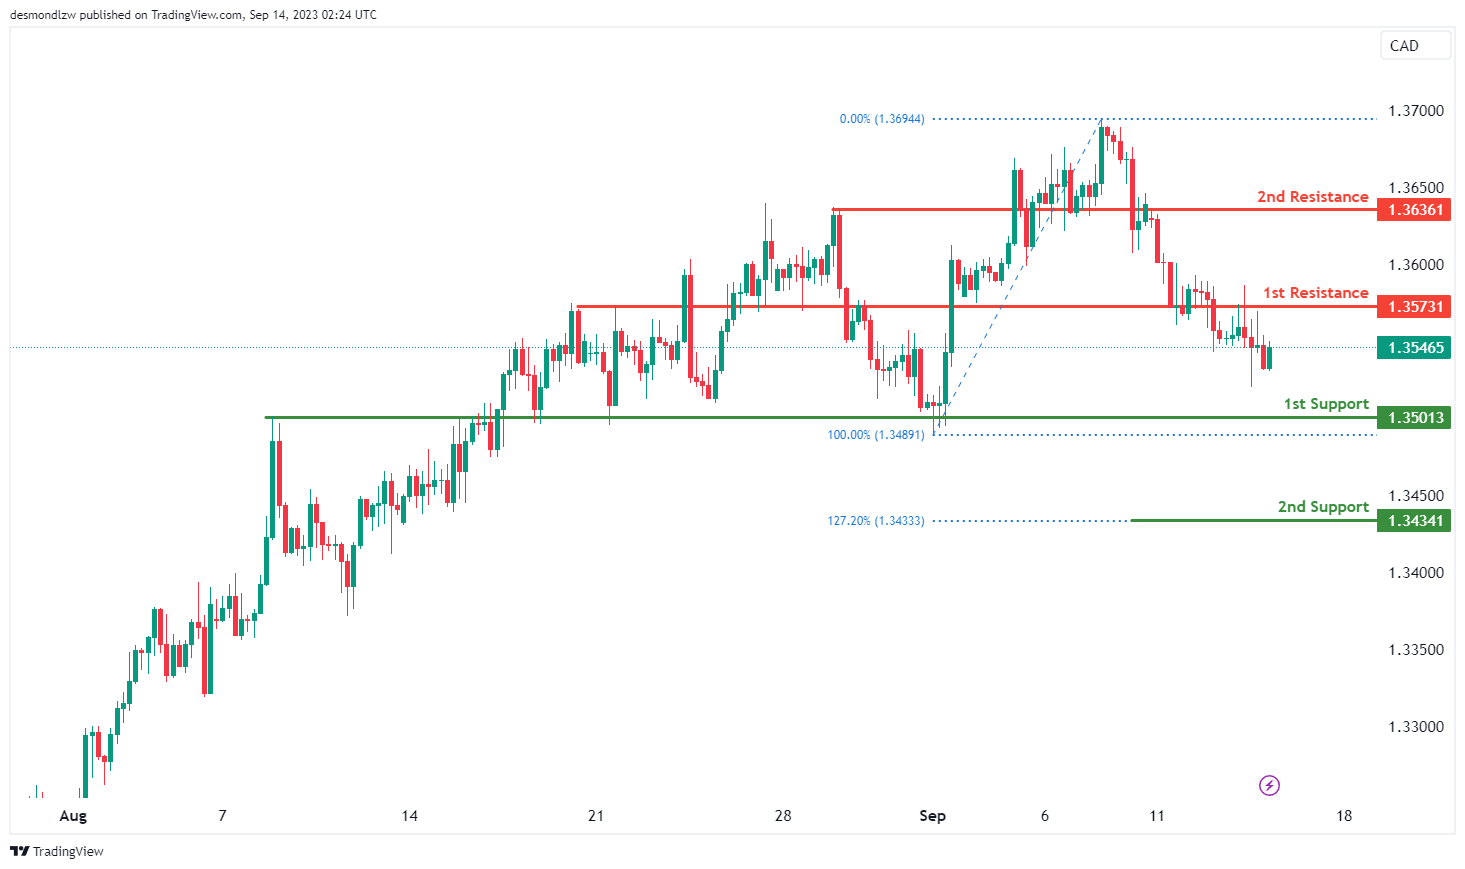
The USD/CAD chart currently displays an overall bullish momentum, indicating the potential for an upward price trend. There is a possibility of a bullish continuation towards the 1st resistance level.
The 1st resistance level at 1.3573 is identified as an overlap resistance while the 2nd resistance level at 1.3636 is also noted as another overlap resistance, indicating potential resistance in this area.
To the downside, the 1st support level at 1.3501 is identified as an overlap support while the 2nd support level at 1.3434 is marked as a pullback support, further reinforcing its role as a potential support zone.
AUD/USD:
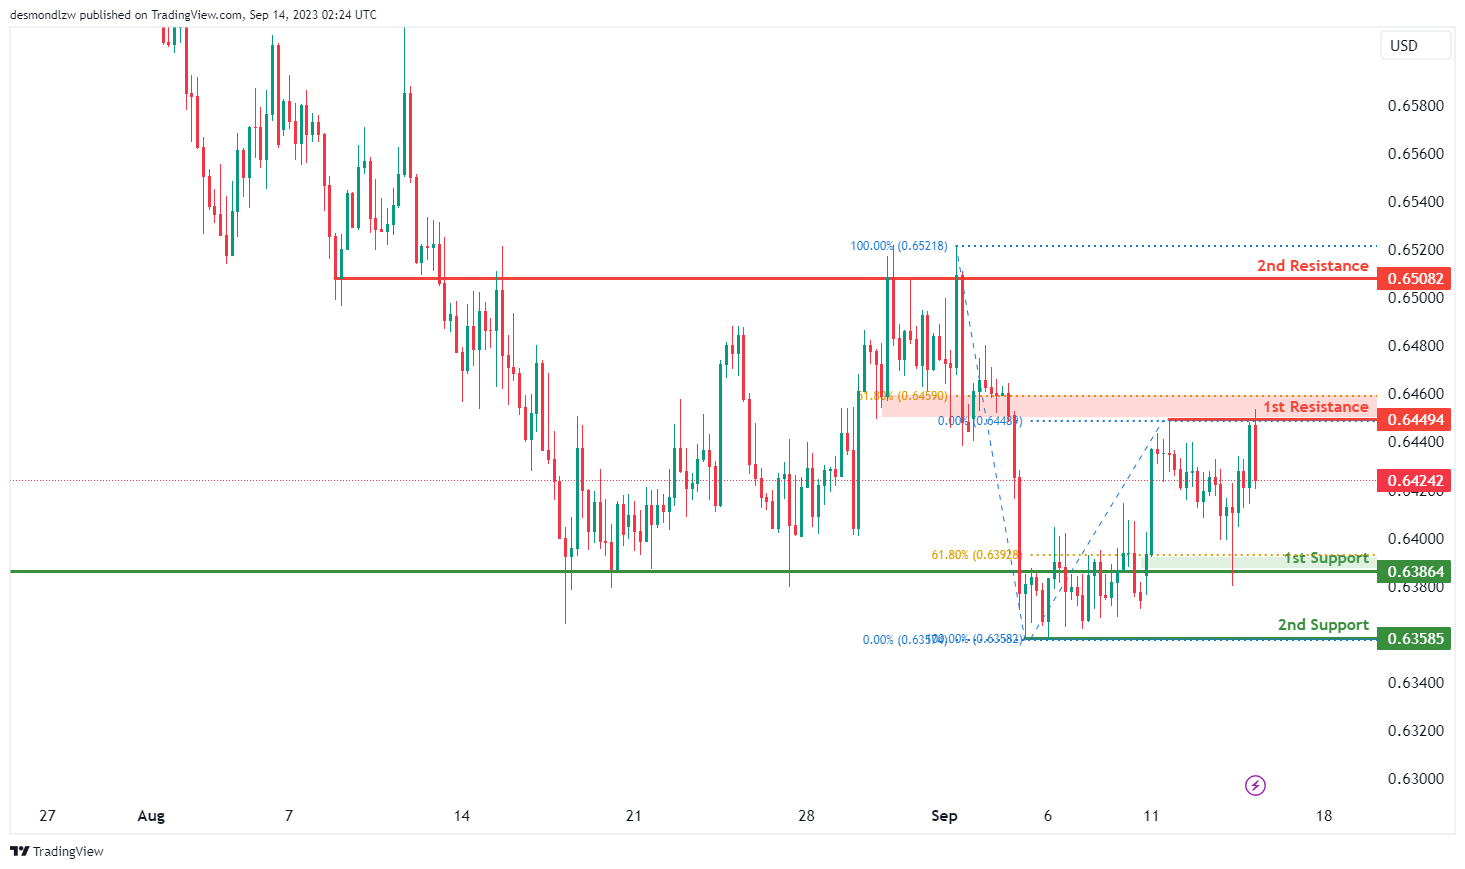
The AUD/USD chart currently exhibits an overall bearish momentum, suggesting a potential downward trend in price movement. There is a possibility of a bearish continuation towards the 1st support level.
The 1st support level at 0.6386 is identified as an overlap support that aligns with the 61.80% Fibonacci retracement level. Additionally, the 2nd support level at 0.6359 is marked as a pullback support, further reinforcing its potential role as a support level.
To the upside, the 1st resistance level at 0.6449 is identified as a multiple swing-high resistance that aligns with the 61.80% Fibonacci retracement level. Furthermore, the 2nd resistance level at 0.6508 is marked as an overlap resistance, suggesting potential resistance in this area.
NZD/USD
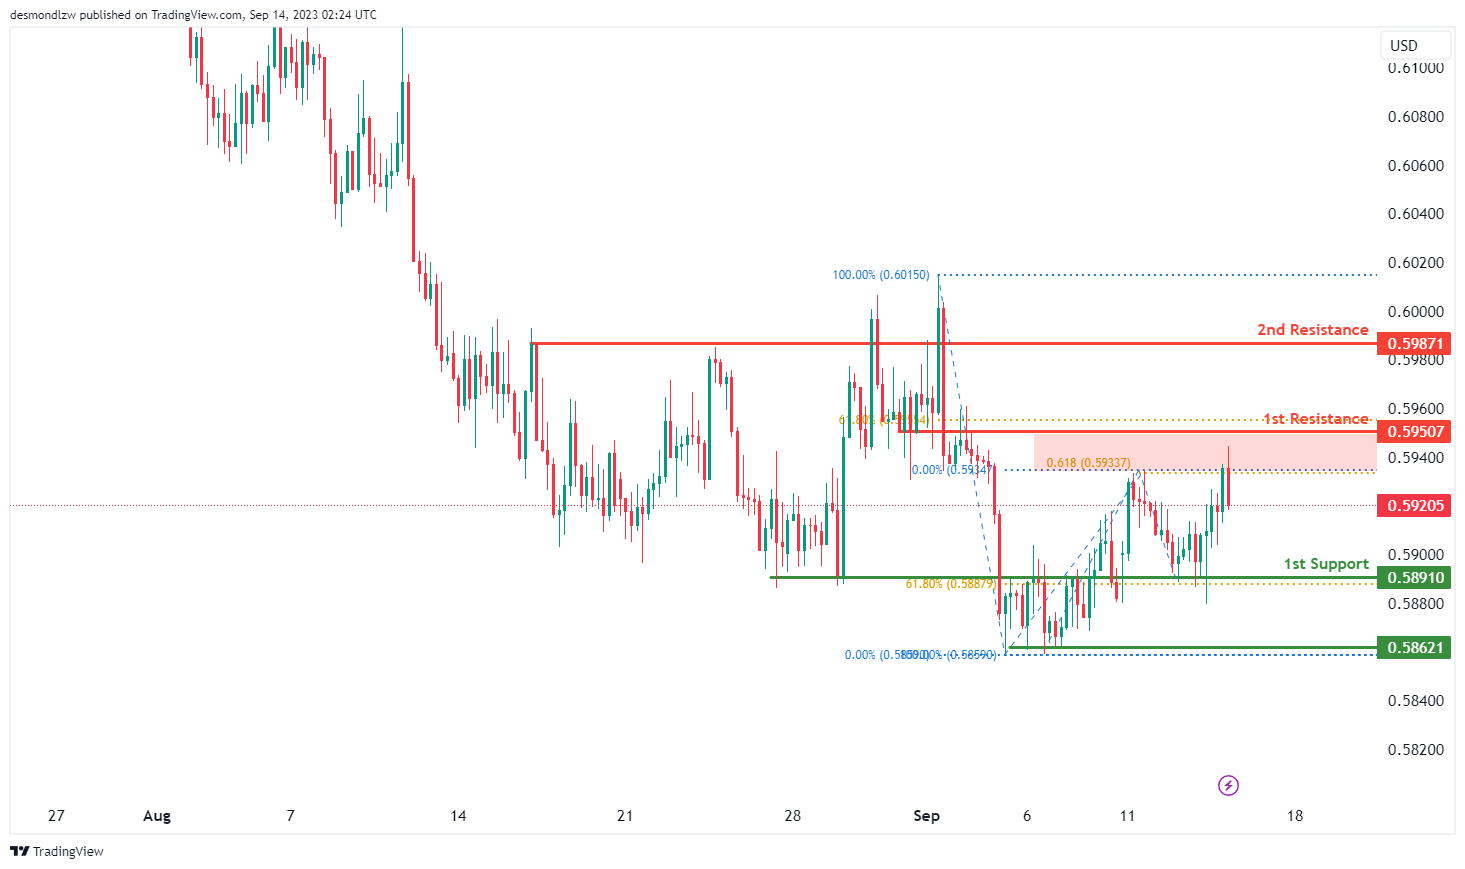
The NZD/USD chart currently indicates an overall bearish momentum, indicating a potential downward trend in price movement. There is a possibility of a bearish continuation towards the 1st support level.
The 1st support level at 0.5891 is identified as an overlap support that aligns with the 61.80% Fibonacci retracement level. Additionally, the 2nd support level at 0.5862 is marked as a pullback support, further reinforcing its potential role as a support level.
To the upside, the 1st resistance level at 0.5951 is identified as an overlap resistance that aligns with a confluence of Fibonacci levels i.e. the 61.80% retracement and the 61.80% projection levels, indicating a strong potential resistance zone. Furthermore, the 2nd resistance level at 0.5987 is noted as a pullback resistance.
DJ30:
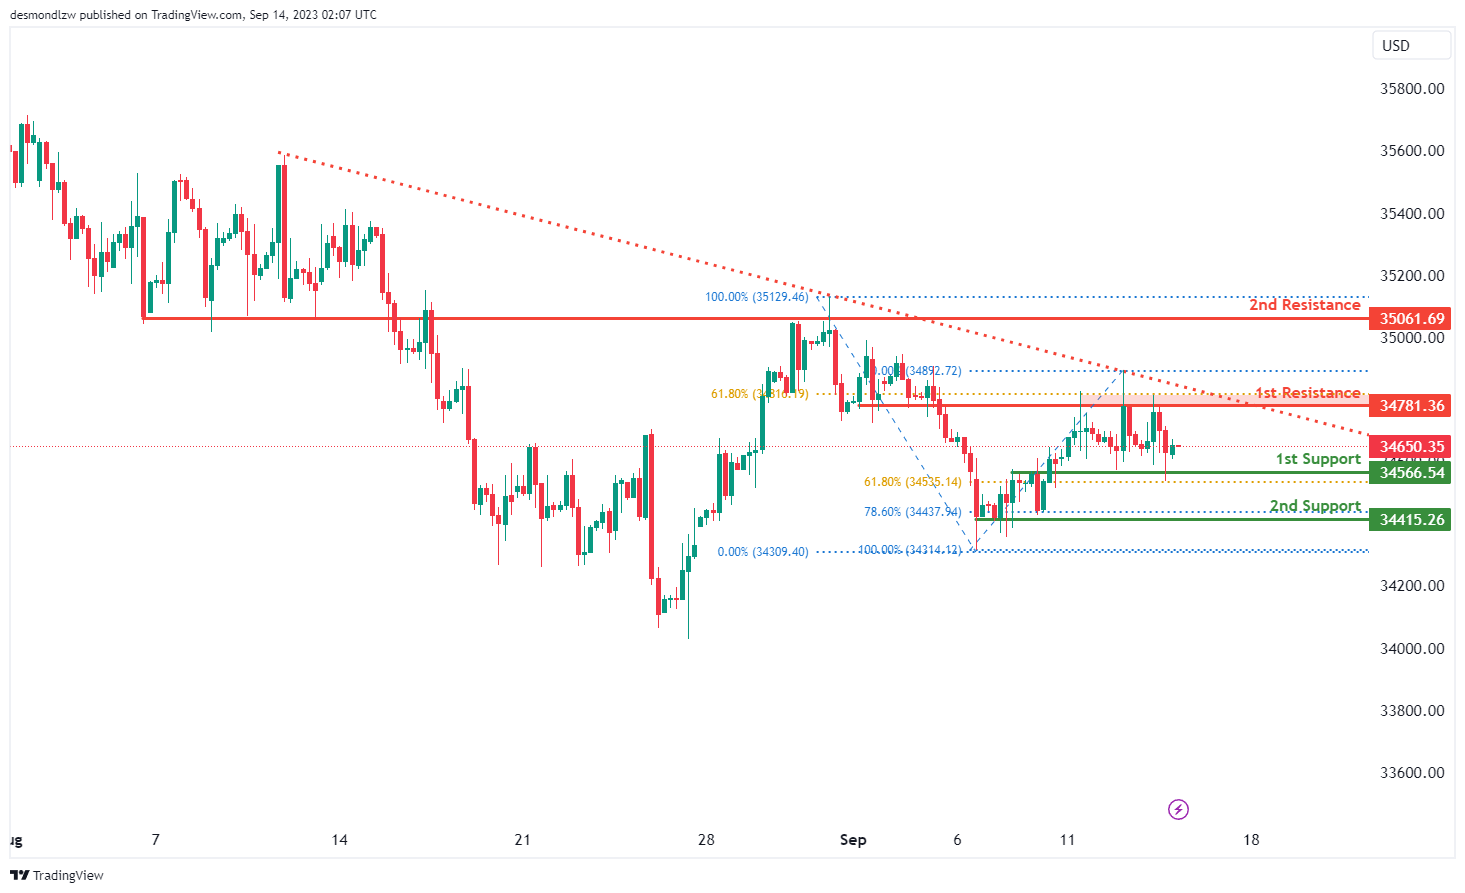
The DJ30 (Dow Jones Industrial Average) chart currently exhibits a bearish overall momentum, primarily attributed to the fact that the price is trading below a major descending trend line. This suggests a predisposition towards further bearish price movements.
There is a potential scenario in which the bearish momentum continues, leading the price to decline towards the 1st support level at 34,635.75. This support level is significant as it represents an overlap support and coincides with the 61.80% Fibonacci Retracement level, indicating a strong potential support zone.
Furthermore, the 2nd support level at 34,415.26 is identified as a multi-swing low support and aligns with the 78.60% Fibonacci Retracement level, reinforcing its role as a potential support area.
On the resistance side, the 1st resistance at 34,781.36 is considered an overlap resistance and aligns with the 61.80% Fibonacci Retracement level, signifying a significant potential barrier to any bullish movements. Additionally, the 2nd resistance at 35,061.69 is characterized as an overlap resistance.
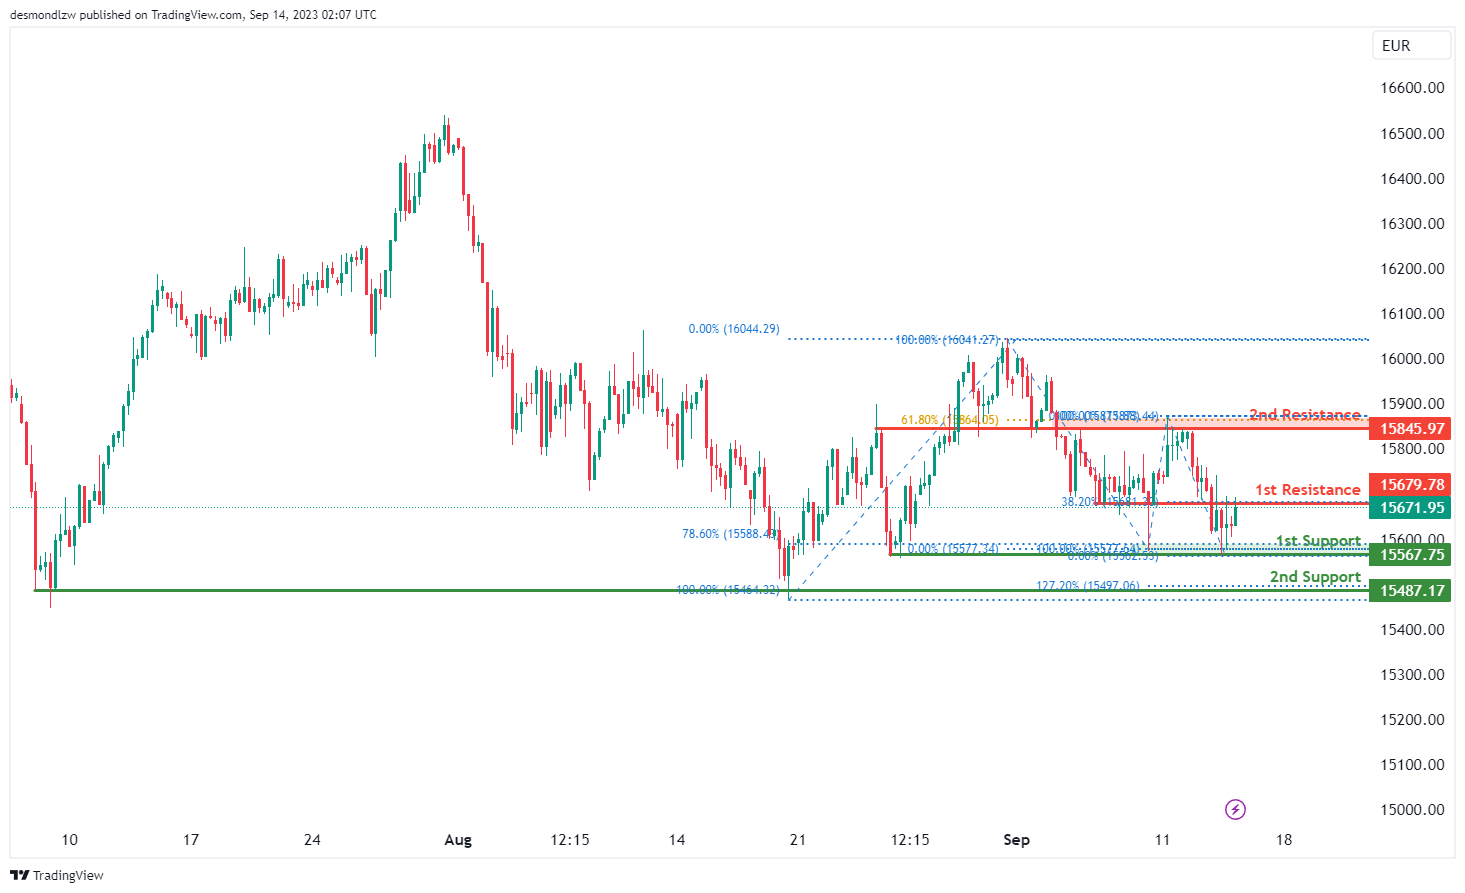
GER30:
The GER30 chart is currently displaying a neutral overall momentum, indicating a lack of a clear directional bias. Given this neutral outlook, it is anticipated that the price could move within a range, fluctuating between the 1st resistance and 1st support levels.
The 1st support level at 15567.75 is considered significant due to its alignment with a multi-swing low support, potentially serving as a strong level of price support. Additionally, the 2nd support at 15487.17 is marked as a swing low support and further reinforces its potential as a support zone.
On the resistance side, the 1st resistance level at 15679.78 is characterized as an overlap resistance, which may act as a barrier to any potential upward movements. The 2nd resistance at 15845.97 aligns with the 61.80% Fibonacci Retracement and is also noted as an overlap resistance, indicating a significant zone of potential resistance.
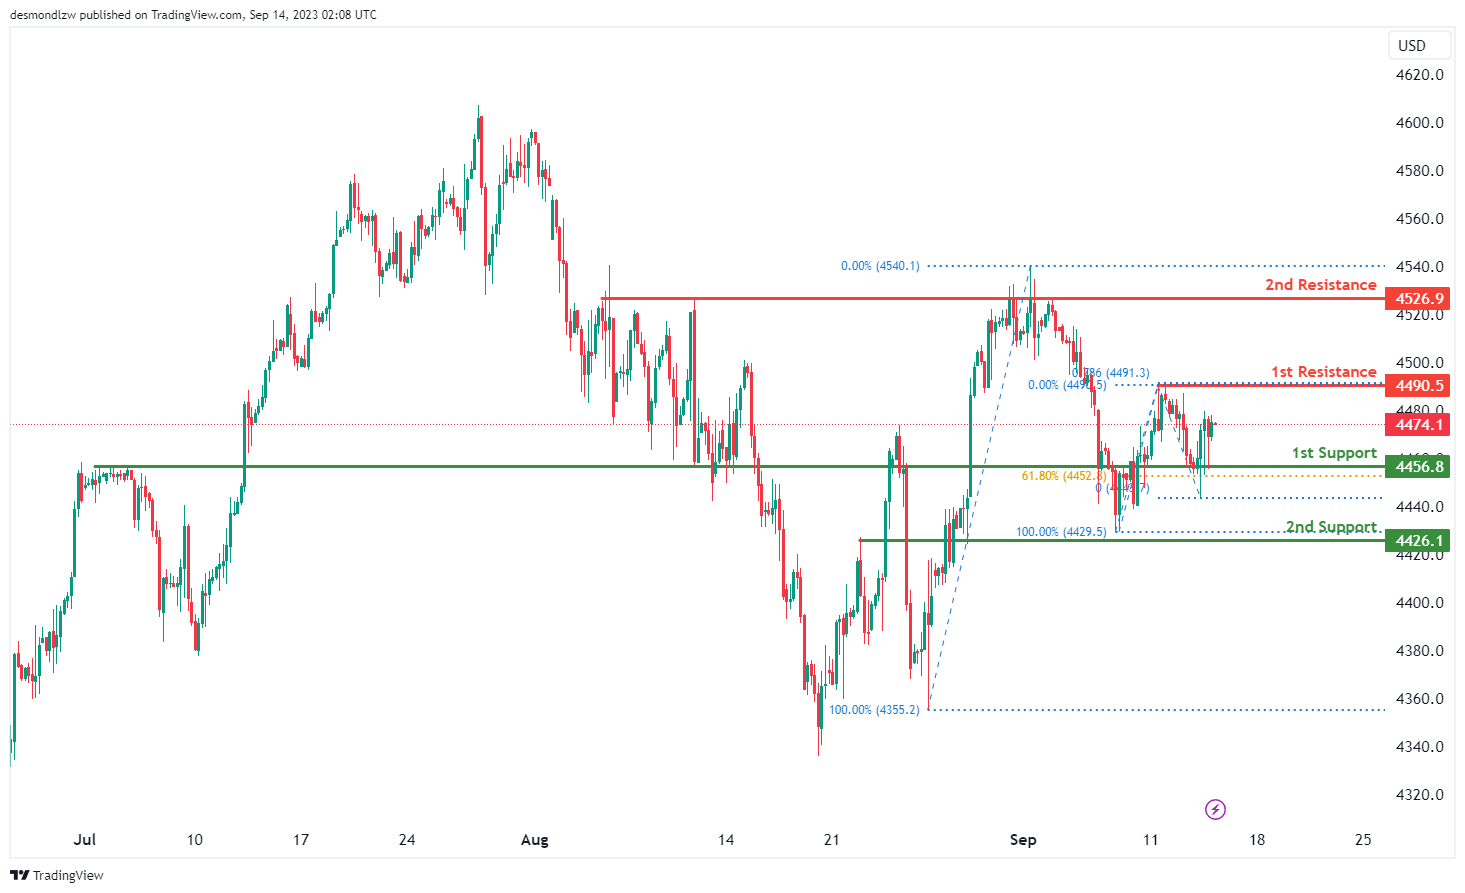
US500
The US500 chart currently exhibits a bullish overall momentum, indicating a potential upward trend in price movement. Given this bullish outlook, it is anticipated that the price could continue its bullish trajectory towards the 1st resistance.
The 1st support level at 4456.8 is marked as an overlap support and aligns with the 61.80% Fibonacci Retracement level, signifying a robust potential support zone. Additionally, the 2nd support at 4426.1 is identified as an overlap support, further reinforcing its role as a potential support level.
On the resistance side, the 1st resistance level at 4490.5 is characterized as a swing high resistance, which could pose a challenge to further bullish movements. The 2nd resistance at 4526.9 aligns with multi-swing high resistance, indicating a significant area of potential resistance.
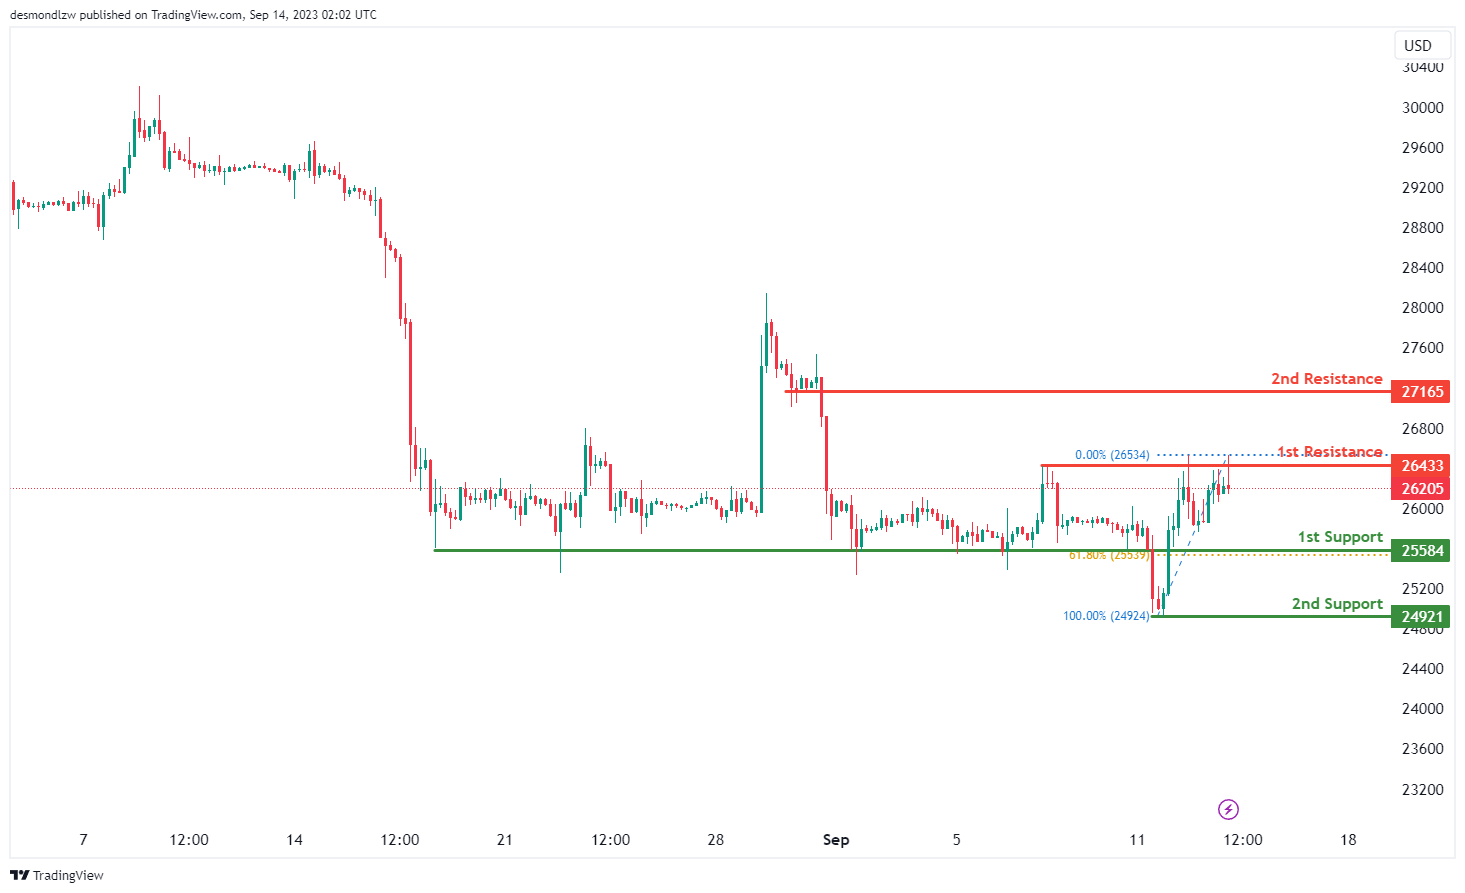
BTC/USD:
The BTC/USD chart currently displays a bearish overall momentum, indicating the potential for a continued downward trend in price movement. It is anticipated that the price could sustain this bearish trajectory towards the 1st support.
The 1st support level at 25,584 is marked as a pullback support and coincides with the 61.80% Fibonacci Retracement level, signifying a robust potential support area. Additionally, the 2nd support at 24,921 is identified as a swing low support, further reinforcing its role as a potential support level.
On the resistance side, the 1st resistance level at 26,453 is characterized as a multi-swing high resistance, which may act as a barrier to further bearish movements. The 2nd resistance at 27,165 aligns with pullback resistance, indicating a significant area of potential resistance.
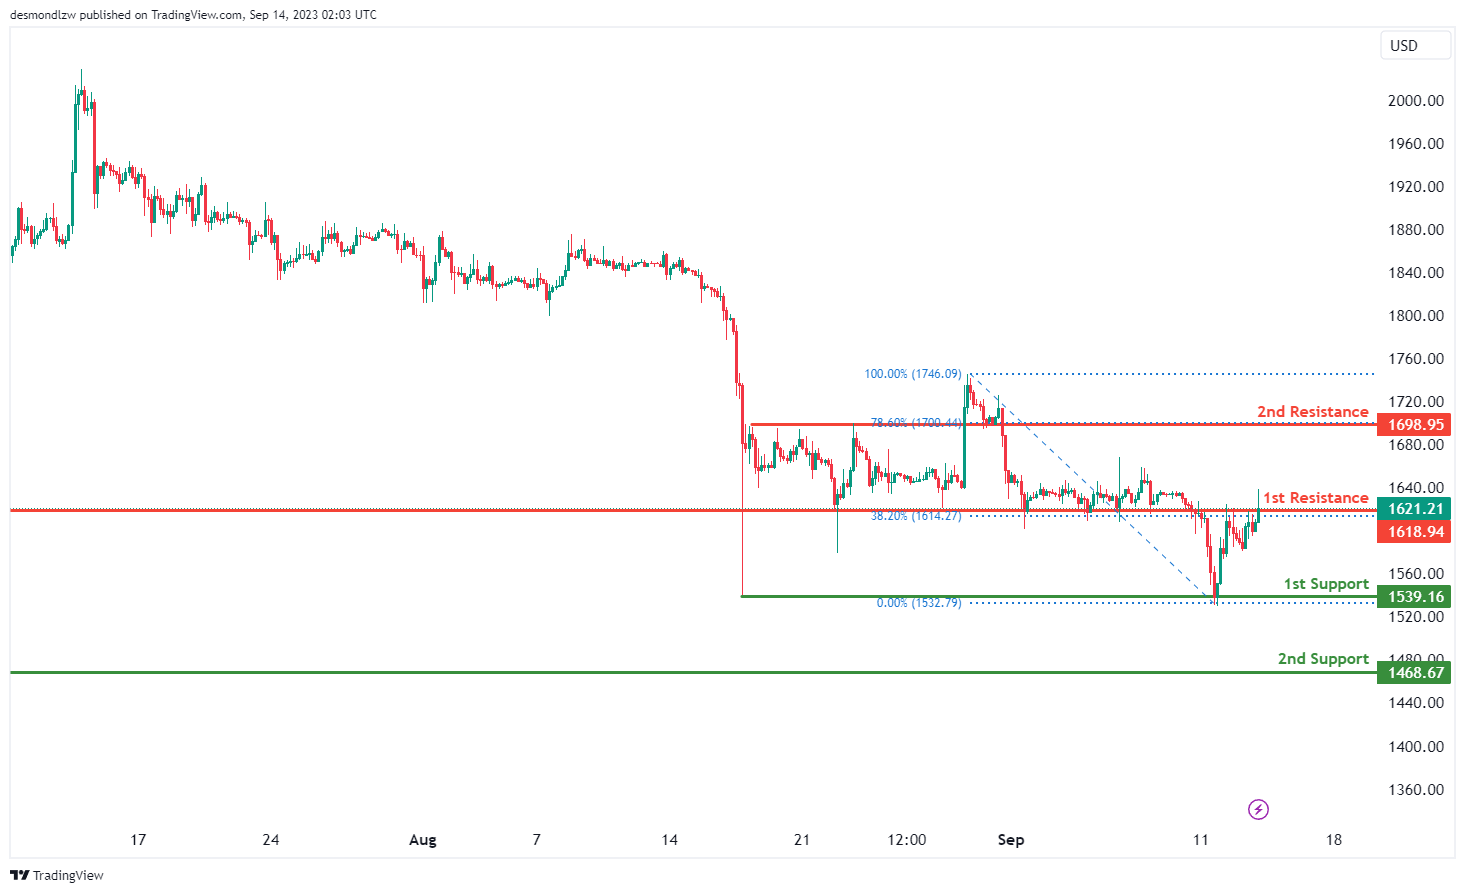
ETH/USD:
The ETH/USD chart is currently characterized by a bearish overall momentum, indicating the potential for a continued downward trend in price. There is a possibility that the price might react bearishly when it approaches the 1st resistance and subsequently drop towards the 1st support.
The 1st support level at 1,539.16 is identified as a multi-swing low support, signifying its significance as a potential support zone. Additionally, the 2nd support at 1,468.67 is a swing low support, further strengthening its role as a potential support level.
On the resistance side, the 1st resistance at 1,618.94 is marked as an overlap resistance, and it aligns with the 38.20% Fibonacci Retracement level, suggesting a significant area of potential resistance. Furthermore, the 2nd resistance at 1,698.95 is characterized as pullback resistance, indicating another key level of potential resistance.
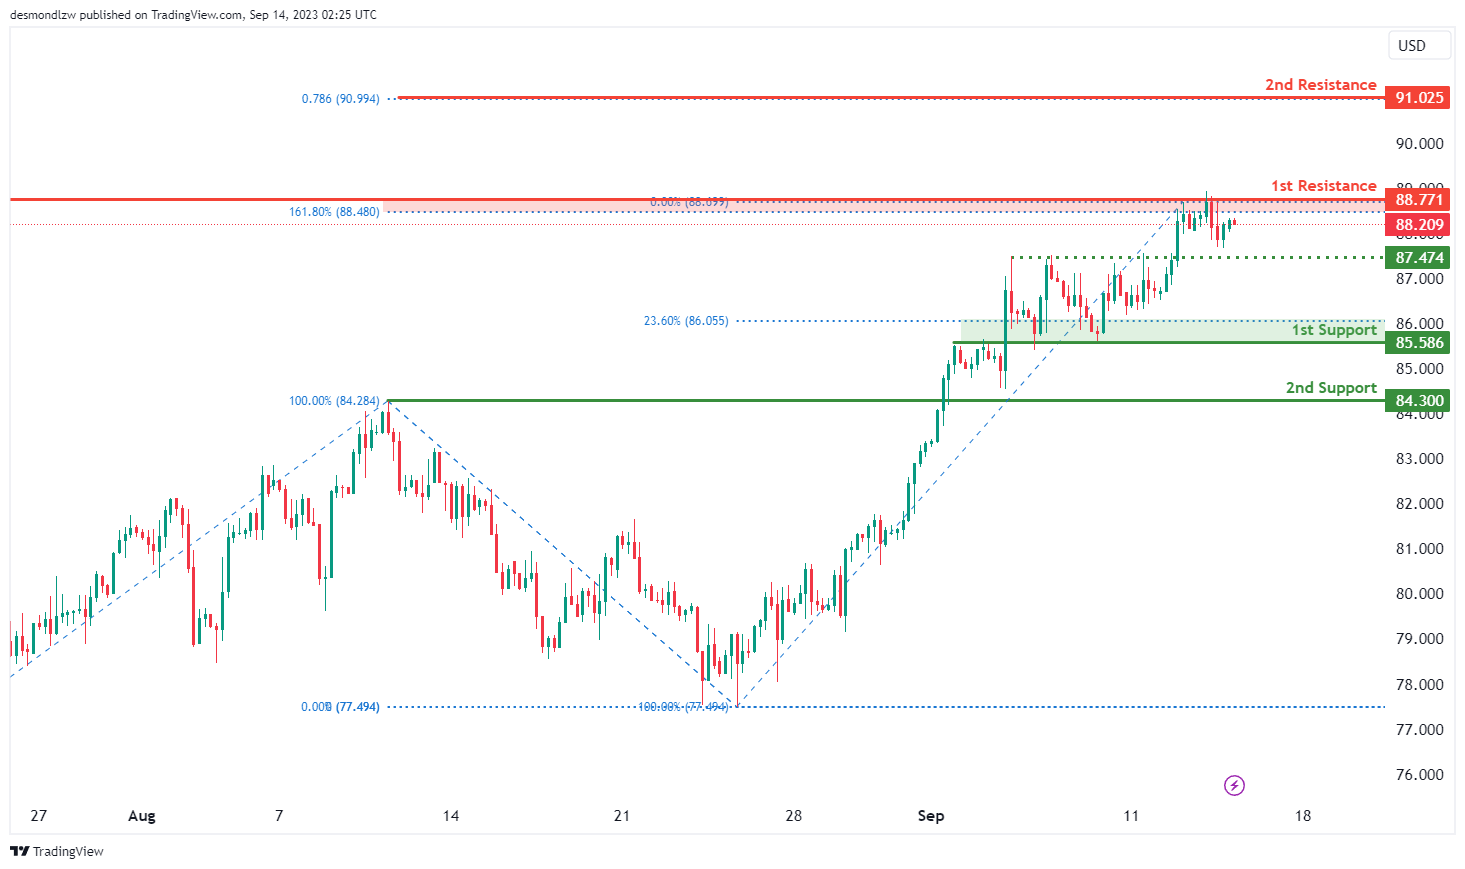
WTI/USD:
The WTI chart currently indicates a weak bullish momentum with low confidence, suggesting a tentative upward trend in price movement. There is a possibility of a bullish continuation towards the 1st resistance level.
The 1st resistance level at 88.77 is identified as an overlap resistance that aligns with the 161.80% Fibonacci extension level. Furthermore, the 2nd resistance level at 91.03 is marked as a resistance level that aligns with the 78.6% Fibonacci projection level, suggesting potential resistance in this area.
To the downside, there is an intermediate support level at 87.47, which is identified as a pullback support.
The 1st support at 85.59 is identified as an overlap support that aligns with the 23.60% Fibonacci retracement level. Additionally, the 2nd support level at 84.30 is marked as a pullback support, further reinforcing its potential role as a support level.
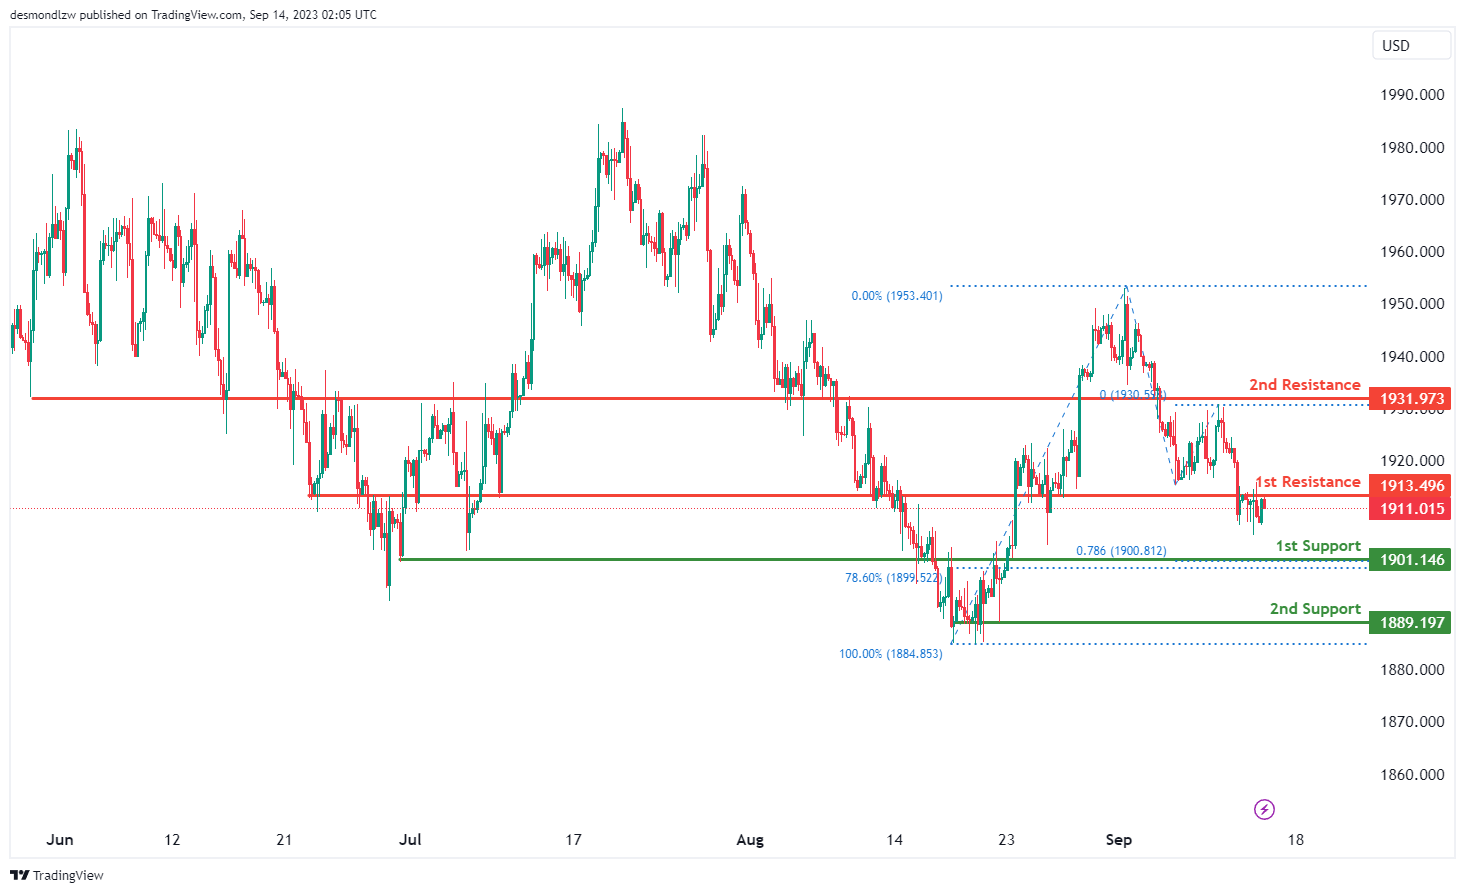
XAU/USD (GOLD):
The XAU/USD chart currently displays a bearish overall momentum, indicating a potential downward trend in price.
There’s a possibility that price may continue its bearish movement towards the 1st support level at 1901.14. This support level is considered significant as it aligns with an overlap support and coincides with both the 78.60% Fibonacci Retracement and the 78.60% Fibonacci Projection, indicating a strong potential support zone.
Additionally, the 2nd support level at 1889.19 is marked as a multi-swing low support, further reinforcing its potential role as a support level.
On the resistance side, the 1st resistance at 1913.49 is identified as an overlap resistance, and the 2nd resistance level at 1931.97 is also noted as an overlap resistance.


