
DXY:
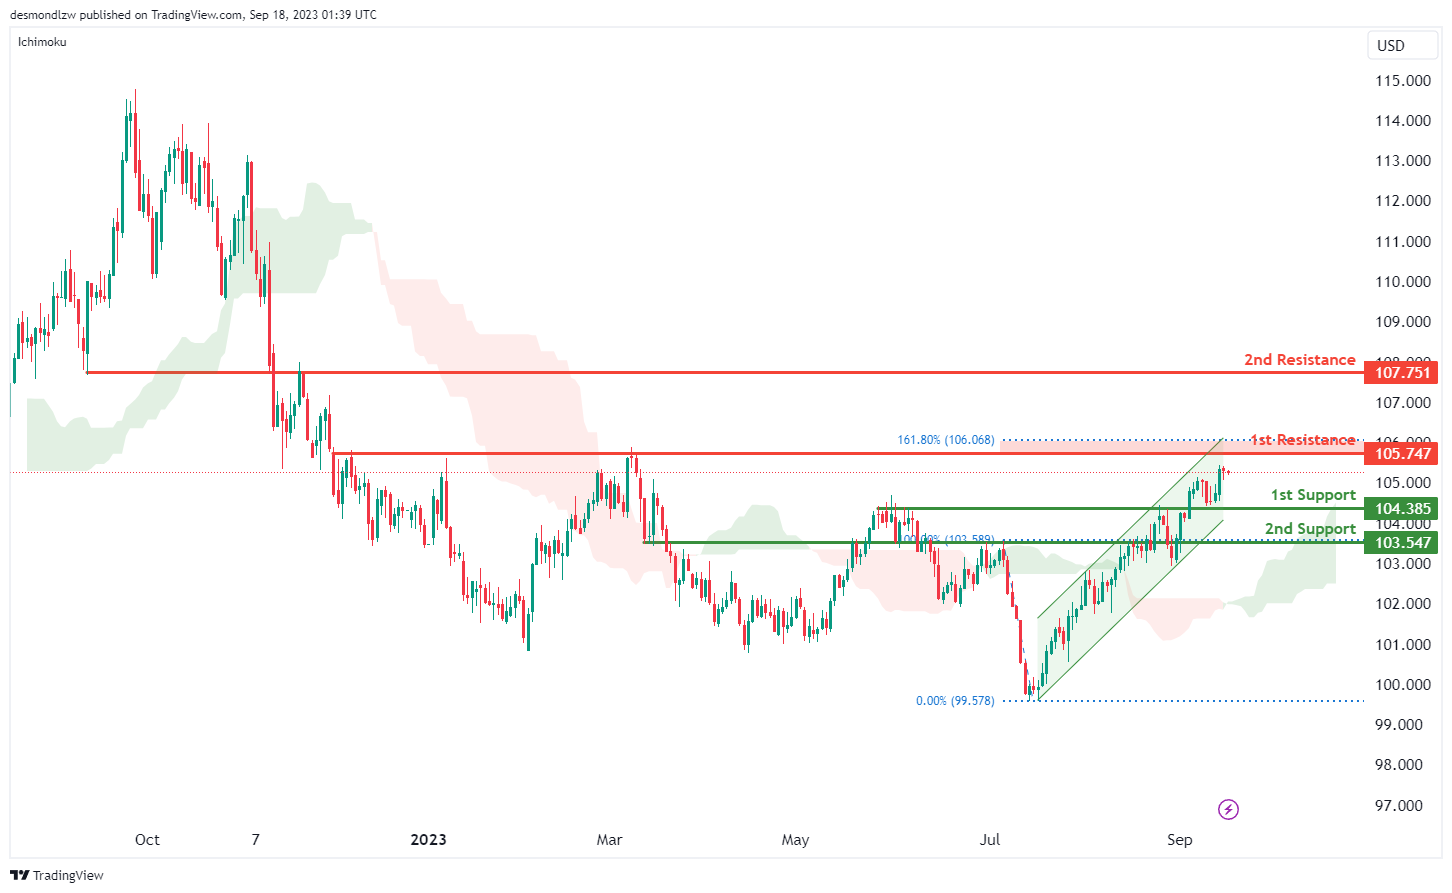
The DXY (US Dollar Index) chart is currently displaying a robust and sustained bullish momentum, with several compelling factors contributing to this positive outlook. At the core of this optimism is the DXY’s position within an ascending channel, providing a clear pathway for bullish continuation as price movements typically follow higher highs and higher lows within such channels. Understanding the critical support and resistance levels is vital when assessing potential price movements. The 1st support at 104.38 and the 2nd support at 103.54 both serve as robust safety nets, categorized as overlap supports with historical significance.
On the resistance side, the 1st resistance at 105.74 presents a formidable hurdle, noted for being a multi-swing high resistance, further bolstered by its alignment with the 161.80% Fibonacci Extension. Beyond this, the 2nd resistance at 107.75 adds another layer of challenge, classified as an overlap resistance with historical relevance. Overall, the DXY chart’s bullish momentum is unmistakable, with the ascending channel and strategically positioned support and resistance levels favoring further upward movement. However, prudent risk management is essential, as market conditions can shift rapidly.
EUR/USD:
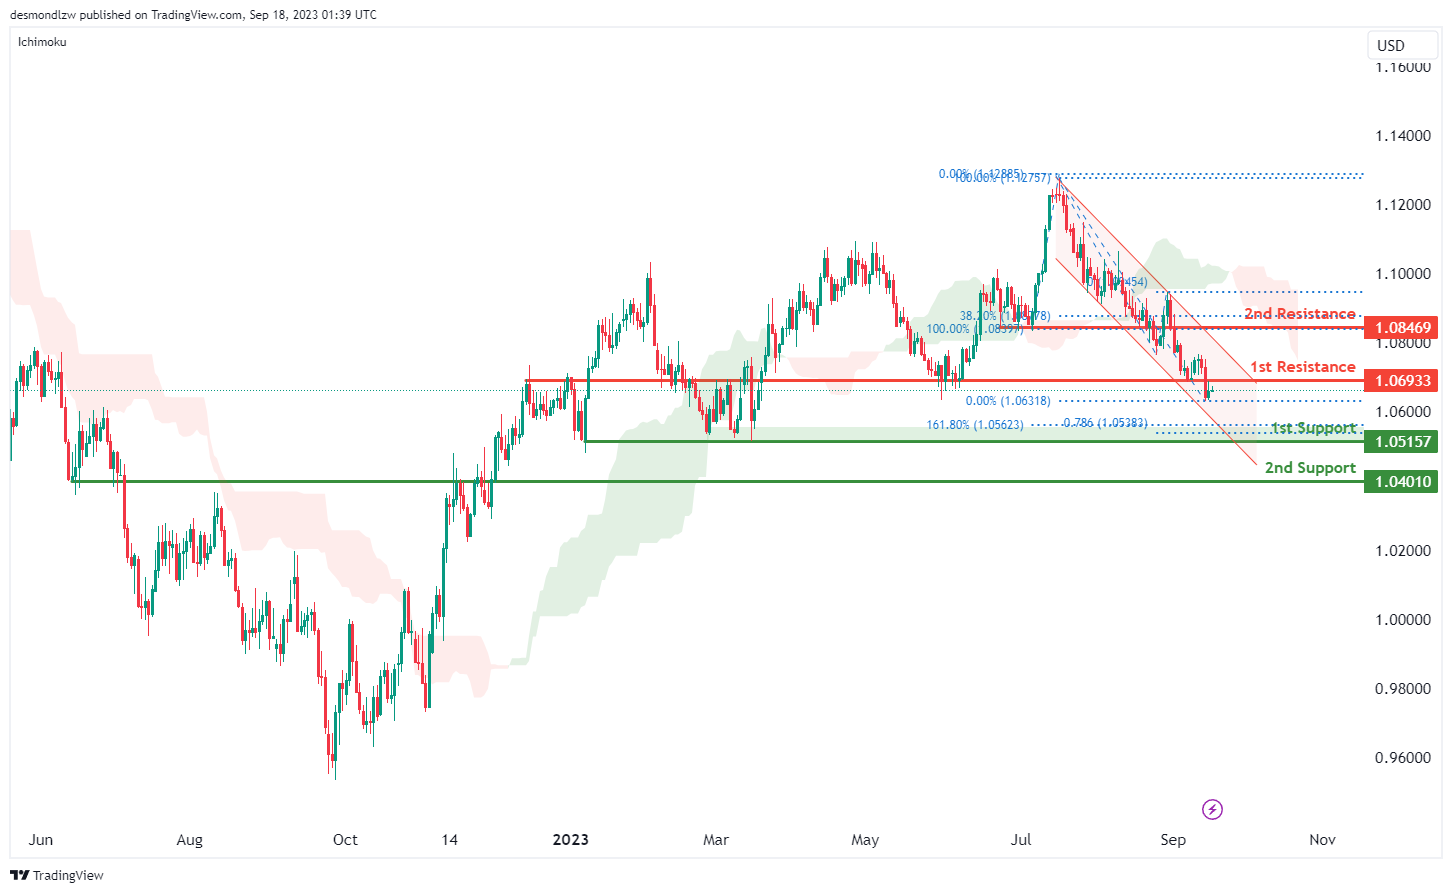
The EUR/USD chart currently reflects a sustained bearish momentum, driven by several key factors. Most notably, the price is confined within a bearish descending channel, a strong indicator of ongoing downward pressure. This suggests that the bearish momentum may persist, leading to potential further price declines.
Additionally, the chart is positioned below the bearish Ichimoku cloud, further confirming the bearish sentiment. In light of these factors, the price is likely to continue on a bearish trajectory. The anticipated movement points toward a bearish continuation, with the 1st support level at 1.0515 being a critical juncture. This support is reinforced by its classification as a multi-swing low support and its alignment with both the 161.80% Fibonacci Extension and the 78.60% Fibonacci Expansion, indicating a significant Fibonacci confluence.
Beyond the 1st support, the 2nd support at 1.0401 functions as a pullback support. On the resistance side, the 1st resistance at 1.0693 serves as a pullback resistance, while the 2nd resistance at 1.0845 is an overlap resistance, coinciding with the 38.20% Fibonacci Retracement. The overall chart momentum remains bearish.
EUR/JPY:
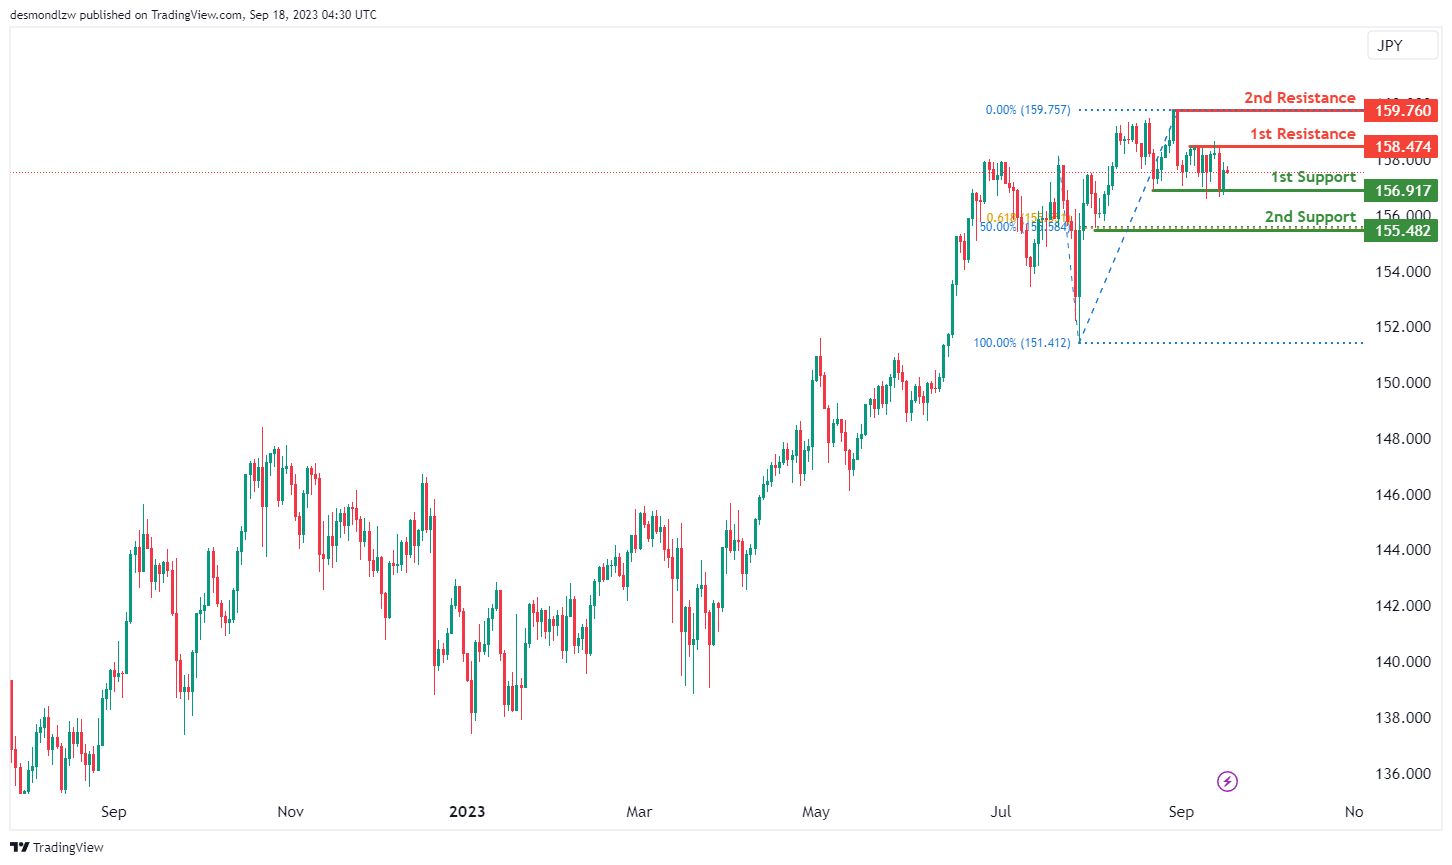
For EUR/JPY, the overall momentum of the chart is currently neutral, indicating a lack of a clear trend.
There is potential for the price to fluctuate between the 1st support level at 156.91 and the 1st resistance level at 158.47.
The 1st support at 156.91 is considered significant because it represents multi-swing low support, indicating potential stability around this level.
In case of a more significant drop, the 2nd support level at 155.48 is also noteworthy, as it represents a swing low support and aligns with both the 50% Fibonacci Retracement and the 61.80% Fibonacci Projection, indicating strong potential support and a potential area of Fibonacci confluence.
On the upper side, the 1st resistance at 158.47 is considered important due to its characteristics as multi-swing high resistance.
Further upward movement could face resistance at the 2nd resistance level of 159.76, characterized as swing high resistance. This level may act as a barrier to the bullish momentum within the observed range, keeping the overall momentum of the chart in a neutral state.
EUR/GBP:
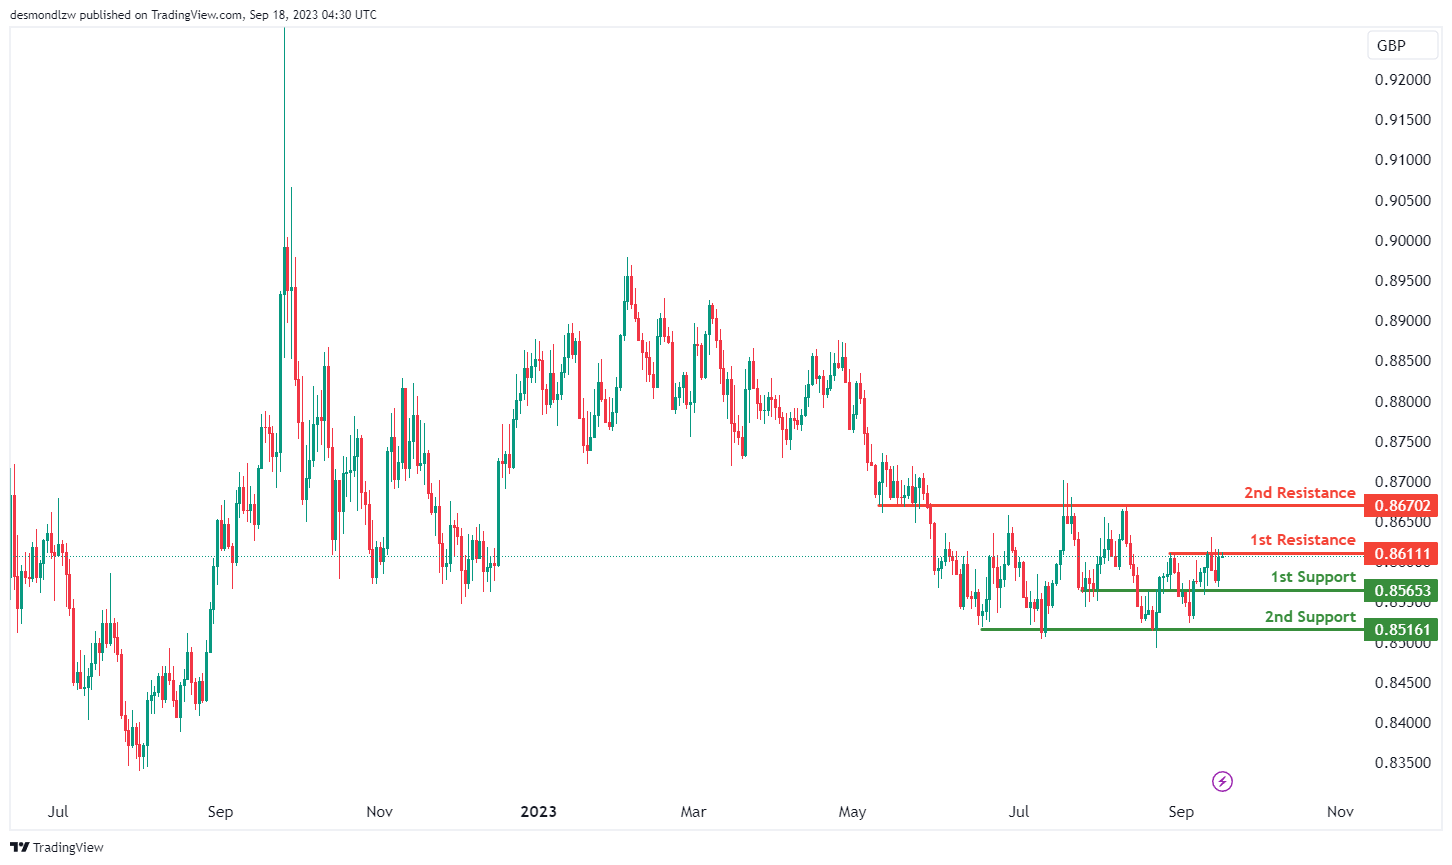
For EUR/GBP, the overall momentum of the chart is currently neutral, indicating a lack of a clear trend.
There is potential for the price to fluctuate between the 1st support level at 0.8516 and the 1st resistance level at 0.8611.
The 1st support at 0.8516 is considered significant because it represents multi-swing low support, indicating potential stability around this level.
In case of a more significant drop, the 2nd support level at 0.8565 is also noteworthy as it represents an overlap support, suggesting further potential support in this area.
On the upper side, the 1st resistance at 0.8611 is considered important due to its characteristics as multi-swing high resistance.
Further upward movement could face resistance at the 2nd resistance level of 0.8670, characterized as an overlap resistance. This level may act as a barrier to the bullish momentum within the observed range, keeping the overall momentum of the chart in a neutral state with potential price fluctuations between the identified support and resistance levels.
GBP/USD:
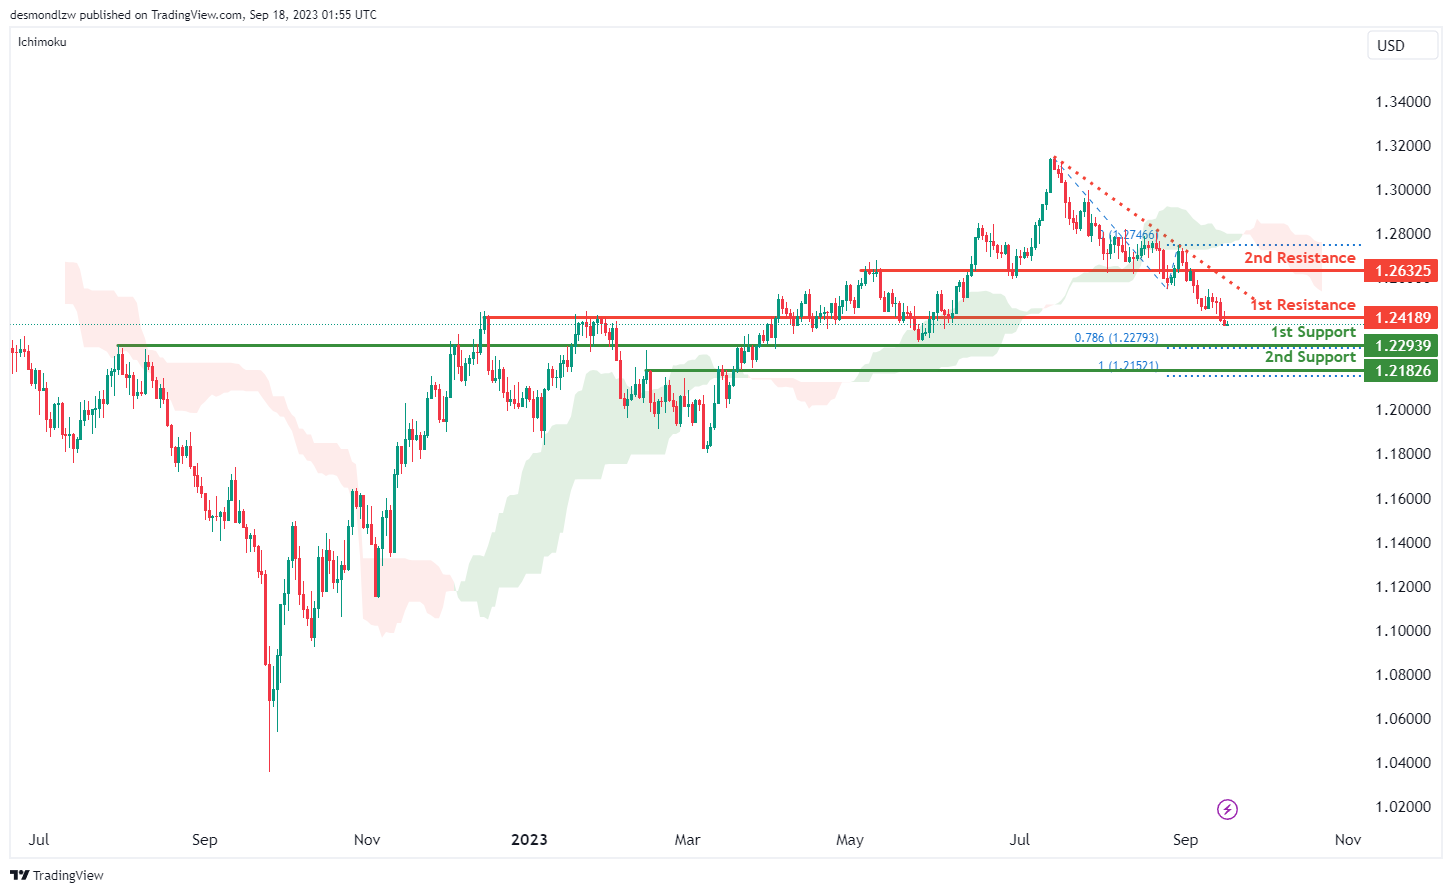
The GBP/USD chart maintains a persistent bearish momentum, influenced by critical factors contributing to its downward trajectory. Most notably, the price currently resides below the bearish Ichimoku cloud, signifying a dominant bearish sentiment. Furthermore, the chart exhibits a significant bearish bias by remaining beneath a major descending trend line, reinforcing expectations of continued downward pressure. Given these compelling indicators, the price is likely to pursue a bearish continuation, with the 1st support level at 1.2293 serving as a pivotal point. This support level holds significance as it is classified as an overlap support, further strengthened by the presence of the 78.60% Fibonacci Projection. Beyond the 1st support, the 2nd support at 1.2182 is identified as a swing low support, aligning with the 100% Fibonacci Projection.
On the resistance side, the 1st resistance at 1.2418 functions as a pullback resistance, while the 2nd resistance at 1.2632 is characterized as an overlap resistance
GBP/JPY:
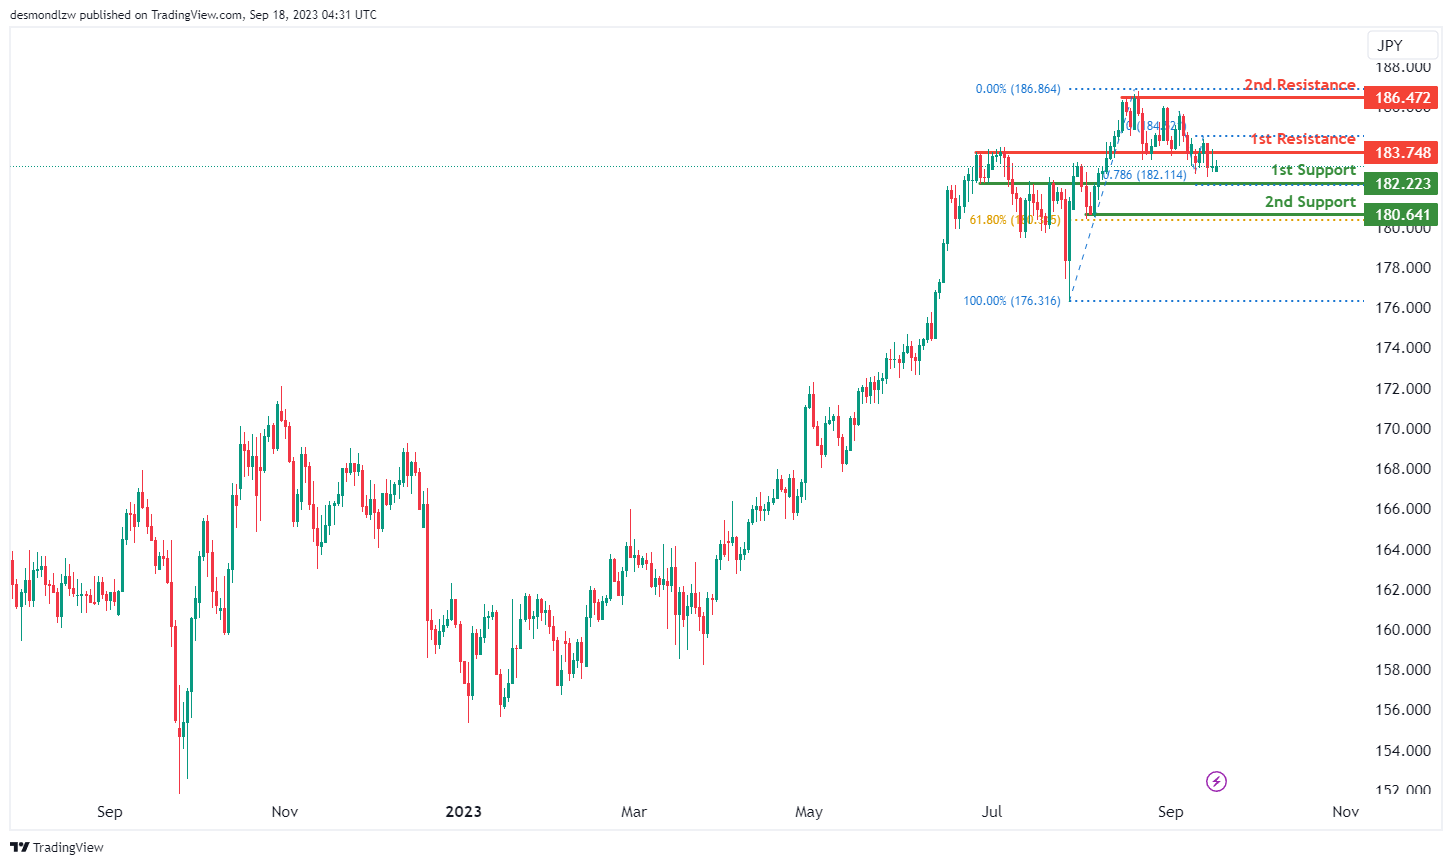
For GBP/JPY, the overall momentum of the chart is currently bullish, indicating an upward trend.
There is potential for the price to make a bullish move by bouncing off the 1st support level at 182.22 and heading towards the 1st resistance level at 183.74.
The 1st support at 182.22 is considered significant because it represents pullback support and aligns with the 78.60% Fibonacci Projection, indicating strong potential support and a potential area of Fibonacci confluence.
In case of a more significant pullback, the 2nd support level at 180.64 is also noteworthy as it represents a swing low support and aligns with the 61.80% Fibonacci Retracement, suggesting further potential support in this area.
On the upper side, the 1st resistance at 183.74 is considered important due to its characteristics as an overlap resistance.
Further upward movement could face resistance at the 2nd resistance level of 186.47, characterized as multi-swing high resistance. This level may act as a barrier to the bullish momentum within the observed range, but the overall chart momentum remains bullish with the potential for a bounce off the identified support level and a move towards resistance.
USD/CHF:
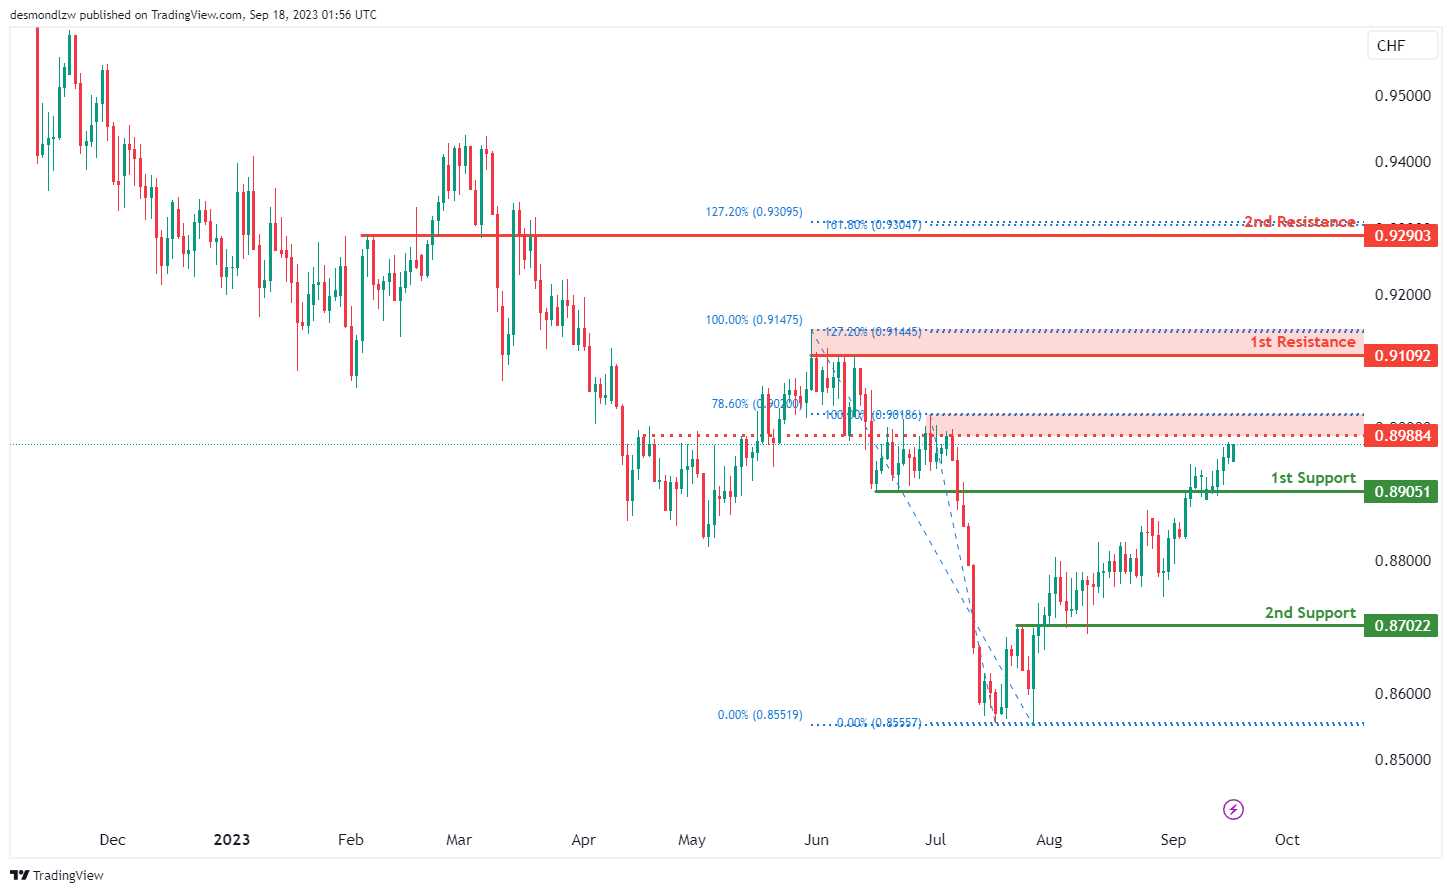
The USD/CHF chart currently demonstrates a strong bullish momentum, underpinned by several key factors that contribute to its favorable outlook. Notably, the price has been exhibiting resilience, and there’s a compelling scenario where this bullish trend could continue towards the 1st resistance level at 0.9109. This resistance level is particularly significant as it’s identified as a multi-swing high resistance and is reinforced by the presence of the 127.20% Fibonacci Extension, accentuating its importance. Beyond the 1st resistance, the 2nd resistance at 0.9290 is categorized as an overlap resistance, further underlining its relevance, particularly due to its alignment with the 161.80% Fibonacci Extension.
An intermediate resistance level at 0.8988 also comes into play, marked as an overlap resistance and coinciding with the 78.60% Fibonacci Retracement.
On the support side, the 1st support at 0.8905 is a critical level. It is classified as an overlap support, emphasizing its historical significance as a potential strong support zone. Similarly, the 2nd support at 0.8702 is recognized as an overlap support, reinforcing its importance as a key support zone. With the current bullish momentum in place,
USD/JPY:
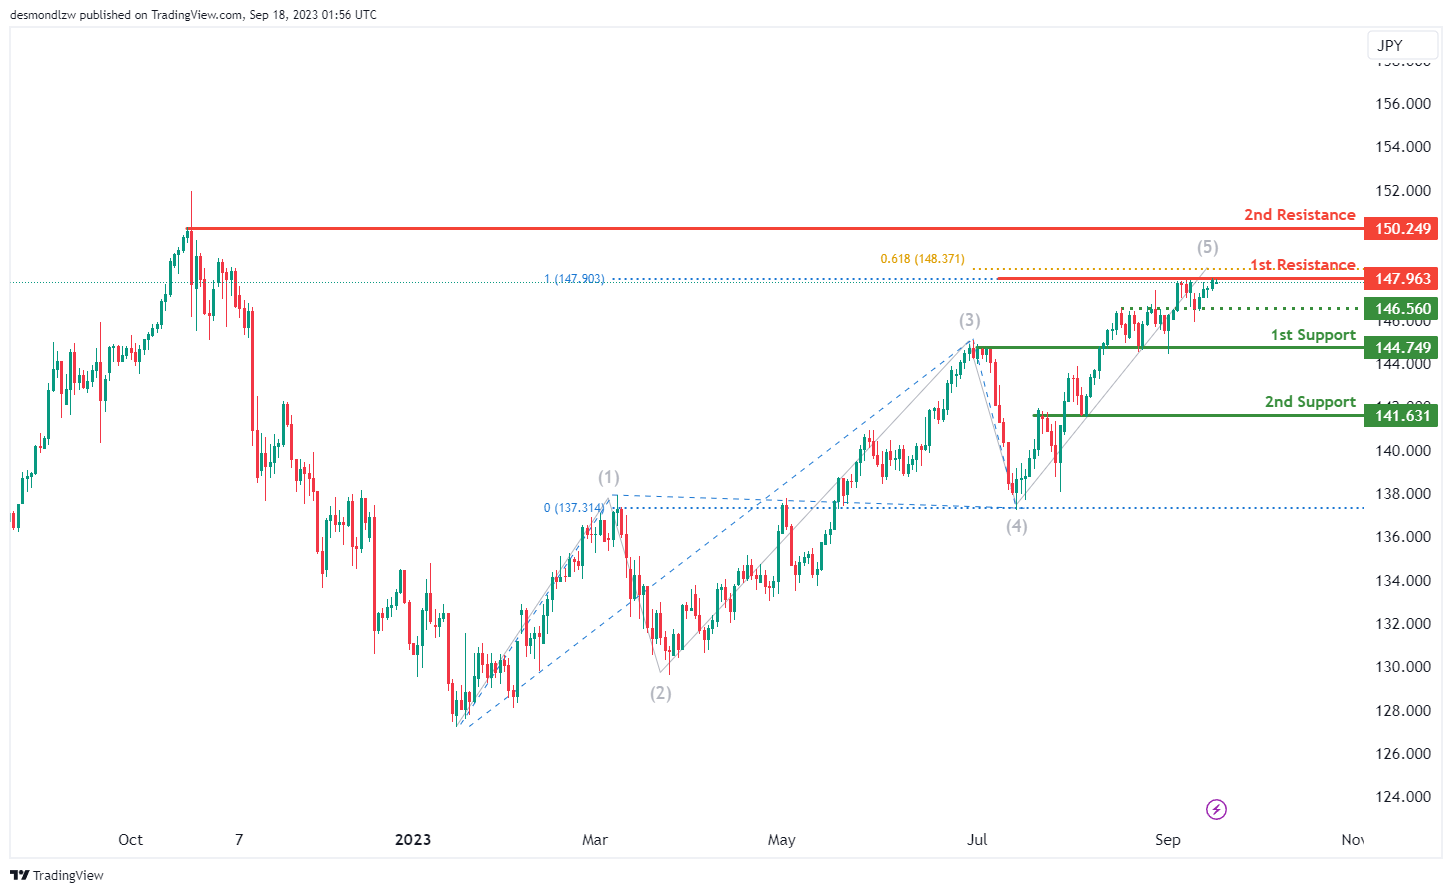
The USD/JPY chart currently exhibits a prevailing bearish momentum, marked by several key indicators that contribute to this downward trend. In this context, there’s a plausible scenario where the price may encounter a bearish reaction upon reaching the 1st resistance level at 147.96, subsequently retracing towards the 1st support at 144.74. The 1st support is of notable importance, classified as an overlap support, signifying its historical relevance as a potential strong support zone. Similarly, the 2nd support at 141.63 is identified as an overlap support, further accentuating its significance as a key support level.
On the resistance side, the 1st resistance level at 147.96 plays a pivotal role as a multi-swing high resistance, and it aligns with the presence of the 61.80% Fibonacci Projection, amplifying its importance as a potential barrier for further upward movement.
Beyond the 1st resistance, the 2nd resistance at 150.24 is categorized as a swing high resistance, underlining its role as a potential point of resistance. With the chart’s overall bearish momentum,
USD/CAD:
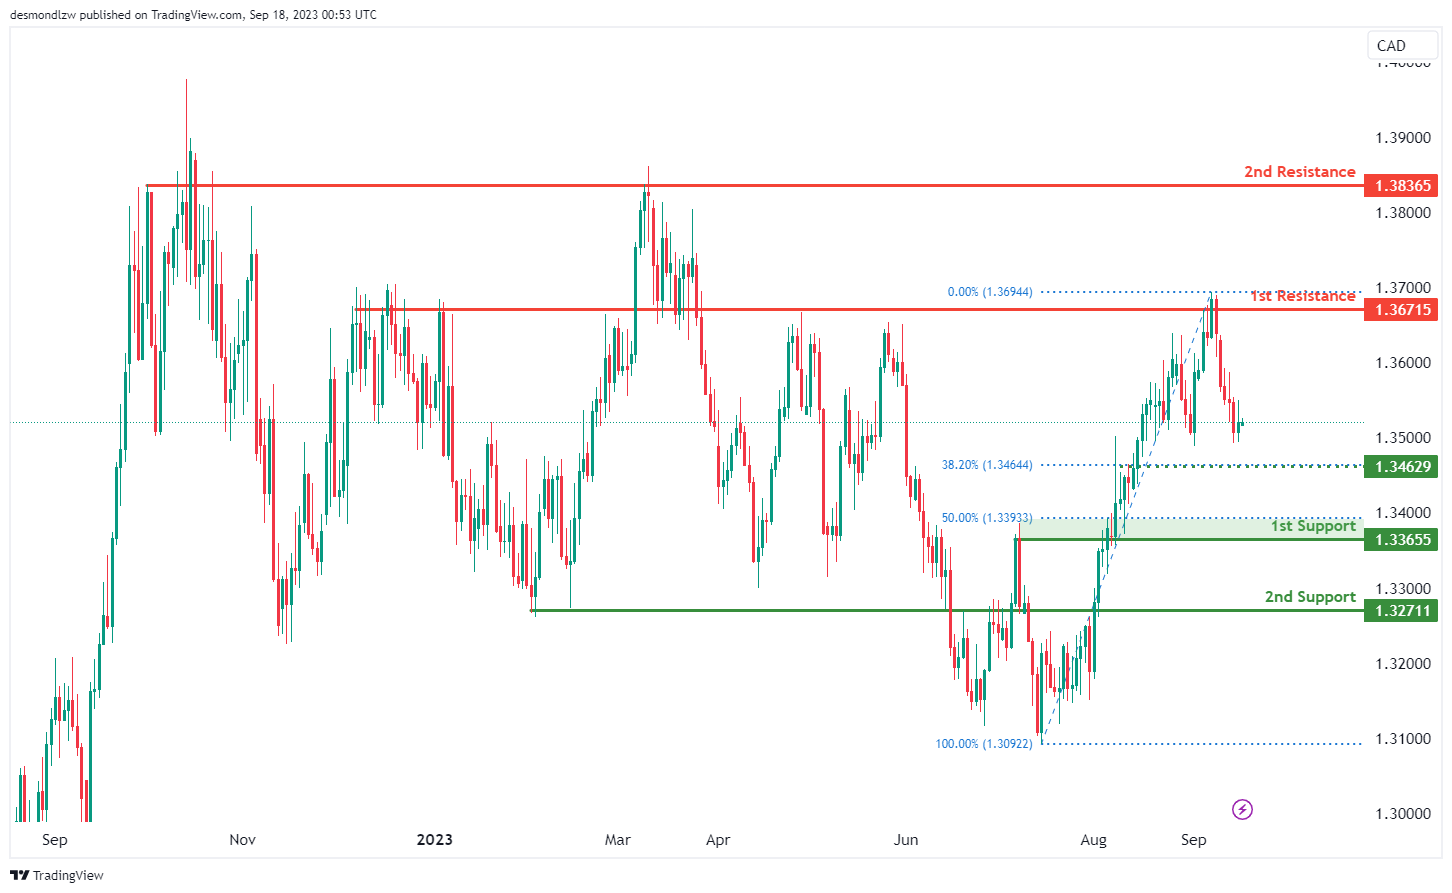
The USD/CAD chart currently shows an overall neutral momentum, suggesting a lack of a clear directional bias. Under this scenario, price could potentially fluctuate within a range defined by the 1st support and 1st resistance levels.
The 1st resistance level at 1.3672 is identified as an overlap resistance while the 2nd resistance level at 1.3837 is also marked as another overlap resistance that has a history of capping price increases.
To the downside, an intermediate support level at 1.3463 is marked as a pullback support that coincides with the 38.20% Fibonacci retracement level while the 1st support level at 1.3366 is marked as an overlap support that aligns with the 50.00% Fibonacci retracement level.
In addition, the 2nd support level at 1.3271 is also identified as an overlap support, further reinforcing its potential role as a support level.
AUD/USD:
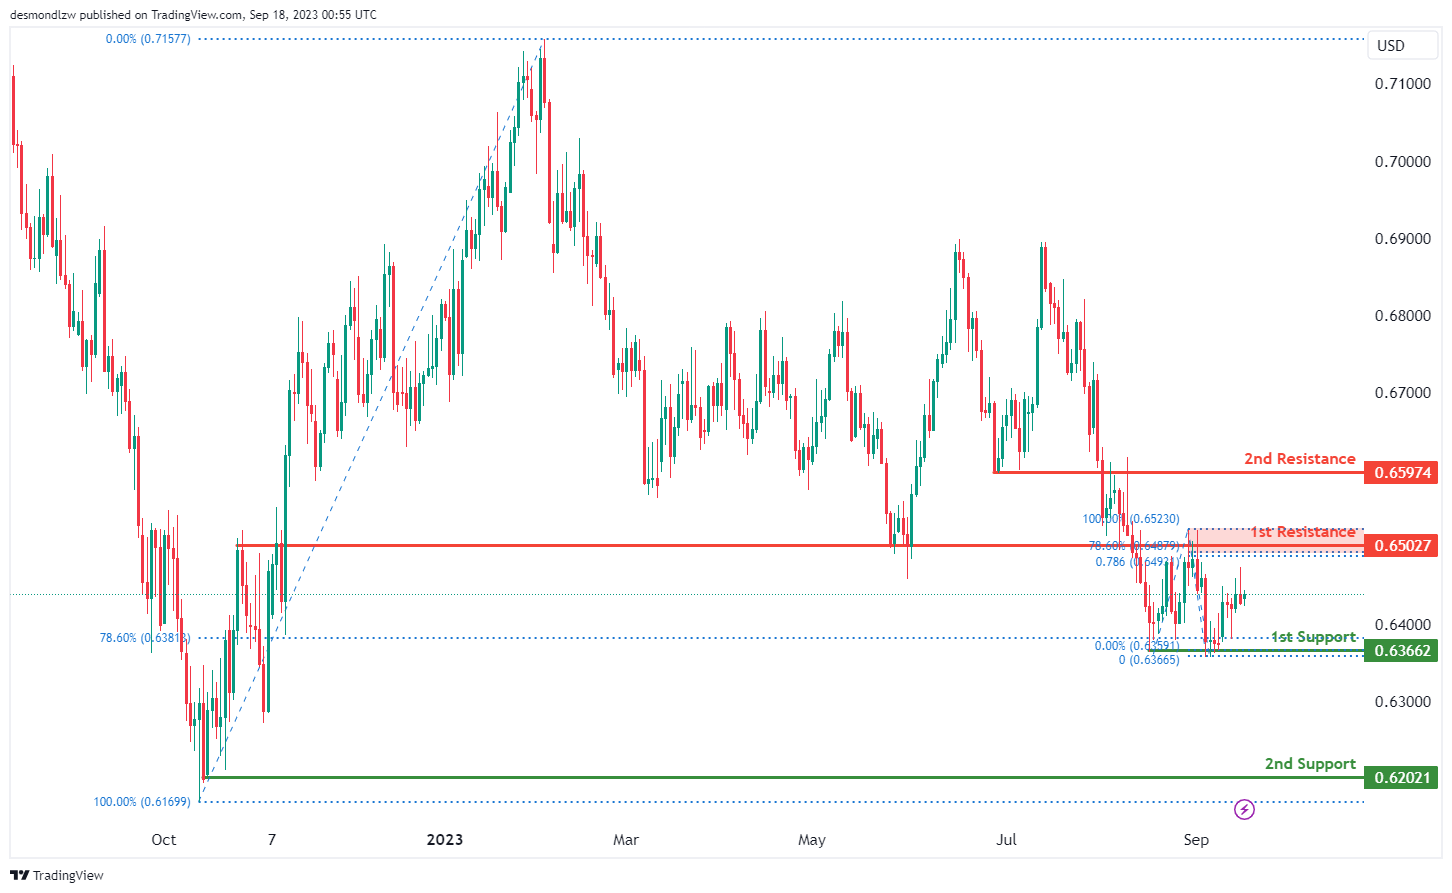
The AUD/USD chart currently presents an overall neutral momentum, suggesting that there’s no clear directional bias at the moment. In such situations, price could move within a defined range that is identified by the 1st support and the 1st resistance levels.
The 1st support at 0.6366 is identified as a pullback support that aligns with the 78.60% Fibonacci retracement level. Further below, 2nd support level at 0.6202 is marked as a swing-low support, making it a noteworthy level to monitor for potential reversals.
To the upside, the 1st resistance level at 0.6503 is marked as an overlap resistance that aligns with a confluence of Fibonacci levels i.e. the 78.60% retracement and the 78.60% projection levels, forming a robust technical zone of resistance.
In addition, the 2nd resistance level at 0.6597 is also identified as an overlap resistance level, which could potentially halt further upward movements in price.
NZD/USD
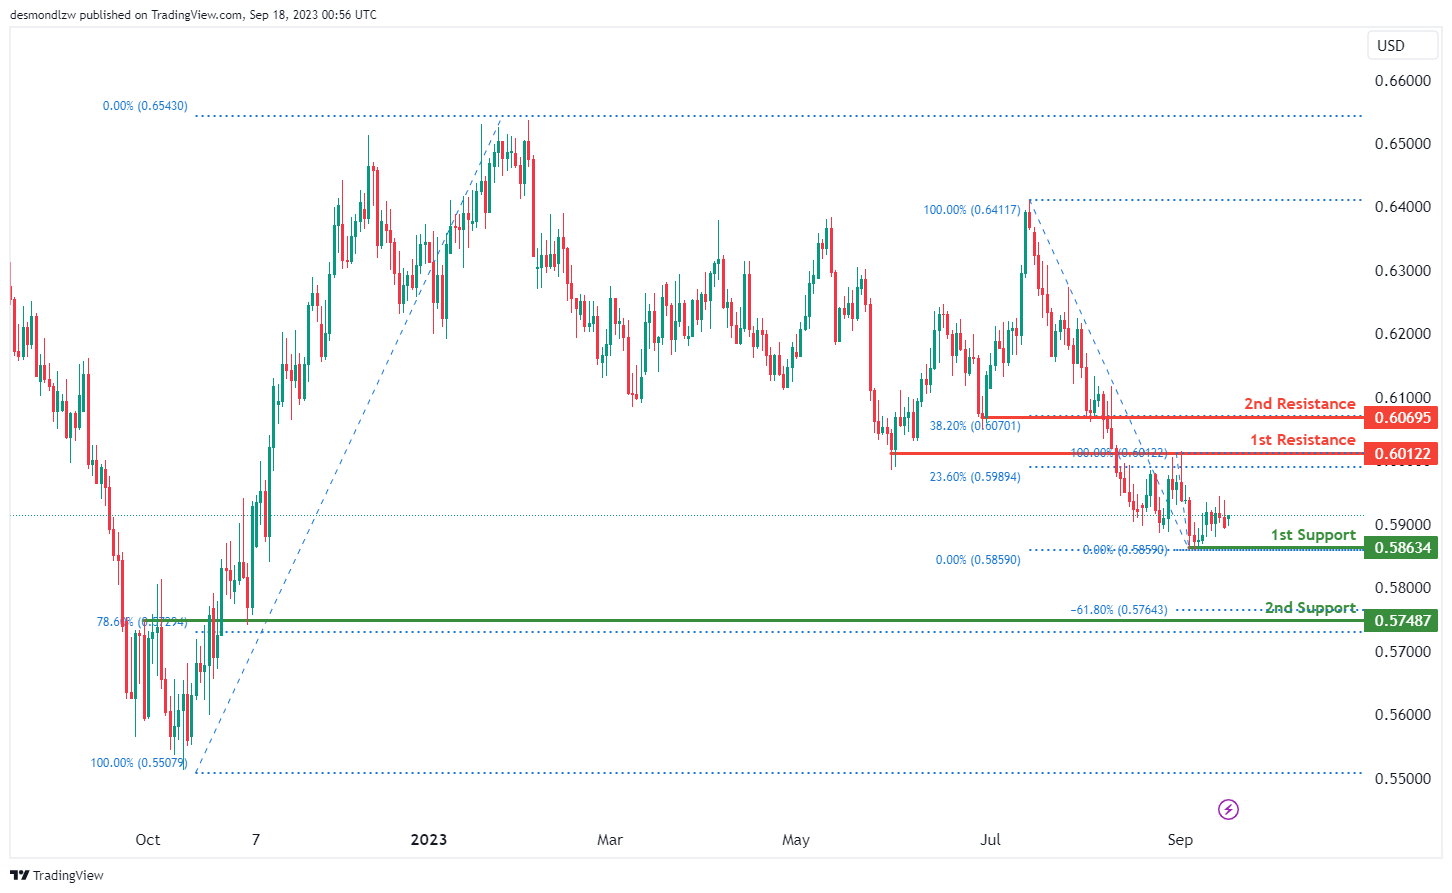
The NZD/USD chart currently exhibits an overall neutral momentum, indicating a lack of a strong directional bias. In such situations, price movements could fluctuate within a range that is defined by the 1st support and the 1st resistance levels.
The 1st support level at 0.5863 is identified as a pullback support. Further below, the 2nd support level at 0.5749 is marked as an overlap support that aligns with a confluence of Fibonacci levels i.e. the 78.60% retracement and the -61.8% expansion levels, strengthening its significance as a potential support zone.
To the upside, the 1st resistance level at 0.6012 is identified as an overlap resistance that coincides with the 23.60% Fibonacci retracement level. Additionally, the 2nd resistance level at 0.6069 is marked as a pullback resistance that aligns with the 38.20% Fibonacci retracement level, reinforcing its role as a potential resistance area.
DJ30:
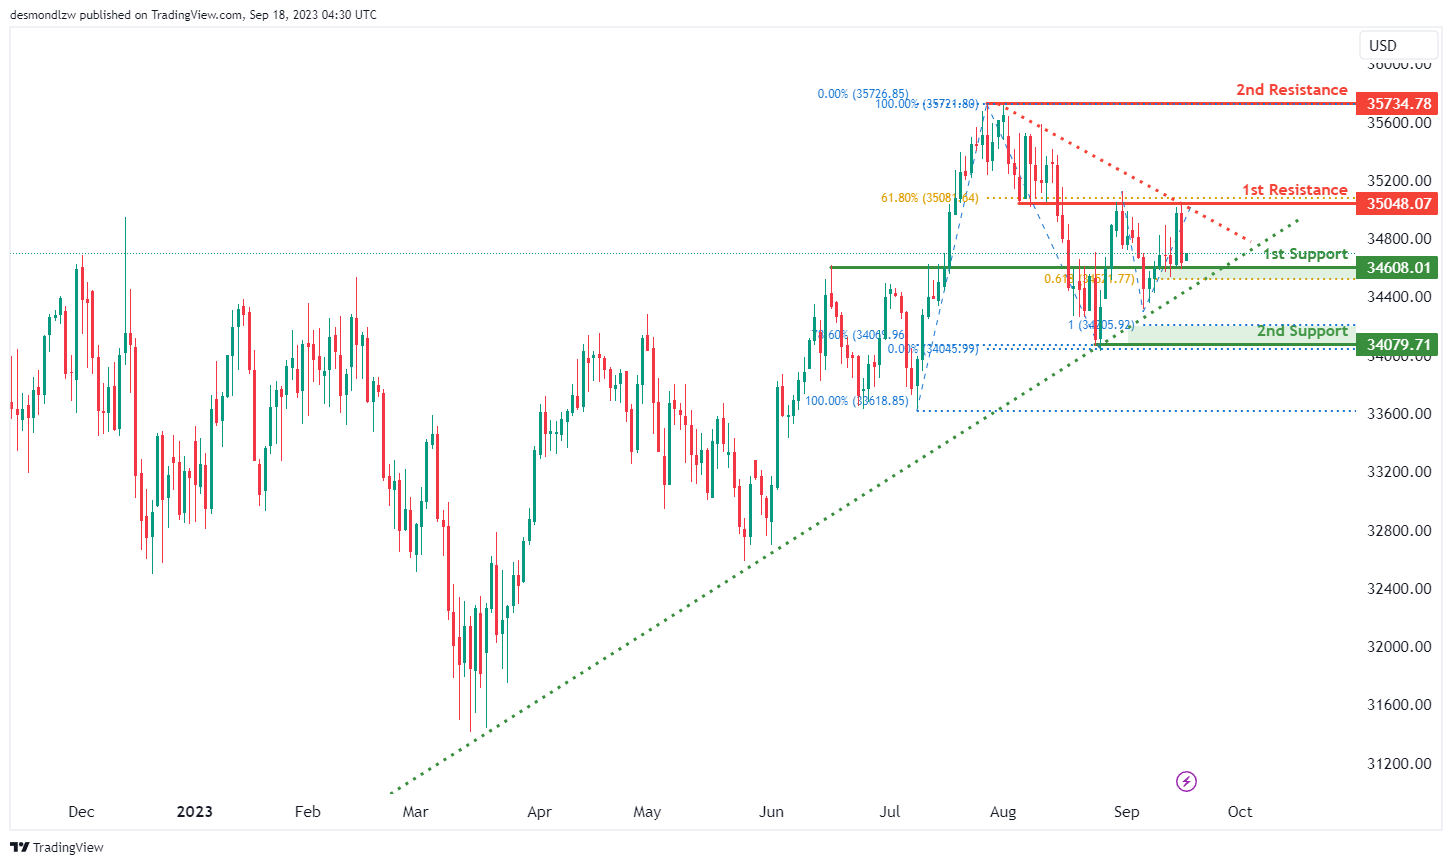
For DJ30, the overall momentum of the chart is currently bullish, indicating an upward trend.
There is potential for the price to continue its bullish movement towards the 1st resistance level at 35048.07.
The 1st support at 34608.01 is considered significant because it represents an overlap support and aligns with the 61.80% Fibonacci Projection.
In case of a more substantial pullback, the 2nd support level at 34079.71 is also noteworthy, representing a swing low support. It aligns with both the 78.60% Fibonacci Retracement and the 100% Fibonacci Projection, indicating strong potential support and a potential area of Fibonacci confluence.
On the upper side, the 1st resistance at 35048.07 is considered important due to its characteristics as an overlap resistance and its alignment with the 61.80% Fibonacci Retracement.
Further upward movement could face resistance at the 2nd resistance level of 35734.78, characterized as a swing high resistance, potentially acting as a barrier to the bullish momentum within the observed range.
GER30:
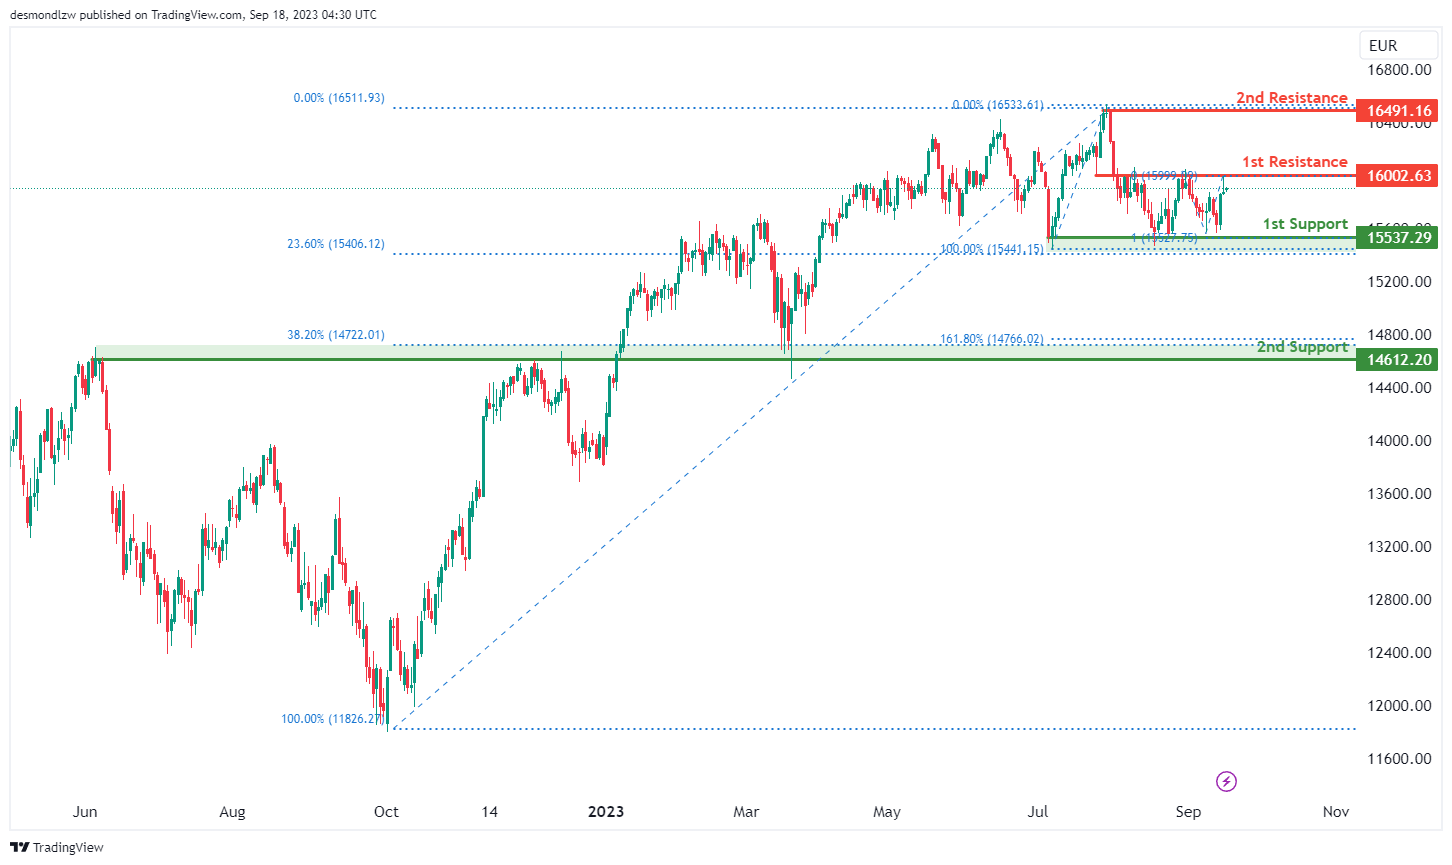
For GER30, the overall momentum of the chart is currently bearish, indicating a downward trend.
There is potential for the price to have a bearish reaction off the 1st resistance level at 16002.63 and drop to the 1st support at 15537.29.
The 1st support at 15537.29 is considered significant because it represents multi-swing low support and aligns with both the 23.60% Fibonacci Retracement and the 100% Fibonacci Projection, indicating strong potential support and a potential area of Fibonacci confluence.
In case of a more substantial decline, the 2nd support level at 14612.20 is also noteworthy, as it represents an overlap support. It aligns with the 38.20% Fibonacci Retracement and the 161.80% Fibonacci Extension, indicating strong Fibonacci confluence and potential stability at this level.
On the upper side, the 1st resistance at 16002.63 is considered important due to its characteristics as an overlap resistance.
Further upward movement could face resistance at the 2nd resistance level of 16491.16, characterized as swing high resistance. This level may act as a barrier to the bullish momentum within the observed range.
US500
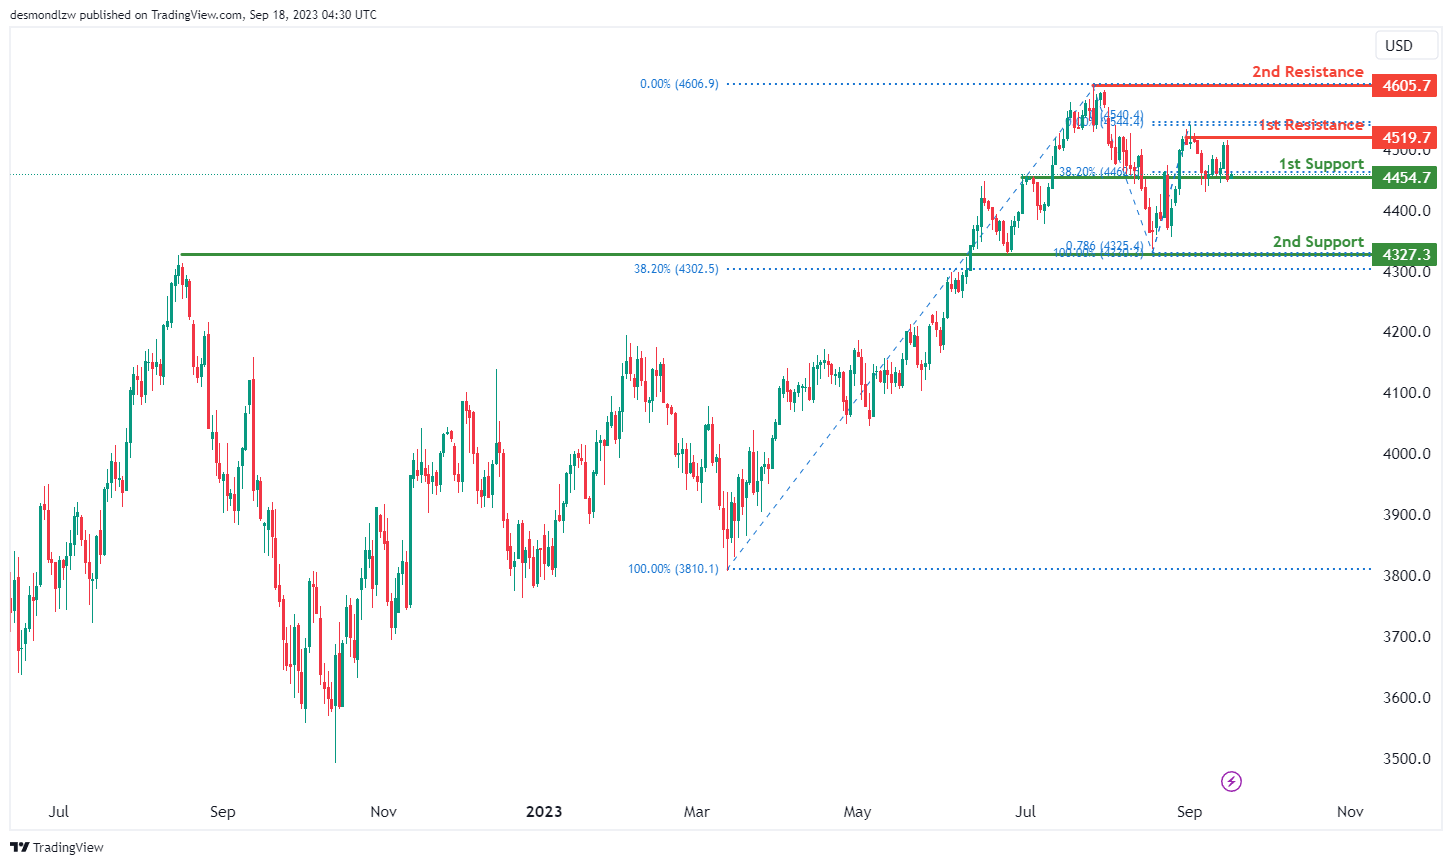
For US500, the overall momentum of the chart is currently bullish, indicating an upward trend.
There is potential for the price to make a bullish bounce off the 1st support level at 4454.7 and head towards the 1st resistance at 4519.7.
The 1st support at 4454.7 is considered significant because it represents a pullback support and aligns with the 38.20% Fibonacci Retracement.
In case of a more substantial pullback, the 2nd support level at 4327.3 is also noteworthy, representing an overlap support. It aligns with both the 38.20% Fibonacci Retracement and the 78.60% Fibonacci Projection, indicating strong potential support and a potential area of Fibonacci confluence.
On the upper side, the 1st resistance at 4519.7 is considered important due to its characteristics as multi-swing high resistance.
Further upward movement could face resistance at the 2nd resistance level of 4605.7, characterized as swing high resistance. This level may act as a barrier to the bullish momentum within the observed range.
BTC/USD:
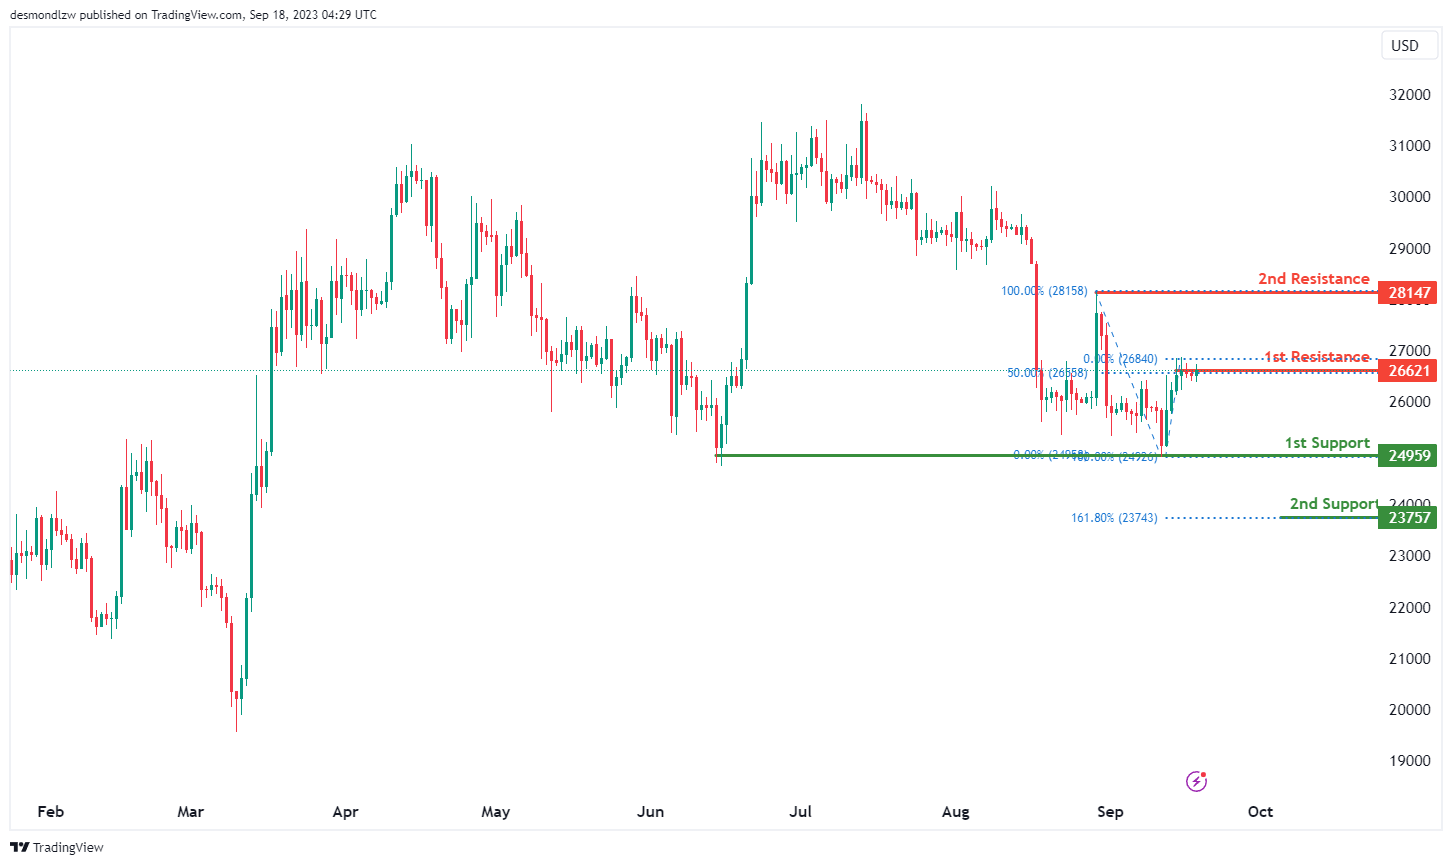
For BTC/USD, the overall momentum of the chart is currently bearish, indicating a downward trend.
There is potential for the price to have a bearish reaction off the 1st resistance level at 26621 and drop to the 1st support at 24959.
The 1st support at 24959 is considered significant because it represents multi-swing low support, suggesting potential stability and support at this level.
In case of a more substantial decline, the 2nd support level at 23757 is also noteworthy, as it represents the 161.80% Fibonacci Extension, providing additional support for this level.
On the upper side, the 1st resistance at 26621 is considered important due to its characteristics as swing high resistance and its alignment with the 50% Fibonacci Retracement level.
Further upward movement could face resistance at the 2nd resistance level of 28147, characterized as swing high resistance, potentially posing a significant barrier to the bullish momentum within the observed range.
ETH/USD:
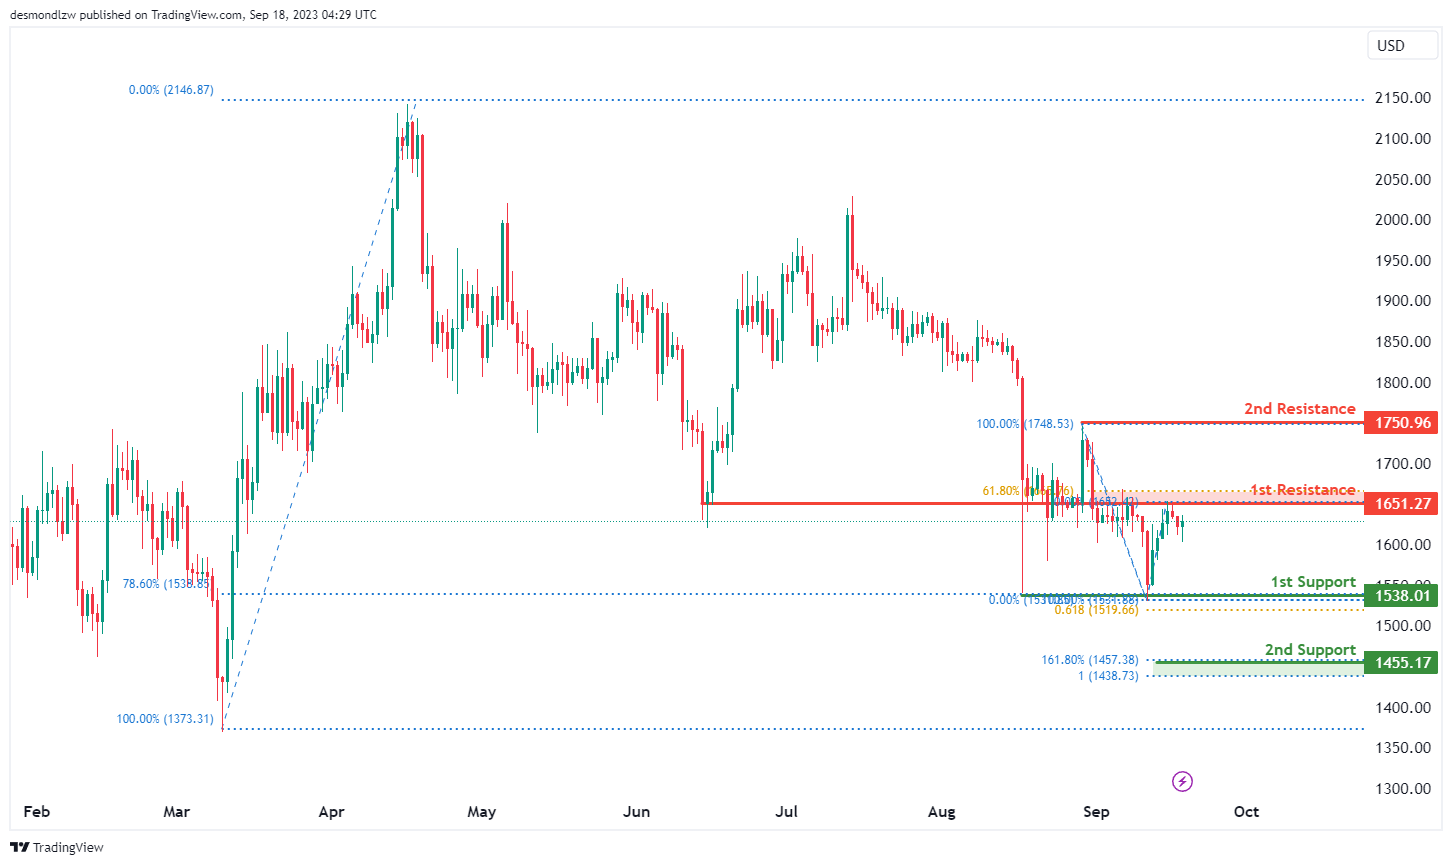
For ETH/USD, the overall momentum of the chart is currently bearish, indicating a downward trend.
There is potential for the price to have a bearish reaction off the 1st resistance level at 1651.27 and drop to the 1st support at 1538.01.
The 1st support at 1538.01 is considered significant because it represents multi-swing low support and aligns with both the 61.80% Fibonacci Projection and the 78.60% Fibonacci Retracement, indicating strong potential support at this level.
In case of a more substantial decline, the 2nd support level at 1455.17 is also noteworthy, as it represents the 161.80% Fibonacci Extension and the 100% Fibonacci Projection, indicating strong Fibonacci confluence and potential stability at this level.
On the upper side, the 1st resistance at 1651.27 is considered important due to its characteristics as an overlap resistance and its alignment with the 61.80% Fibonacci Retracement.
Further upward movement could face resistance at the 2nd resistance level of 1750.96, characterized as swing high resistance.
WTI/USD:
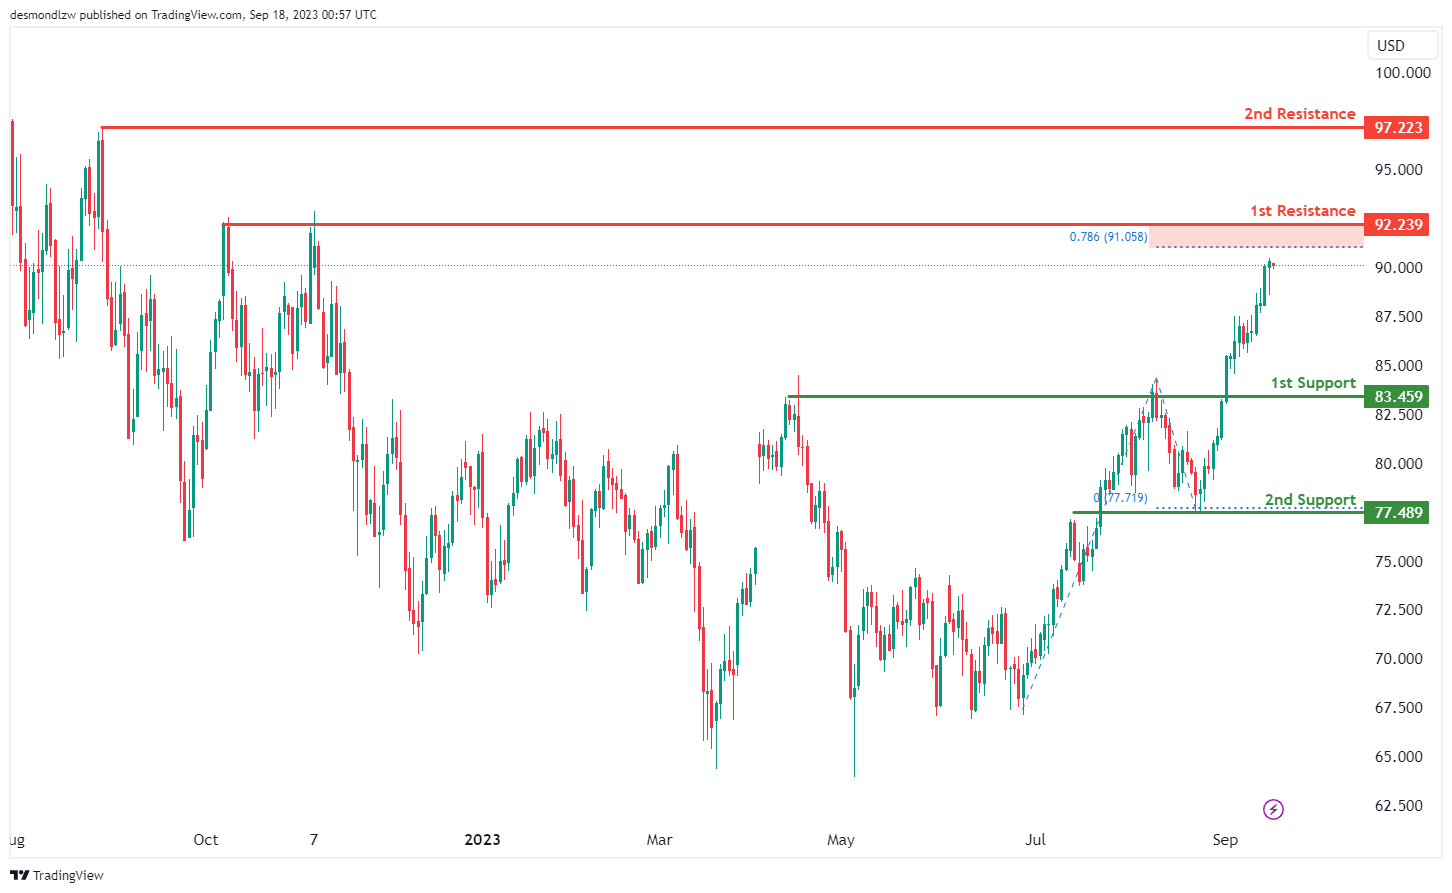
The WTI (West Texas Intermediate) chart currently indicates an overall bullish momentum, suggesting the potential for an upward price trend towards the 1st resistance level.
The 1st resistance level at 92.24 is identified as a multi-swing-high resistance that aligns with the 78.60% Fibonacci projection level.Further up, the 2nd resistance level at 97.22 is marked as swing-high resistance, which could potentially halt further upward movement in price.
To the downside, the 1st support level at 83.46 is identified as a pullback support while the 2nd support level at 77.49 is marked as an overlap support, indicating that it has previously acted as a strong barrier against price declines.
XAU/USD (GOLD):
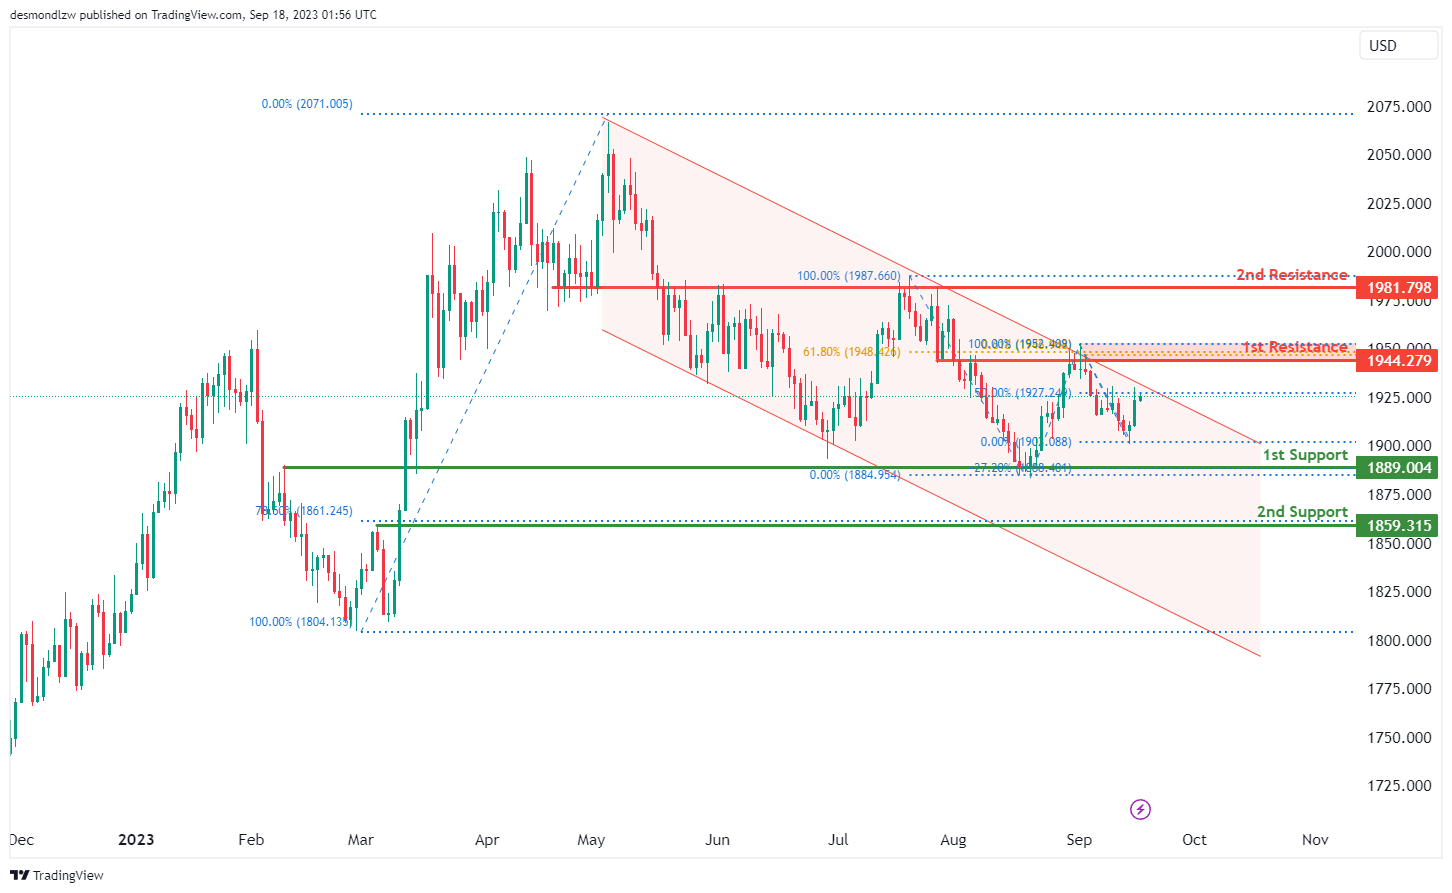
The XAU/USD chart currently demonstrates a prevailing bearish momentum, influenced by key factors contributing to its downward trajectory. Notably, the price is confined within a bearish descending channel, reinforcing the overall bearish sentiment and indicating the potential for further downward movement. In this context, there is a plausible scenario where the price may experience a bearish reaction upon reaching the 1st resistance level at 1944.27, followed by a potential retracement towards the 1st support at 1889.00. The 1st support level is of notable significance, classified as an overlap support, and it also aligns with the presence of the -27% Fibonacci Expansion, highlighting its potential as a strong support zone. Similarly, the 2nd support at 1859.31 is identified as a pullback support, coinciding with the 78.60% Fibonacci Retracement, further underlining its role as a key support level.
On the resistance side, the 1st resistance level at 1944.27 assumes a pivotal role as an overlap resistance, and it’s reinforced by the presence of both the 61.80% Fibonacci Retracement and the 61.80% Fibonacci Projection, indicating a significant Fibonacci confluence and adding weight to its potential as a resistance barrier. Beyond the 1st resistance, the 2nd resistance at 1081.79 is categorized as an overlap resistance. With the chart’s overall bearish momentum.


