
DXY:
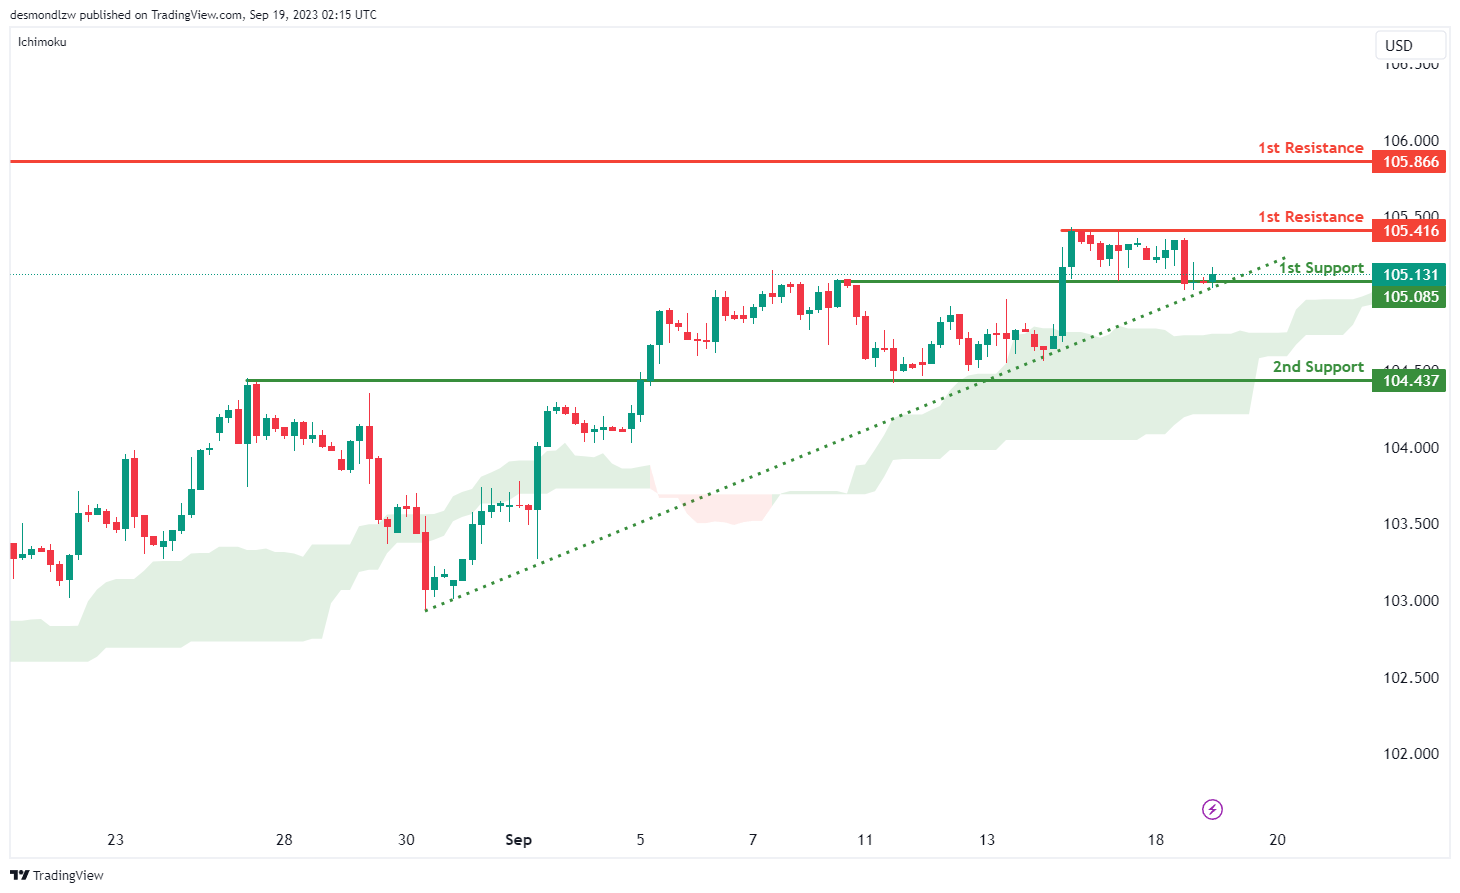
The DXY (US Dollar Index) chart currently demonstrates a robust bullish momentum, buoyed by several key factors that contribute to its upward trajectory. Notably, the price maintains its position above a significant ascending trend line, signaling the potential for further bullish momentum and reinforcing the overall positive sentiment.
Additionally, the chart has recently crossed above the Ichimoku cloud, further confirming the bullish outlook. Within this context, there is a plausible scenario where the price may experience a bullish bounce upon reaching the 1st support level at 105.13, subsequently moving towards the 1st resistance at 105.41. The 1st support level holds substantial significance, classified as an overlap support, indicating its historical relevance as a potential strong support zone. Similarly, the 2nd support at 104.43 is also identified as an overlap support, underlining its role as a key support level.
On the resistance side, the 1st resistance at 105.41 assumes a pivotal role as a multi-swing high resistance, signifying its importance as a potential barrier for further upward movements. Beyond the 1st resistance, the 2nd resistance at 105.87 is categorized as a swing high resistance, highlighting its potential significance as a resistance point. With the chart’s overall bullish momentum,
EUR/USD:
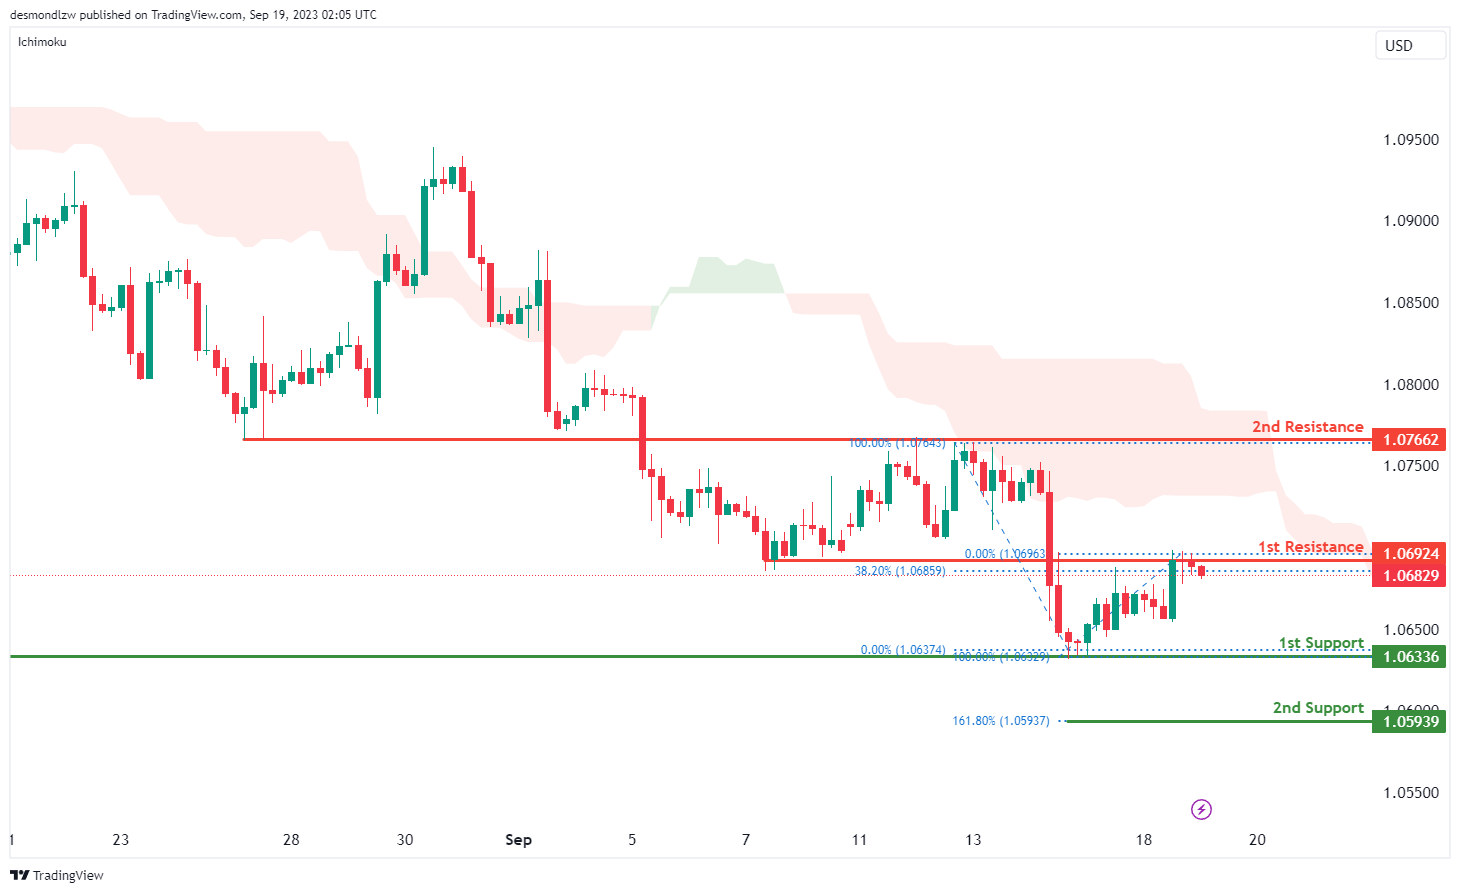
The EUR/USD chart is currently characterized by a bearish momentum, influenced by key factors that contribute to its downward trajectory. Notably, the price resides below the bearish Ichimoku cloud, underlining the overall bearish sentiment and suggesting the potential for further downward movement.
In this context, there’s a plausible scenario where the price may encounter a bearish reaction upon reaching the 1st resistance level at 1.0692, followed by a potential decline towards the 1st support at 1.0633. The 1st support level holds significance as an overlap support, signifying its historical relevance as a potential strong support zone. Similarly, the 2nd support at 1.0593 is characterized by the presence of the 161.80% Fibonacci Extension, further emphasizing its role as a key support level.
On the resistance side, the 1st resistance at 1.0692 is a critical juncture, classified as an overlap resistance and aligning with the 38.20% Fibonacci Retracement, underscoring its potential as a barrier to any potential upward movements. Beyond the 1st resistance, the 2nd resistance at 1.0766 is also identified as an overlap resistance, further highlighting its significance. With the chart’s overall bearish momentum
EUR/JPY:
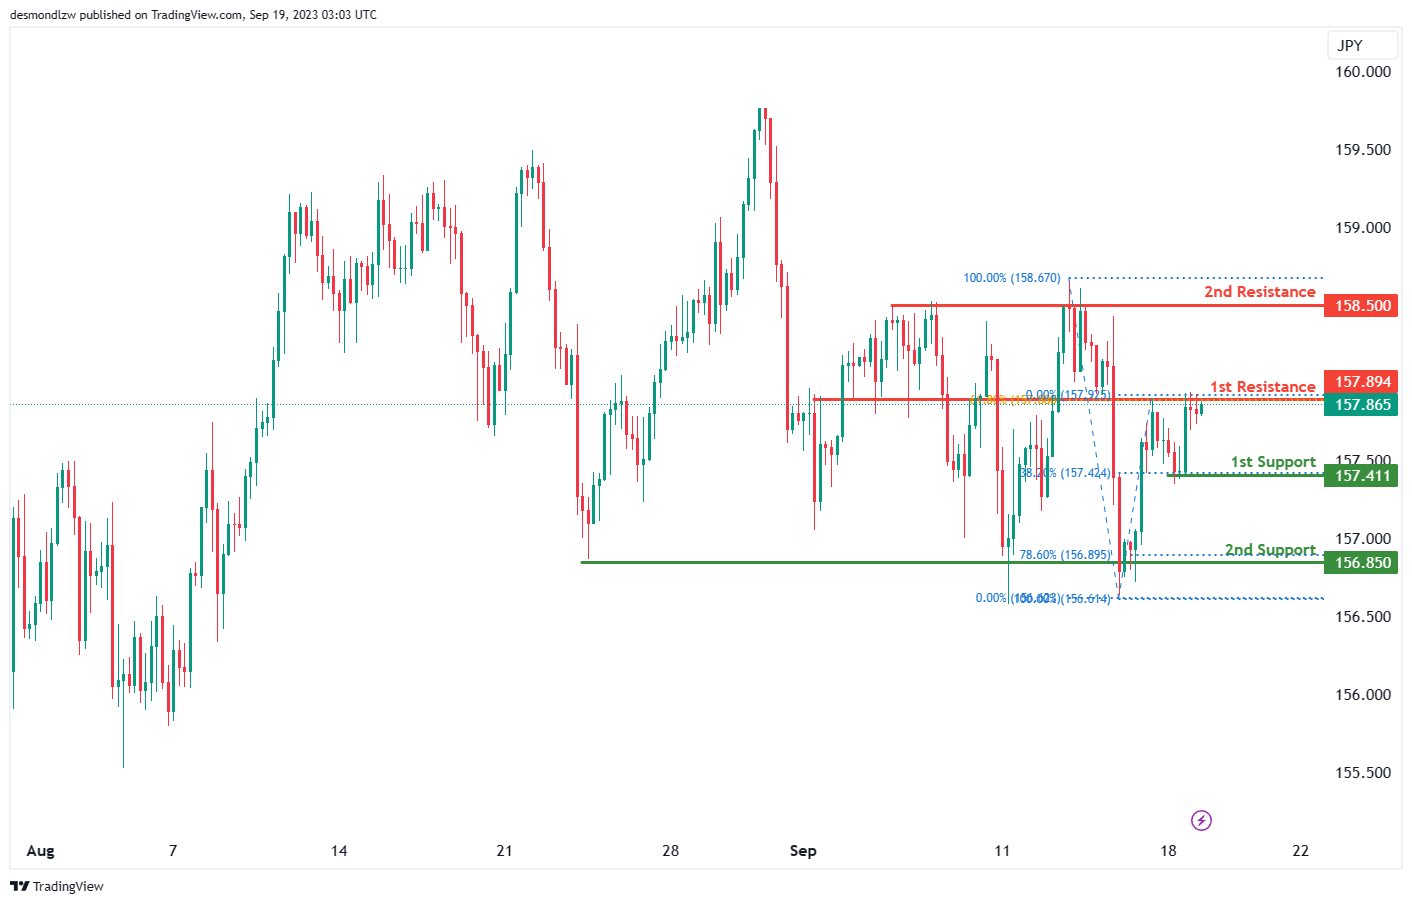
For EUR/JPY, the overall momentum of the chart is currently bearish, indicating a downward trend.
There is a potential for the price to react bearishly off the 1st resistance level at 157.89. This resistance level is considered significant as it represents an overlap resistance and aligns with the 61.80% Fibonacci Retracement level, indicating strong potential resistance at this confluence level.
If the bearish momentum continues, the 1st support level at 157.41 is noteworthy. This support level is characterized as a swing low support and is supported by the 38.20% Fibonacci Retracemen.
Further down, the 2nd support level at 156.85 is also notable as it represents a multi-swing low support and aligns with the 78.60% Fibonacci Retracement. It could act as additional support if the price continues to decline.
EUR/GBP:
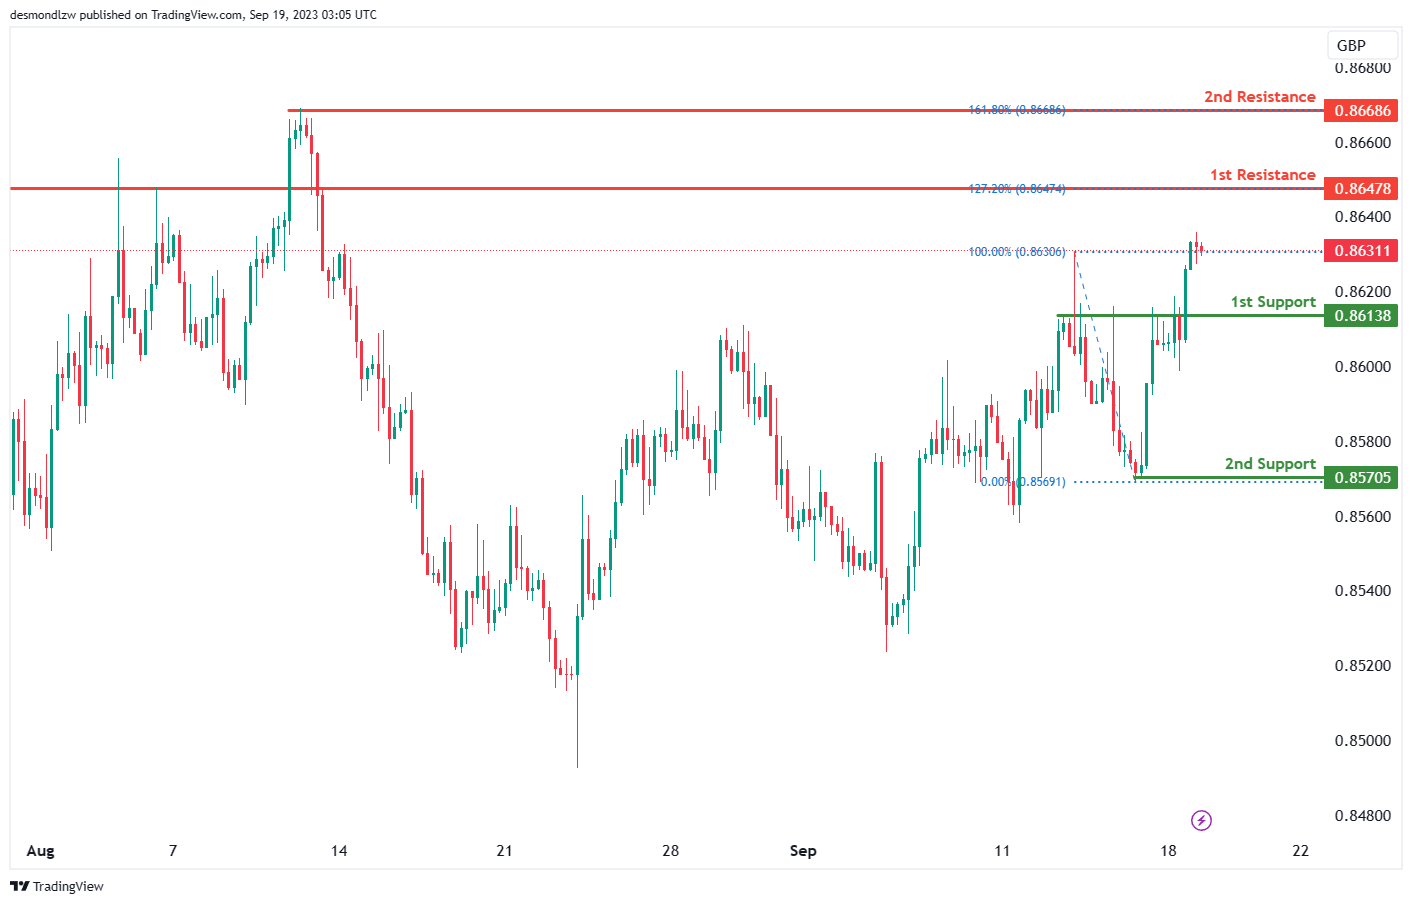
For EUR/GBP, the overall momentum of the chart is currently bullish, indicating an upward trend.
There is a potential for the price to continue its bullish momentum towards the 1st resistance level at 0.8647. This resistance level is considered significant as it represents a pullback resistance and aligns with the 127.20% Fibonacci Extension, suggesting a strong potential resistance area.
If the bullish momentum continues, the 2nd resistance level at 0.8668 is also noteworthy, as it represents a swing high resistance and aligns with the 161.80% Fibonacci Extension, indicating an even stronger potential resistance point.
On the downside, the 1st support level at 0.8613, which is identified as a pullback support. Further down, the 2nd support level at 0.8570, characterized as a swing low support, could also act as support in case ofa retracement.
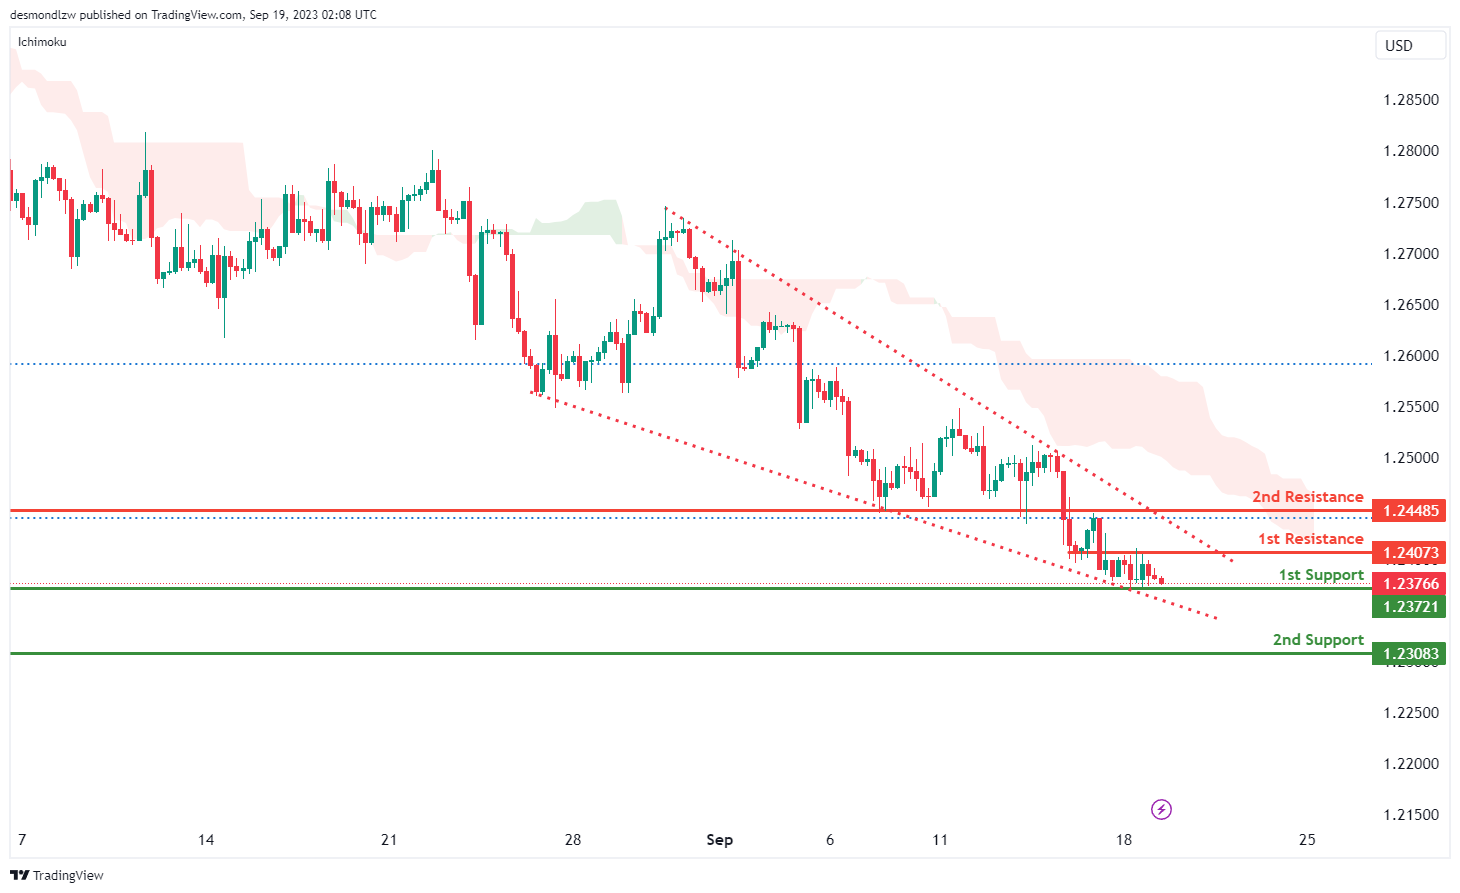
GBP/USD:
The GBP/USD chart currently exhibits a bearish overall momentum, characterized by several factors contributing to its downward trajectory, most notably, the price is situated below the bearish Ichimoku cloud, underscoring the prevailing bearish sentiment.
However, in the short term, there’s a potential scenario where the price may experience a temporary rise towards the 1st resistance level at 1.2407 before reversing and heading downwards towards the 1st support at 1.2372. The 1st support level is a notable consideration, classified as an overlap support, highlighting its historical importance as a potential strong support zone. Similarly, the 2nd support at 1.2308 is identified as a swing low support, reinforcing its role as a key support level.
On the resistance side, the 1st resistance at 1.2407 holds significance as an overlap resistance, signifying its potential as a resistance barrier in the short term. Beyond the 1st resistance, the 2nd resistance at 1.2448 is also categorized as an overlap resistance, further highlighting its relevance. As the chart maintains its bearish momentum,
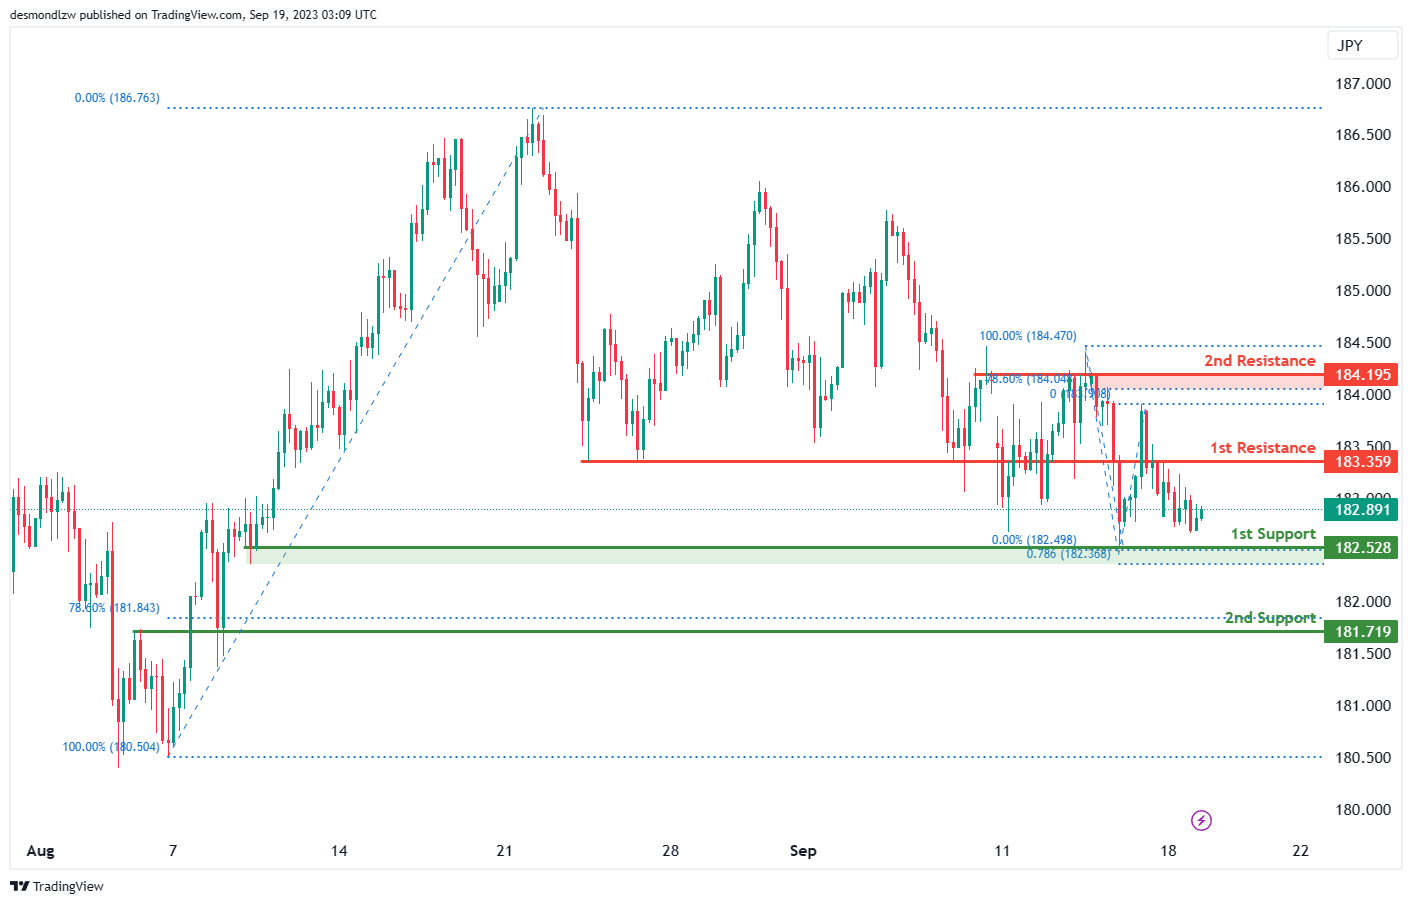
GBP/JPY:
For GBP/JPY, the overall momentum of the chart is currently bearish, indicating a downward trend.
The potential scenario you’ve mentioned is for a bearish continuation towards the 1st support level at 182.52. This support level is considered significant as it aligns with a multi-swing low support and the 78.60% Fibonacci Projection, indicating a strong potential support area.
If the bearish momentum persists, the 2nd support level at 181.71 is also noteworthy. It represents an overlap support and coincides with the 78.60% Fibonacci Retracement, making it another potential support zone.
On the other hand, if there is a reversal in the trend, the 1st resistance level at 183.35. This resistance level is characterized as an overlap resistance.
Further up, the 2nd resistance level at 184.19, representing a multi-swing high resistance and aligning with the 78.60% Fibonacci Retracement, could act as a significant barrier if the price attempts to move higher.
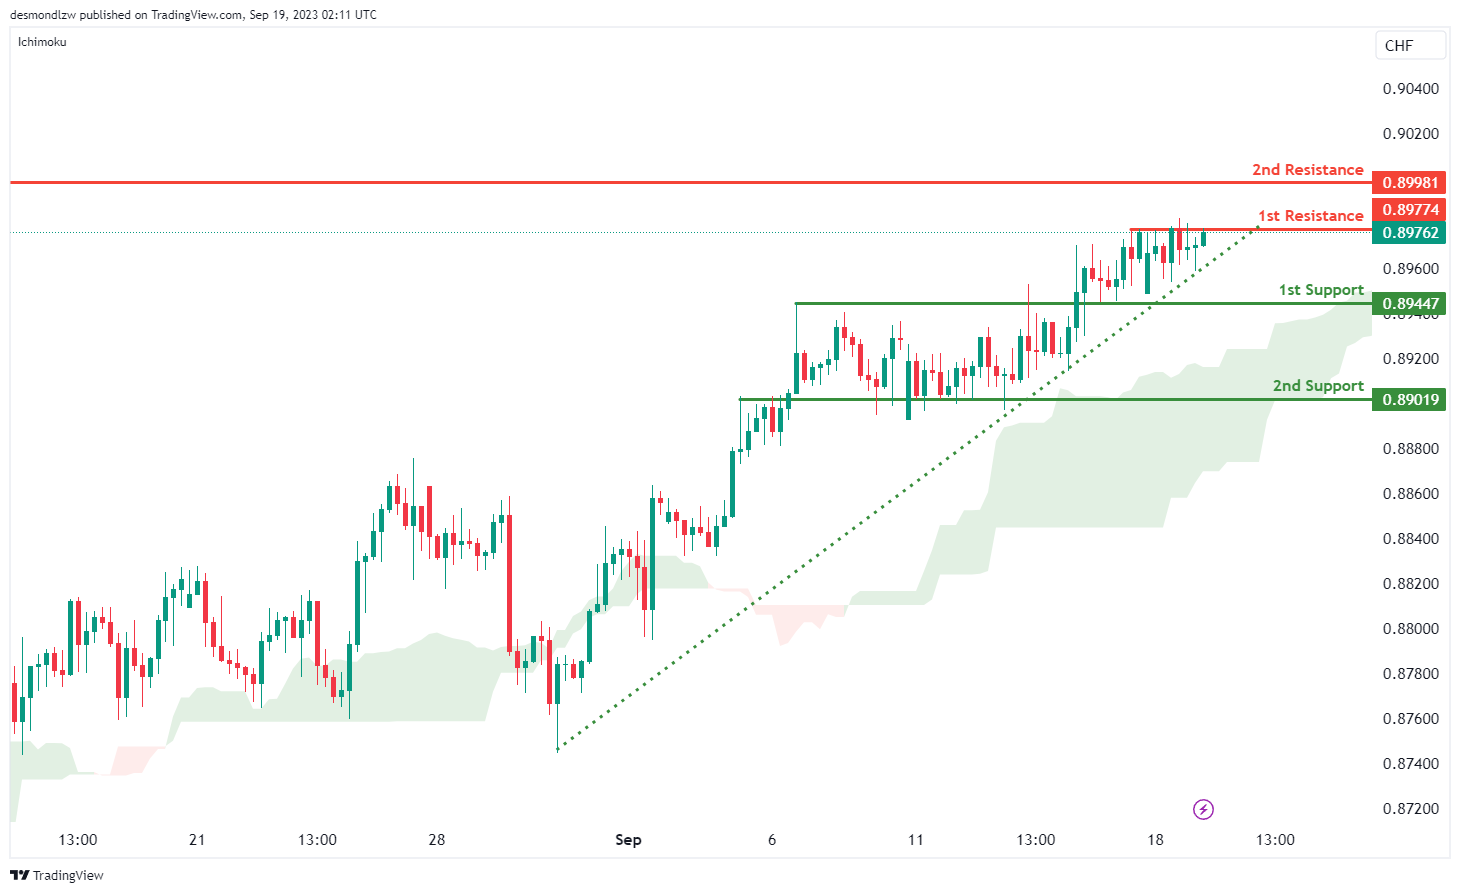
USD/CHF:
The USD/CHF chart is presently characterized by a robust bullish momentum, with several factors contributing to its upward trajectory. Key among these factors is the price’s position above the bullish Ichimoku cloud, signifying a dominant bullish sentiment, along with its alignment above a major ascending trend line, further bolstering expectations of continued bullish momentum.
In the short term, there’s a potential scenario where the price may experience a brief decline, reaching the 1st support level at 0.8944, before subsequently rebounding and ascending towards the 1st resistance at 0.8977. The 1st support level is a significant consideration, classified as an overlap support, signifying its historical relevance as a potential strong support zone. Similarly, the 2nd support at 0.8901 is also identified as an overlap support, reinforcing its role as a key support level.
On the resistance side, the 1st resistance at 0.8977 is pivotal, characterized as a multi-swing high resistance, and it holds the potential to act as a strong resistance barrier. Beyond the 1st resistance, the 2nd resistance at 0.8998 is also identified as a multi-swing high resistance, further highlighting its significance. With the chart’s overall bullish momentum
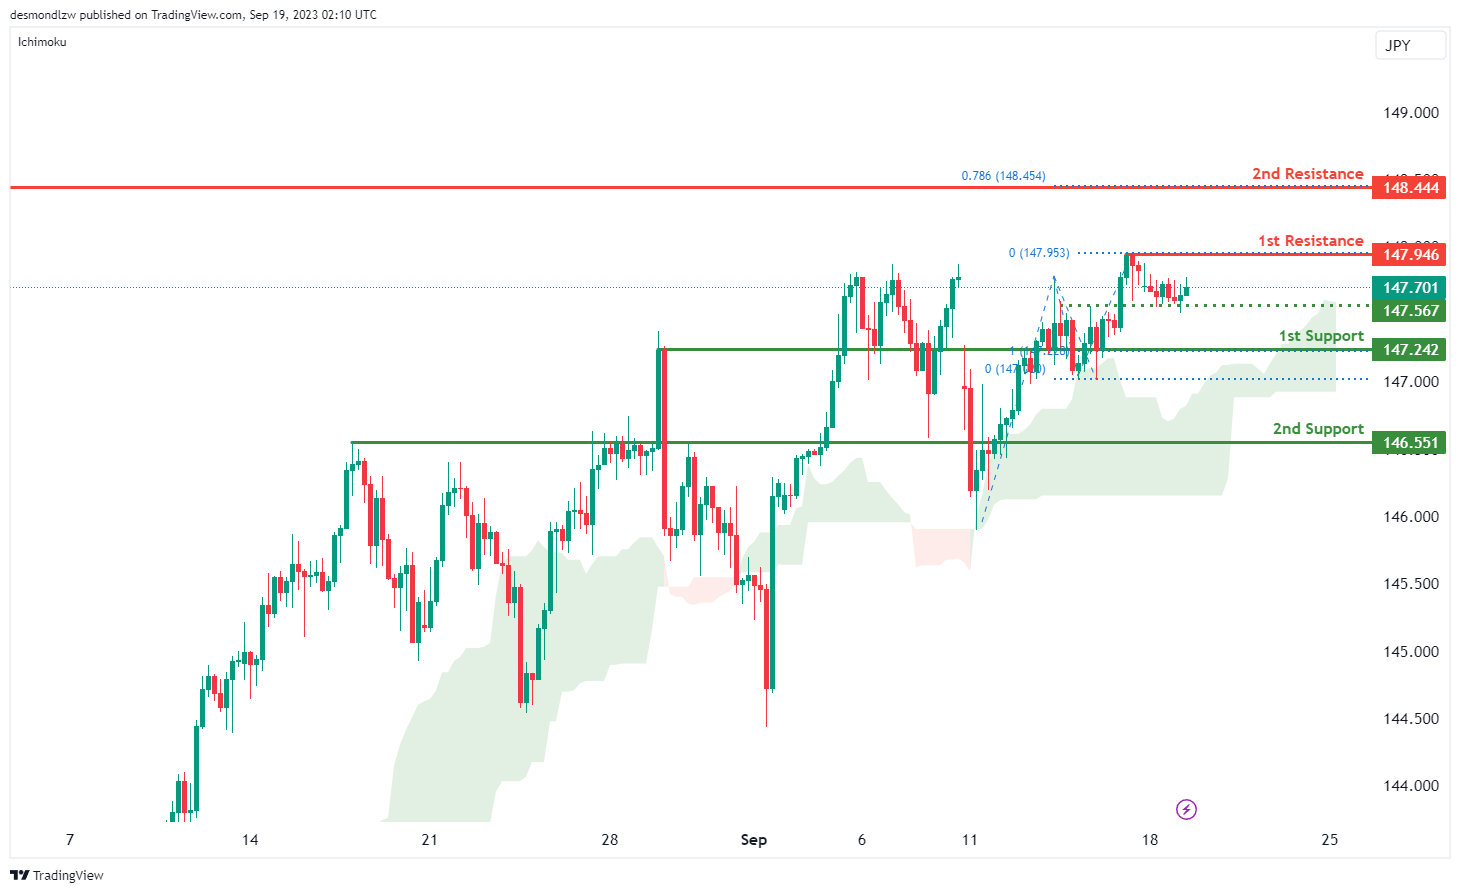
USD/JPY:
The USD/JPY chart currently maintains a strong bullish momentum, underpinned by several factors contributing to its upward trajectory. A notable signal of this bullish sentiment is the price’s recent cross above the Ichimoku cloud, confirming the favorable market conditions.
In this context, there’s a plausible scenario where the price may continue its bullish run towards the 1st resistance level at 147.94. The 1st support at 147.24 is of notable significance, classified as an overlap support, and its historical importance underscores its potential as a strong support zone. Similarly, the 2nd support at 146.55 is identified as an overlap support, further reinforcing its role as a key support level. On the resistance side, the 1st resistance at 147.94 assumes a pivotal role, characterized as a swing high resistance, signifying its potential as a point of resistance. Beyond the 1st resistance, the 2nd resistance at 148.44 is identified as a swing high resistance, and it aligns with the presence of the 78.60% Fibonacci Projection, adding an extra layer of reinforcement to its importance.
Additionally, an intermediate support level at 147.56 is in play, classified as an overlap support, further emphasizing its relevance as a support zone. With the chart’s overall bullish momentum,
USD/CAD:
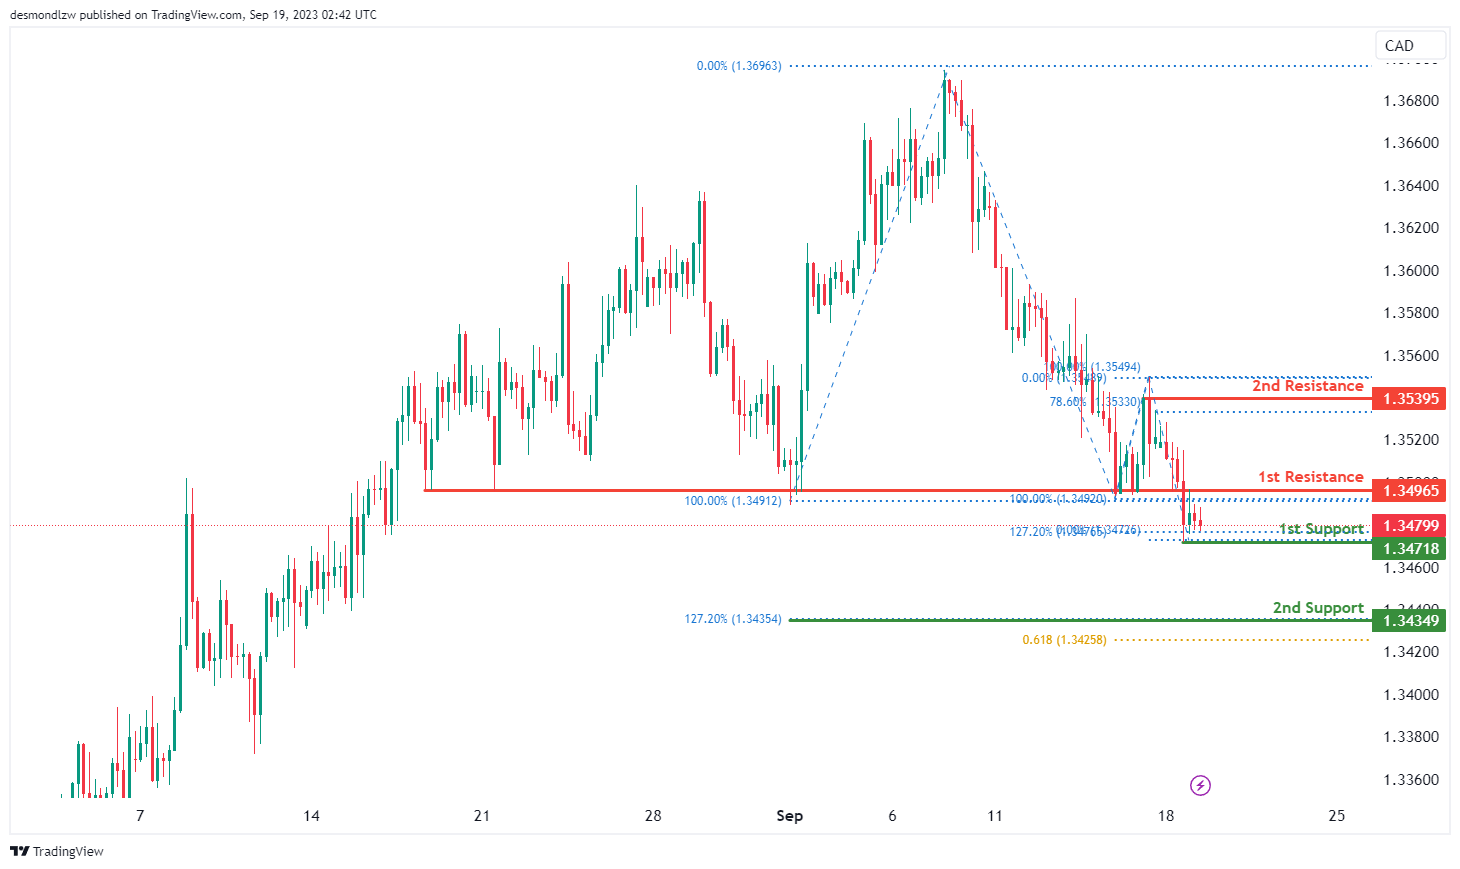
The USD/CAD chart currently indicates an overall neutral momentum, suggesting a lack of a strong directional bias in this currency pair. It is anticipated that price could fluctuate between the 1st support and the 1st resistance levels.
The 1st support level at 1.3472 is identified as a pullback support that aligns with the 127.20% Fibonacci extension level while the 2nd support level at 1.3435 is marked as a support level that aligns with a confluence of Fibonacci levels i.e. the 127.20% extension and the 61.80% projection levels.
To the upside, the 1st resistance level at 1.3497 is identified as a pullback resistance. Further up, the 2nd resistance level at 1.3539 is noted as a swing-high resistance that aligns with the 78.60% Fibonacci retracement level.
AUD/USD:
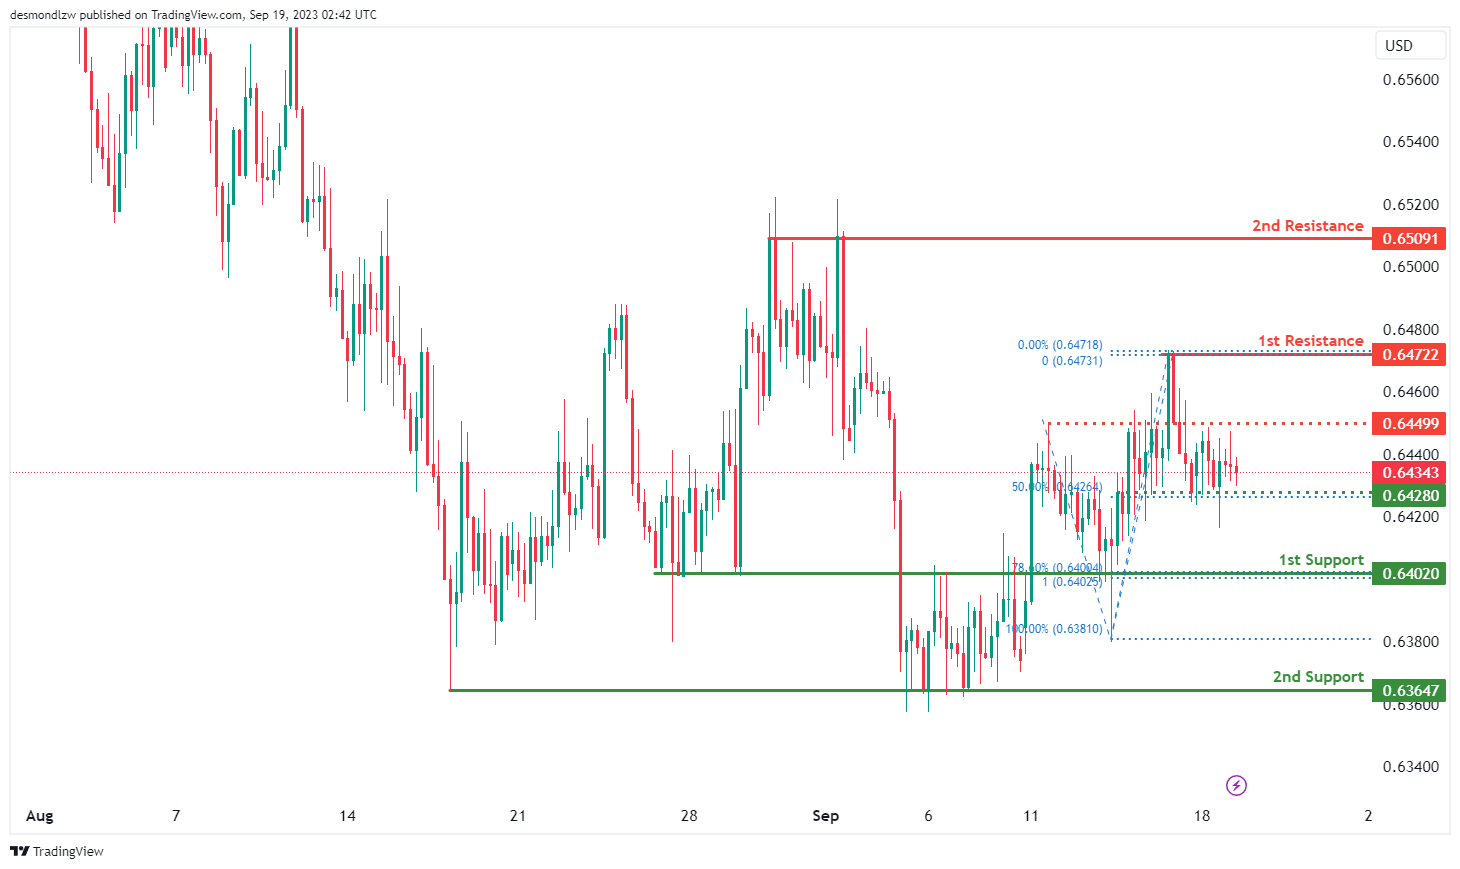
The AUD/USD chart currently indicates an overall neutral momentum, suggesting that the currency pair lacks a strong directional bias. In such scenarios, price is anticipated to fluctuate between the 1st support and the 1st resistance levels.
There is an intermediate support level at 0.64280 that is noted as a pullback support that aligns with the 50.00% Fibonacci retracement level while the 1st support level at 0.6402 is identified as an overlap support that aligns with a confluence of Fibonacci levels i.e. the 78.60% retracement and the 100.00% projection levels. In addition, the 2nd support level at 0.6365 is marked as a pullback support.
There is an intermediate resistance level at 0.6449 which is identified as a pullback resistance while the
1st resistance level at 0.6472 is marked as a swing-high resistance. Further up, the 2nd resistance level at 0.6509 is identified as a multi-swing-high resistance, potentially acting as a major barrier for any upward price movements.
NZD/USD
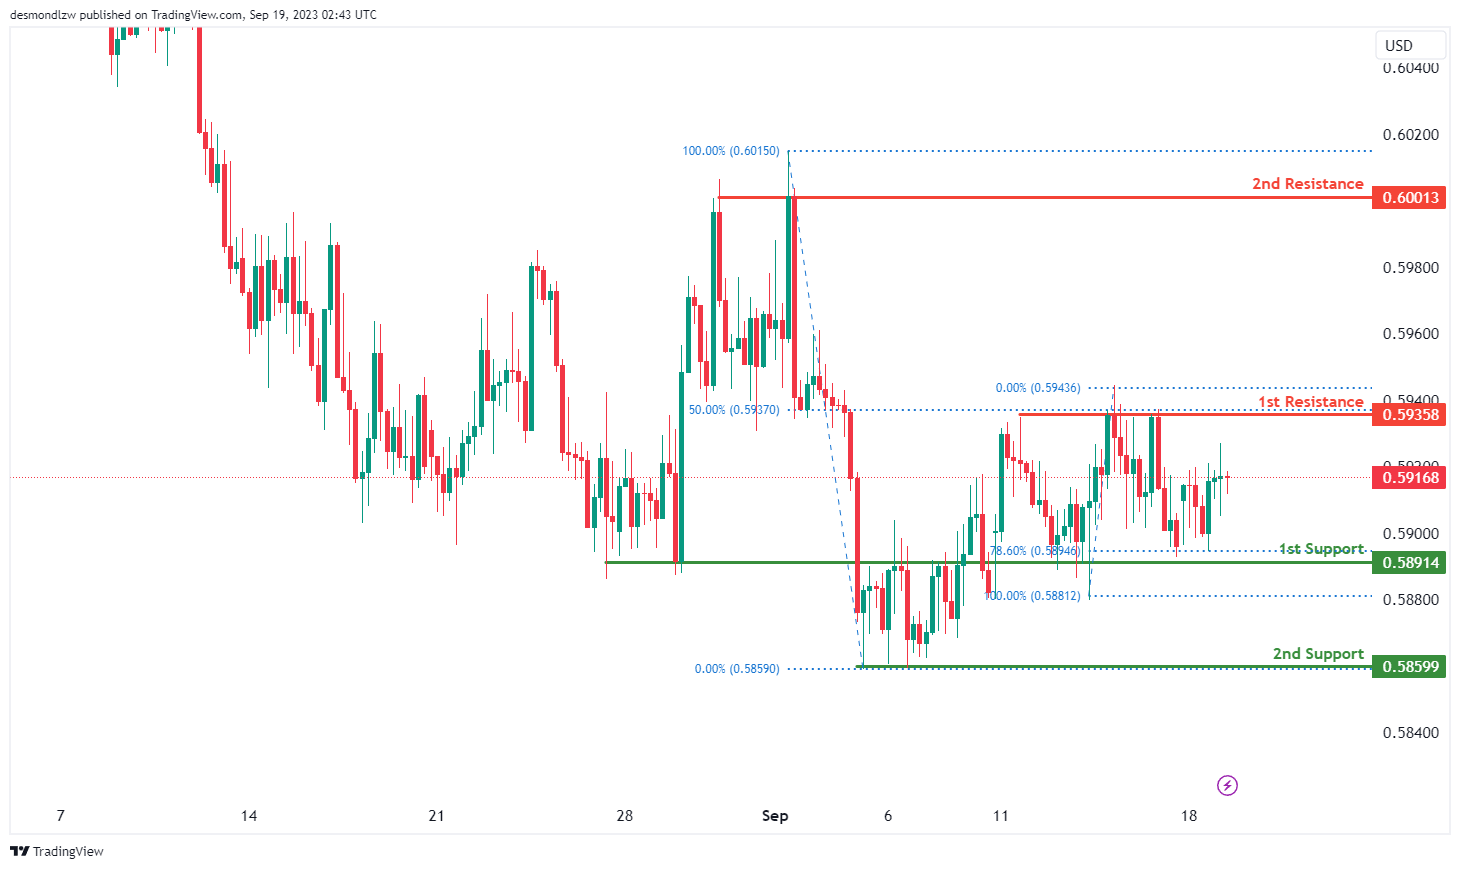
The chart for NZD/USD indicates an overall neutral momentum, suggesting that the currency pair is lacking a clear directional bias and is anticipated for price to fluctuate between the 1st support and the 1st resistance levels.
The 1st support level at 0.5891 is identified as an overlap support that aligns with the 78.60% Fibonacci retracement level while the 2nd support level at 0.5859 is noted as a pullback support.
To the upside, the 1st resistance level at 0.5936 is identified as a pullback resistance that coincides with the 50.00% Fibonacci retracement level. Further up, the 2nd resistance level at 0.6001 is identified as a multi-swing-high resistance, potentially halting any further upward price movements.
DJ30:
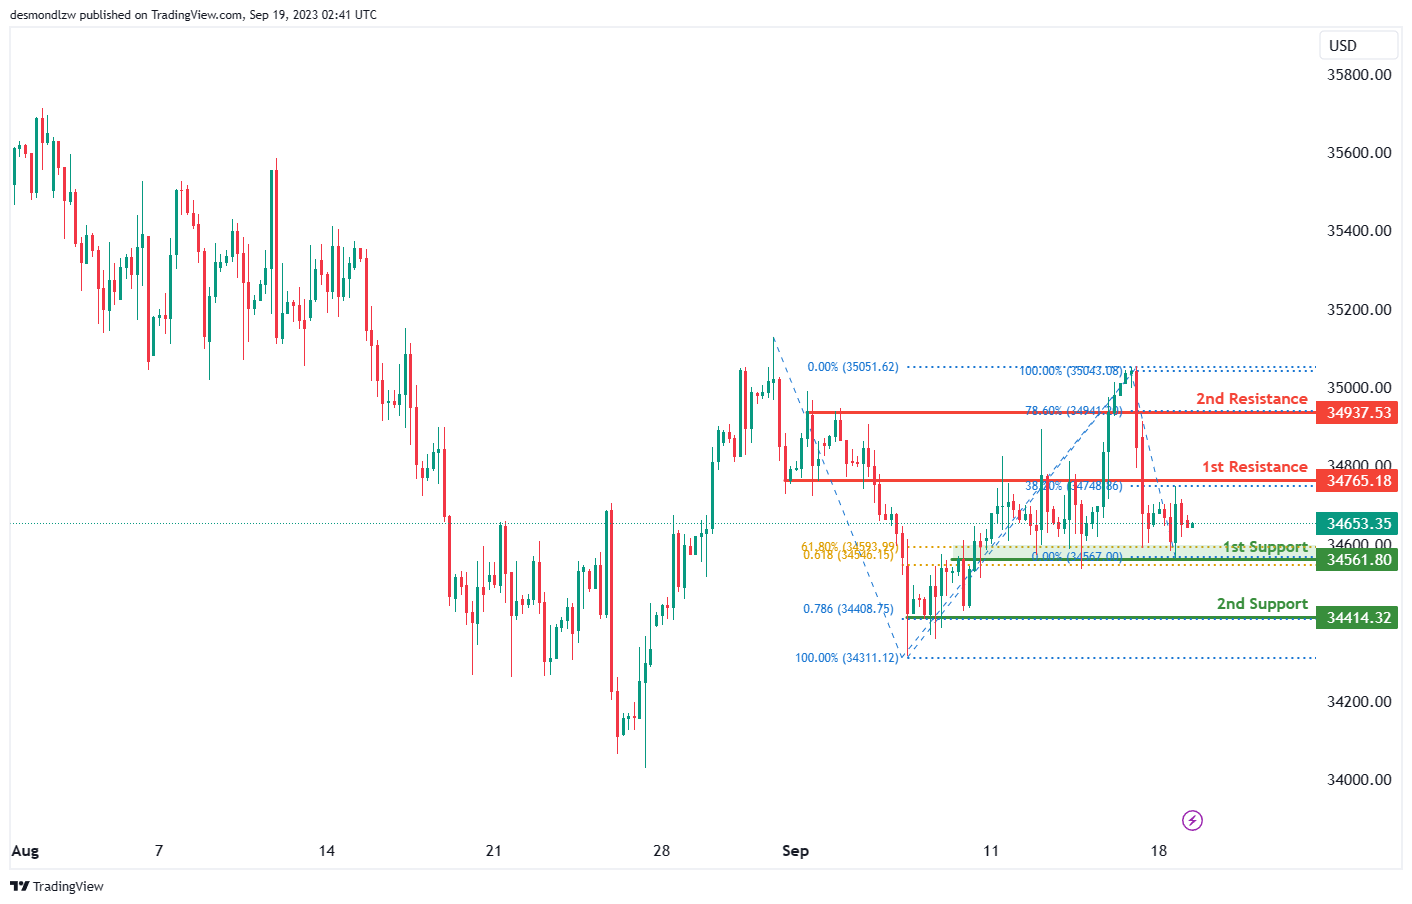
For DJ30 (Dow Jones Industrial Average), the overall momentum of the chart is currently bearish, indicating a downward trend.
There is potential for the price to continue its bearish movement towards the 1st support level at 34651.80, which is considered significant. This support level aligns with both the 61.80% Fibonacci Projection and the 61.80% Fibonacci Retracement, indicating strong potential support at this confluence level.
If the bearish momentum persists, the 2nd support level at 34414.32 is also noteworthy as it represents a multi-swing low support and aligns with the 78.60% Fibonacci Projection, providing additional support for this level.
On the other hand, if there’s a reversal in the price, it may encounter resistance at the 1st resistance level of 34765.18. This resistance is characterized as an overlap resistance and is supported by a 38.20% Fibonacci Retracement.
Further upward movement could face the 2nd resistance level at 34937.53, which is identified as a pullback resistance and is supported by the 78.60% Fibonacci Retracement.
GER30:
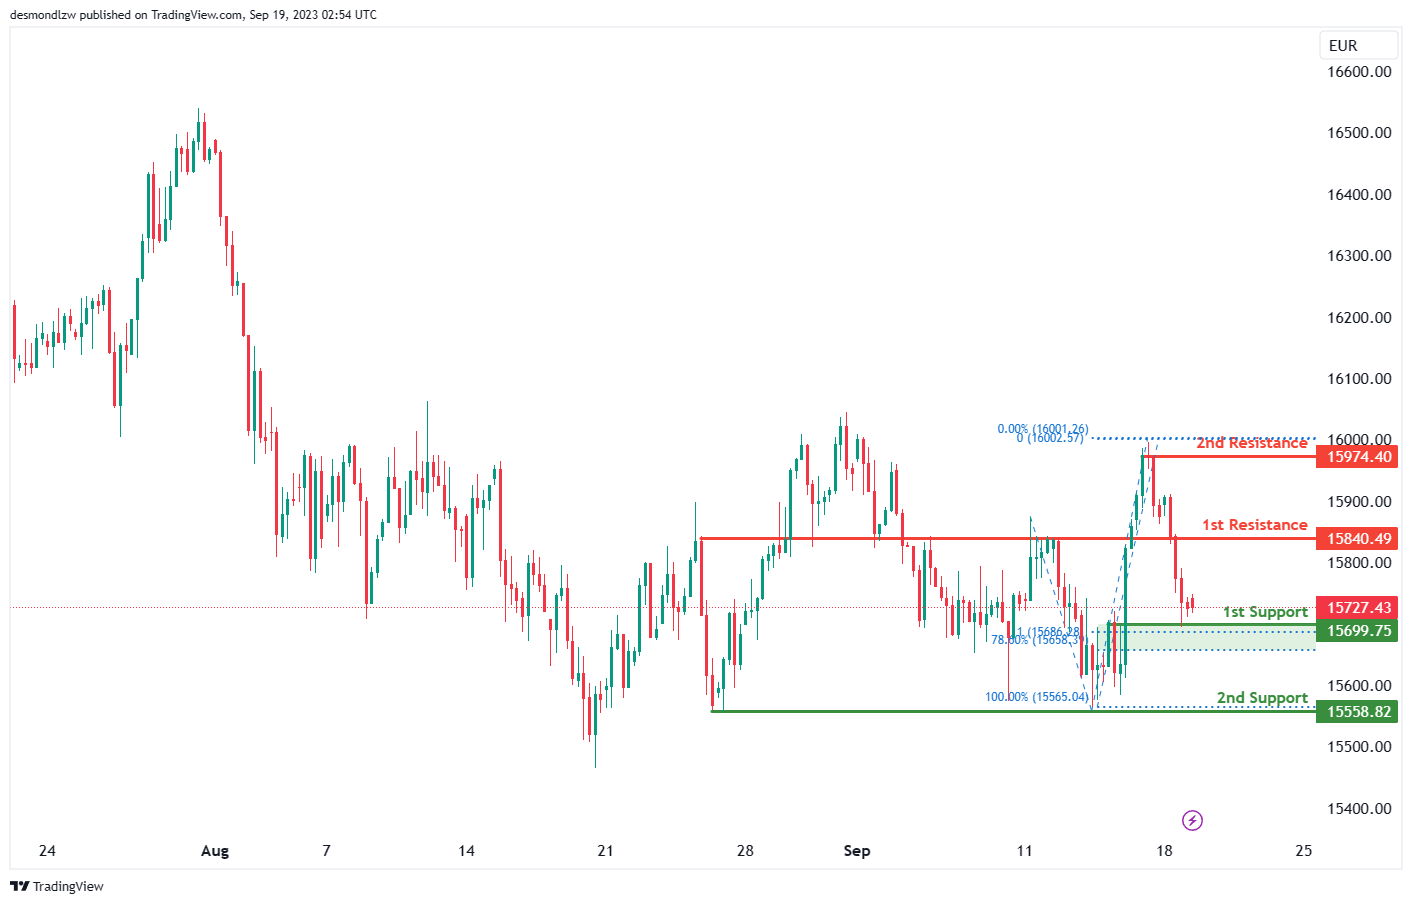
For GER30 (DAX 30), the overall momentum of the chart is currently bearish, indicating a downward trend.
There is potential for the price to continue its bearish movement towards the 1st support level at 15699.75. This support level is significant as it aligns with an overlap support, the 78.60% Fibonacci Retracement, and the 100% Fibonacci Projection, indicating strong potential support at this confluence level.
If the bearish momentum persists, the 2nd support level at 15558.82 is also noteworthy, representing a multi-swing low support. While not accompanied by Fibonacci levels, it can act as an additional layer of support.
On the other hand, if there’s a reversal in the price, it may encounter resistance at the 1st resistance level of 15840.49. This resistance level is characterized as a pullback resistance.
Further upward movement could face the 2nd resistance level at 15974.40, which is identified as a swing high resistance.
US500
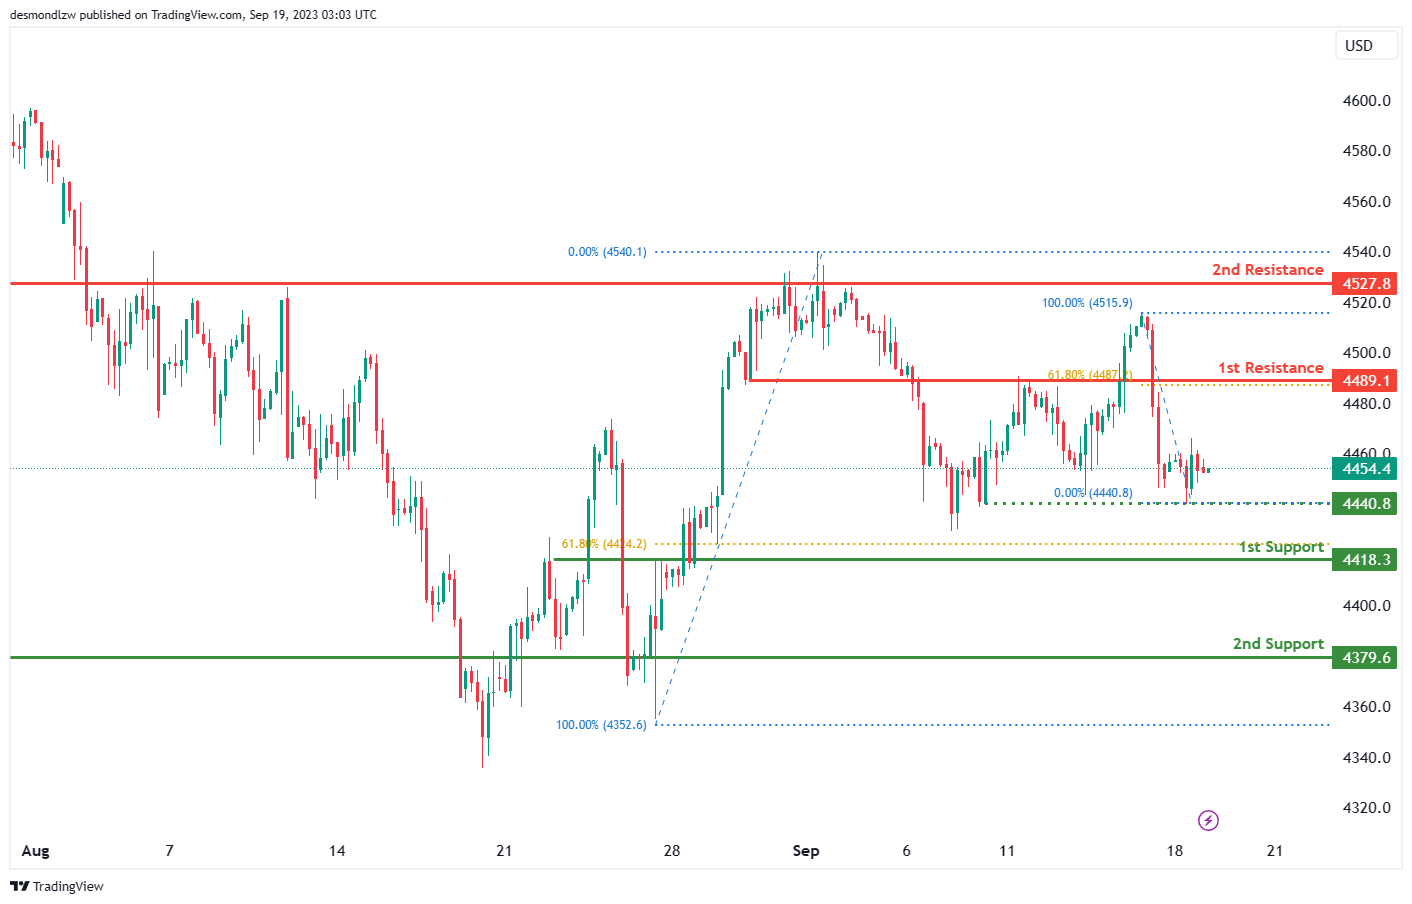
For US500 (S&P 500), the overall momentum of the chart is currently bearish, suggesting a downward trend.
There is a potential for the price to continue its bearish movement towards the 1st support level at 4418.3. This support level is considered significant as it aligns with a pullback support and coincides with the 61.80% Fibonacci Retracement level, indicating strong potential support at this confluence level.
If the bearish momentum persists, the 2nd support level at 4379.6 is also notable as it represents an overlap support. Although it doesn’t have a specific Fibonacci level attached to it, overlap supports can be meaningful in providing additional support.
On the other hand, if there’s a reversal in the price, it may face resistance at the 1st resistance level of 4489.1. This resistance level is characterized as a pullback resistance and aligns with the 61.80% Fibonacci Retracement.
Further upward movement could encounter the 2nd resistance level at 4527.8, which is identified as an overlap resistance.
Additionally, there is an intermediate support level at 4440.8, which is considered a multi-swing low support.
BTC/USD:
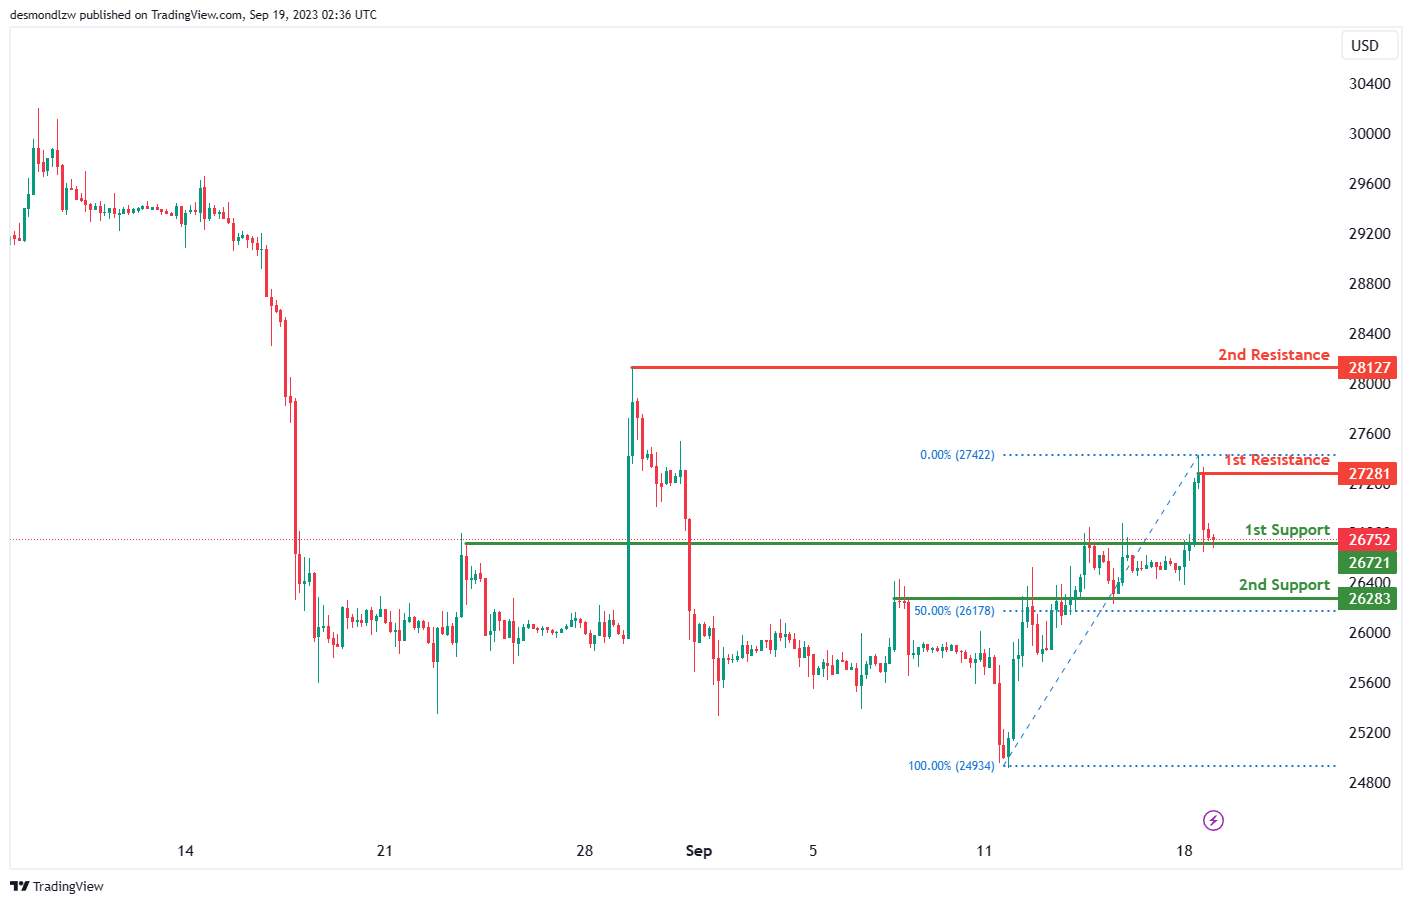
For BTC/USD, the overall momentum of the chart is currently bullish, indicating an upward trend.
There is potential for the price to make a bullish move by bouncing off the 1st support level at 26,721 and heading towards the 1st resistance level at 27,281.
The 1st support at 26,721 is considered significant as it represents an overlap support, suggesting strong potential support at this level.
In case of a deeper pullback, the 2nd support level at 26,283 is also noteworthy, as it aligns with the 50% Fibonacci Retracement, indicating potential support in this area.
On the upper side, the 1st resistance at 27,281 is identified as a swing high resistance, which may act as a point of resistance for the bullish momentum.
Further upward movement could face additional resistance at the 2nd resistance level of 28,127, characterized as a swing high resistance. Overall, the chart’s momentum suggests the potential for a bullish bounce off the identified support level and a move towards resistance.
ETH/USD:
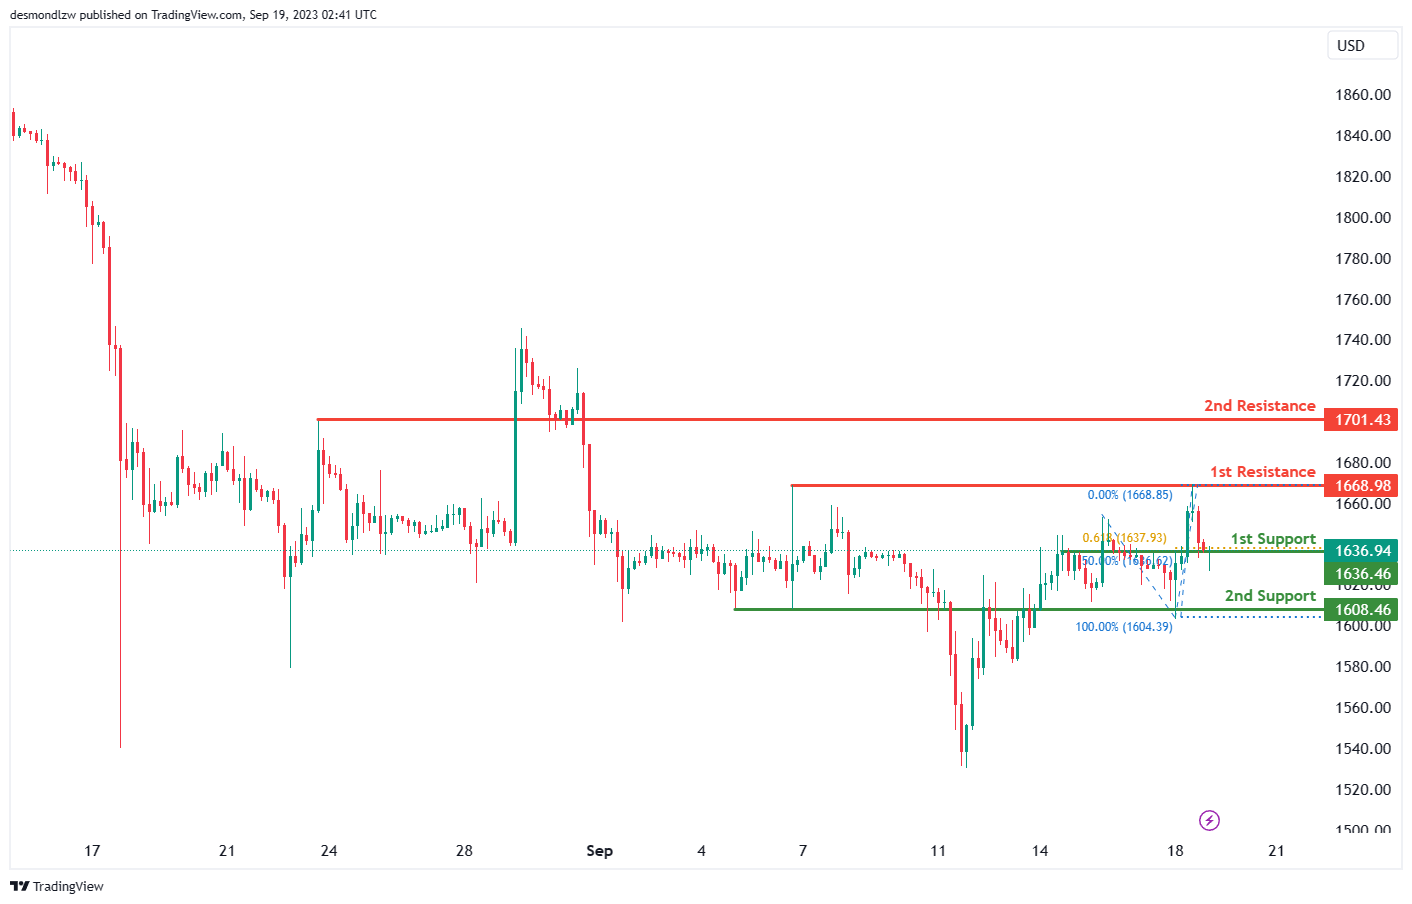
For ETH/USD, the overall momentum of the chart is currently bullish, indicating an upward trend.
There is potential for the price to make a bullish move by bouncing off the 1st support level at 1636.46 and heading towards the 1st resistance level at 1668.98.
The 1st support at 1636.46 is considered significant as it represents an overlap support and aligns with both the 50% Fibonacci Retracement and the 61.80% Fibonacci Projection, indicating strong potential support at this level.
If there’s a deeper pullback, the 2nd support level at 1608.46, which is also an overlap support, may provide additional support to the price.
On the upper side, the 1st resistance at 1668.98 is identified as a multi-swing high resistance, suggesting potential resistance at this level.
Further bullish movement could encounter the 2nd resistance level at 1701.43, which is characterized as a pullback resistance, potentially acting as a barrier to the bullish momentum.
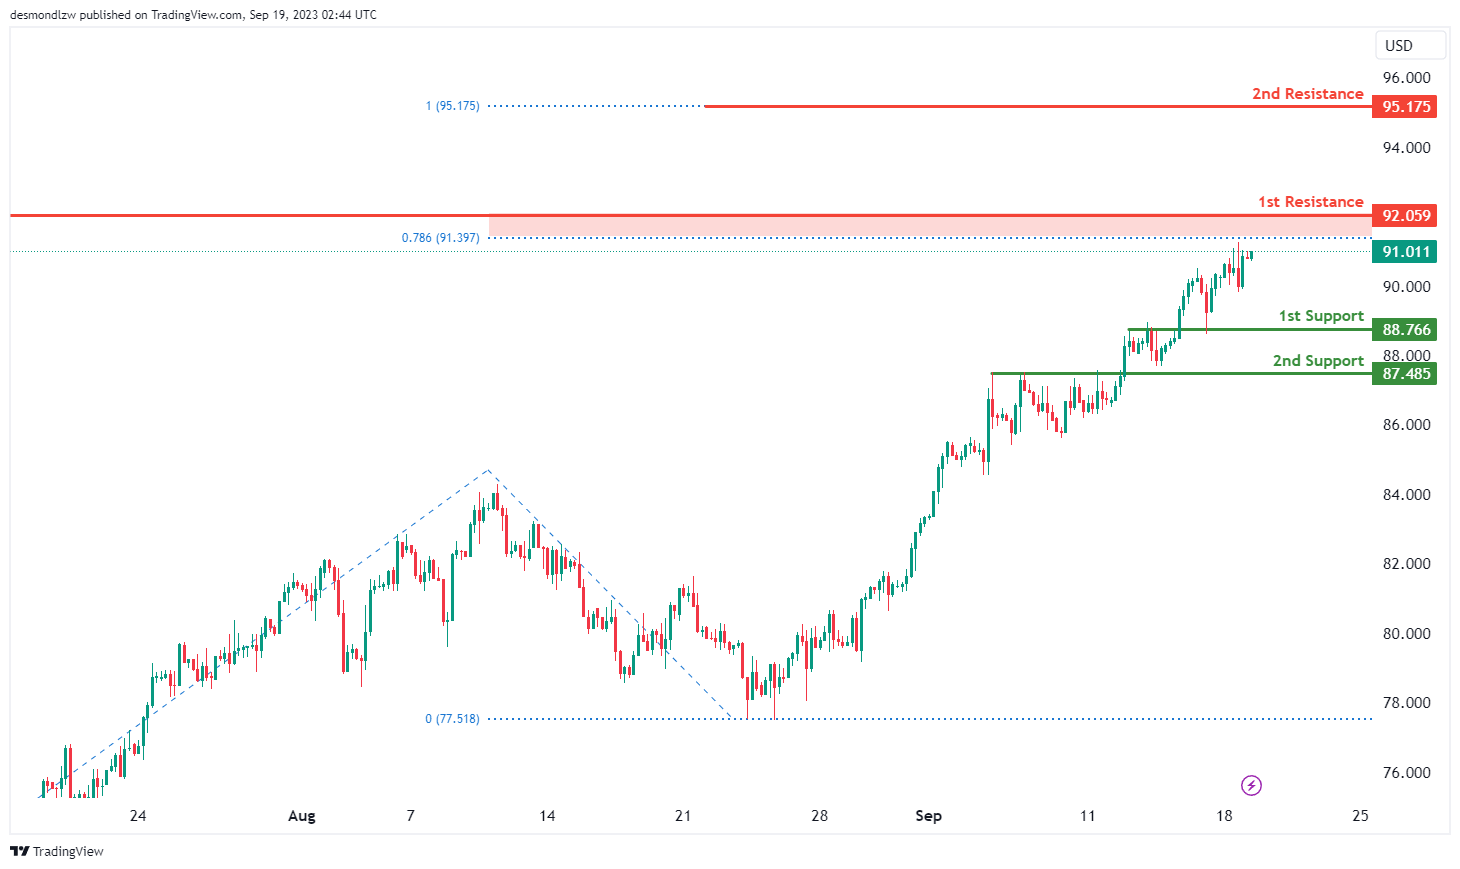
WTI/USD:
The chart for WTI (West Texas Intermediate) crude oil is currently showing an overall bullish momentum, indicating that price has been on an upward trajectory with the potential for a bullish continuation towards the 1st resistance level.
The 1st resistance level at 92.06 is identified as a swing-high resistance that aligns with the 78.60% Fibonacci projection level. Further up, the 2nd resistance level at 95.18 is marked as a resistance level that coincides with the 100.00% Fibonacci projection level, potentially acting as a strong barrier to upward price movement.
To the downside, the 1st support level at 88.77 is identified as an overlap support while the 2nd support level at 87.49 is also marked as another overlap support, reinforcing the idea that this area may act as a strong support zone.
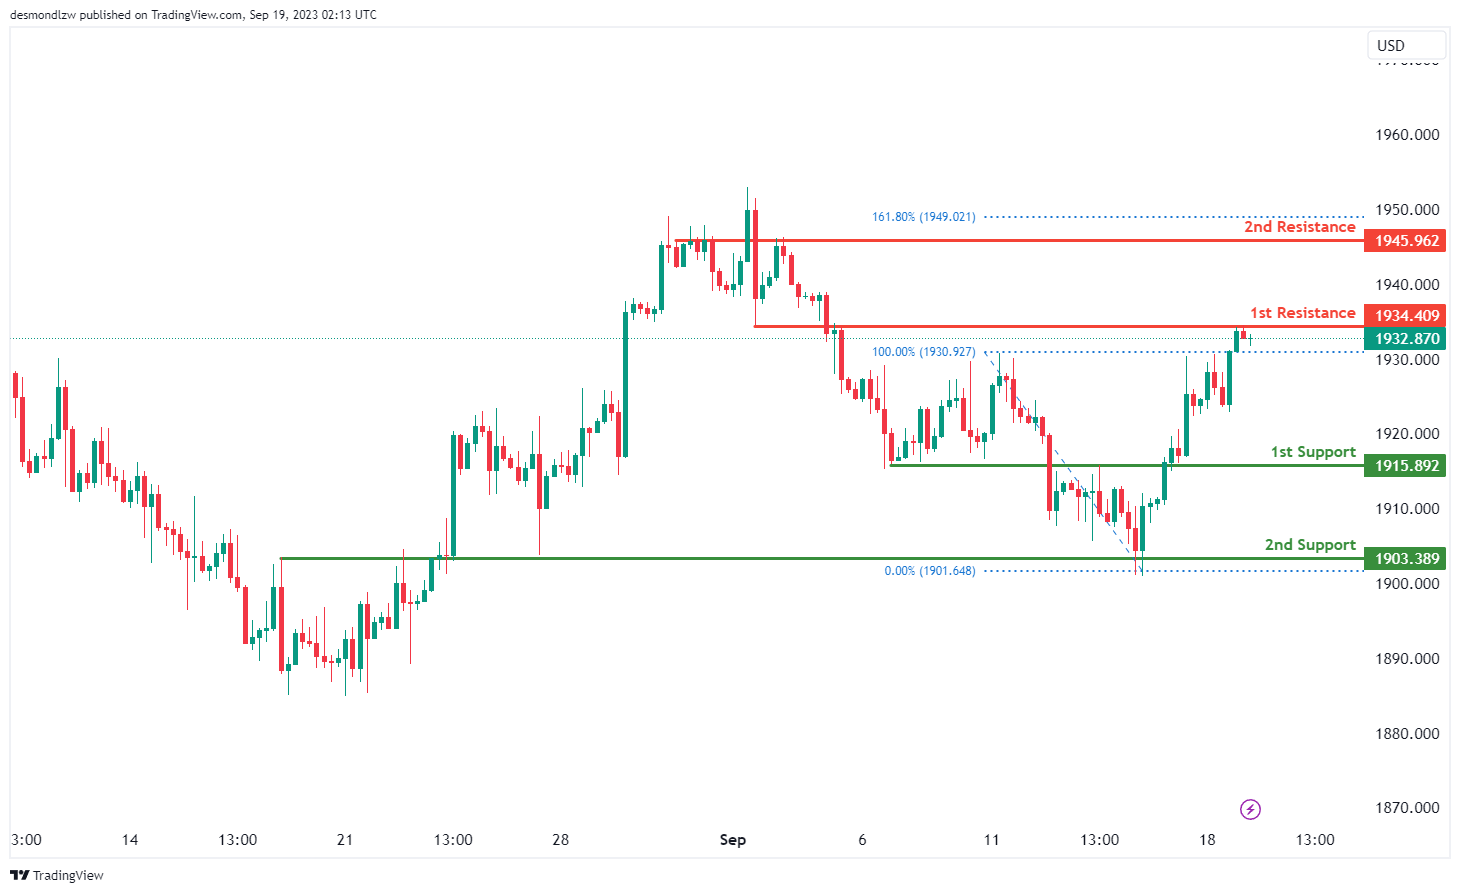
XAU/USD (GOLD):
The XAU/USD chart currently exhibits a bullish overall momentum, and while the bullish sentiment persists, there’s a short-term scenario where the price may experience a temporary decline towards the 1st support level at 1915.89 before subsequently rebounding and ascending towards the 1st resistance at 1934.40. The 1st support is of notable significance, marked as an overlap support, emphasizing its historical relevance as a potential strong support zone. Similarly, the 2nd support at 1903.38 is identified as an overlap support, further underlining its role as a key support level.
On the resistance side, the 1st resistance at 1934.40 plays a pivotal role, categorized as an overlap resistance, and it carries the potential to act as a resistance barrier in the short term. Beyond the 1st resistance, the 2nd resistance at 1945.96 is also identified as an overlap resistance, further emphasizing its relevance. As the chart’s overall bullish momentum continues.


