
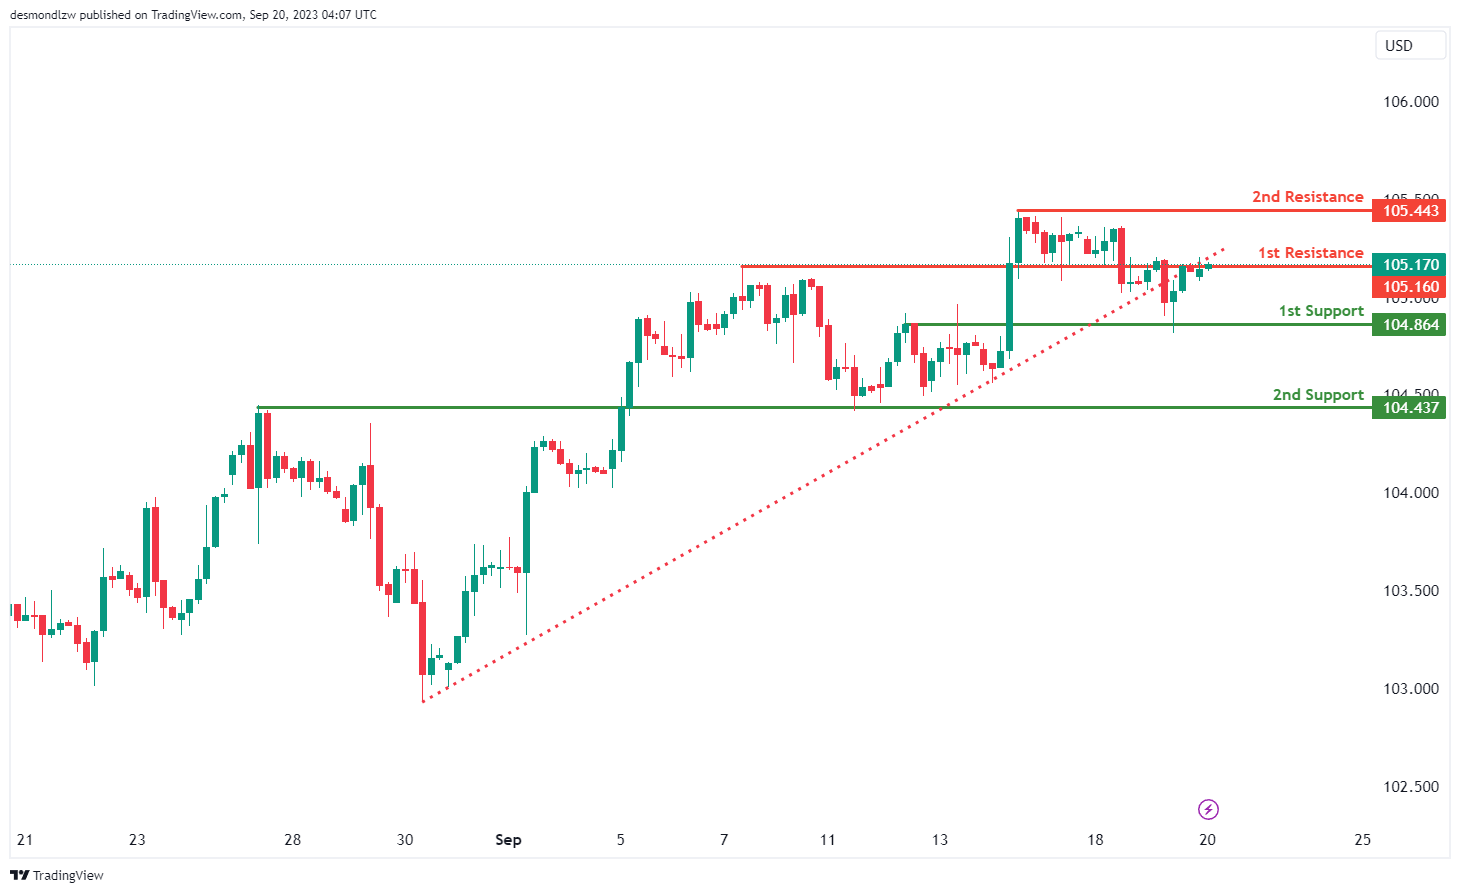
DXY:
The DXY (US Dollar Index) chart currently reflects a bearish overall momentum, driven by several factors contributing to its downward trajectory. A significant factor in this bearish sentiment is the recent break below an ascending support line, which has triggered the potential for a bearish move. In this context, there’s a plausible scenario where the price may experience a bearish reaction upon reaching the 1st resistance level at 105.16, subsequently declining towards the 1st support at 104.86. The 1st support is of notable importance, classified as an overlap support, signifying its historical relevance as a potential strong support zone. Similarly, the 2nd support at 104.43 is identified as an overlap support, reinforcing its role as a key support level.
On the resistance side, the 1st resistance at 105.16 is pivotal, categorized as an overlap resistance, and it carries the potential to act as a resistance barrier. Beyond the 1st resistance, the 2nd resistance at 105.44 is also characterized as a multi-swing high resistance, further emphasizing its significance.
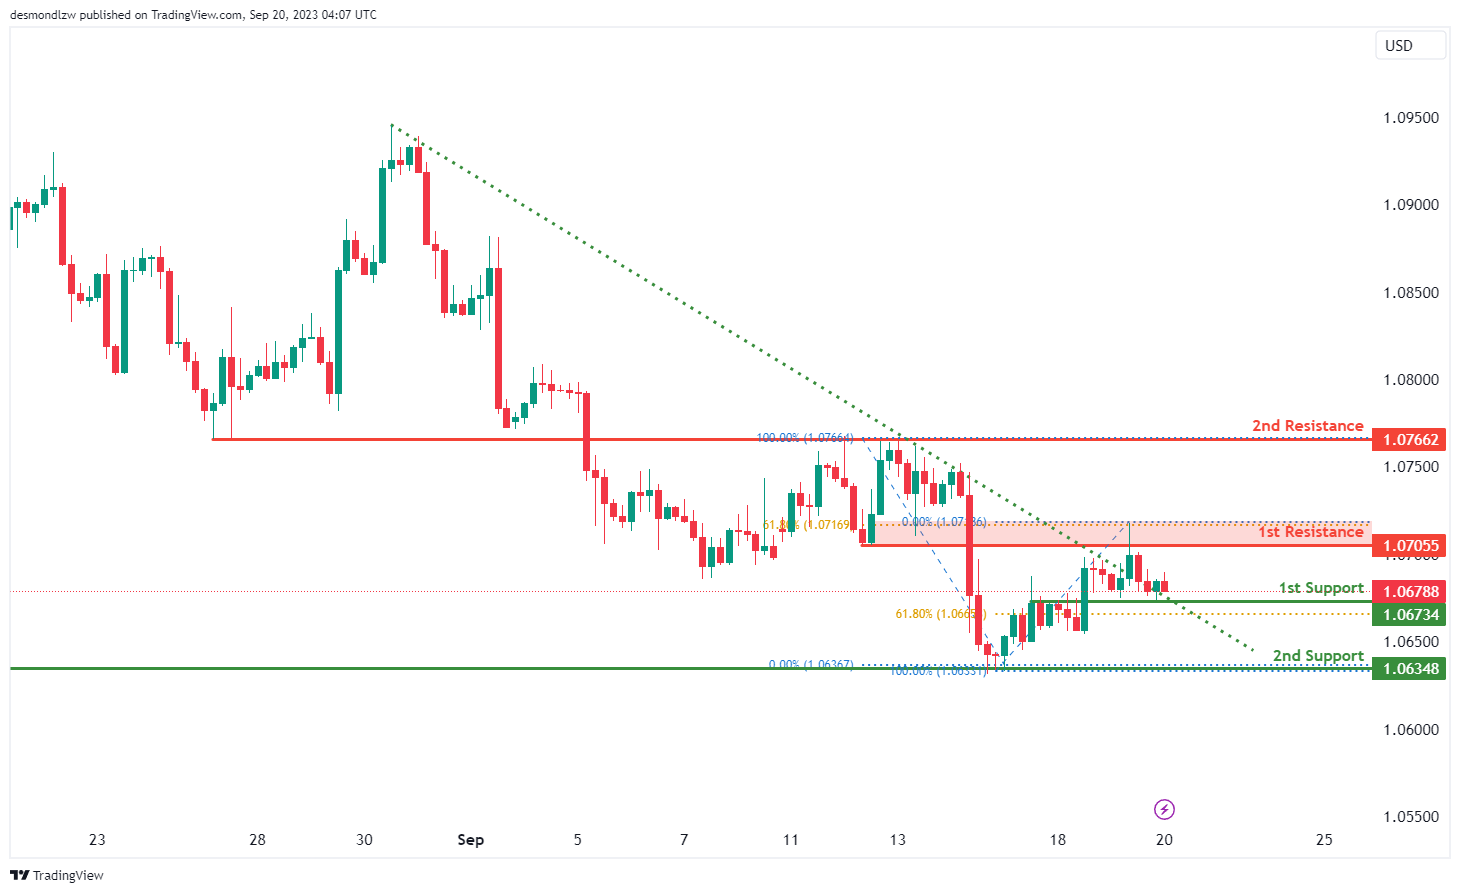
EUR/USD:
The EUR/USD chart currently exhibits a bullish overall momentum, with several factors contributing to its upward trajectory. One notable factor is the recent break above a descending resistance line, which has triggered the potential for a bullish move. In this context, there’s a plausible scenario where the price may experience a bullish bounce upon reaching the 1st support level at 1.0673 before advancing towards the 1st resistance at 1.0705.
The 1st support at 1.0673 is considered significant, characterized as an overlap support, and it also aligns with the presence of the 61.80% Fibonacci Retracement, highlighting its potential as a strong support zone. Similarly, the 2nd support at 1.0634 is identified as a multi-swing low support, further emphasizing its role as a key support level.
On the resistance side, the 1st resistance at 1.0705 plays a pivotal role, categorized as an overlap resistance and aligning with the 61.80% Fibonacci Retracement, underscoring its potential as a barrier to further upward movement. Beyond the 1st resistance, the 2nd resistance at 1.0766 is also identified as an overlap resistance, further highlighting its significance.
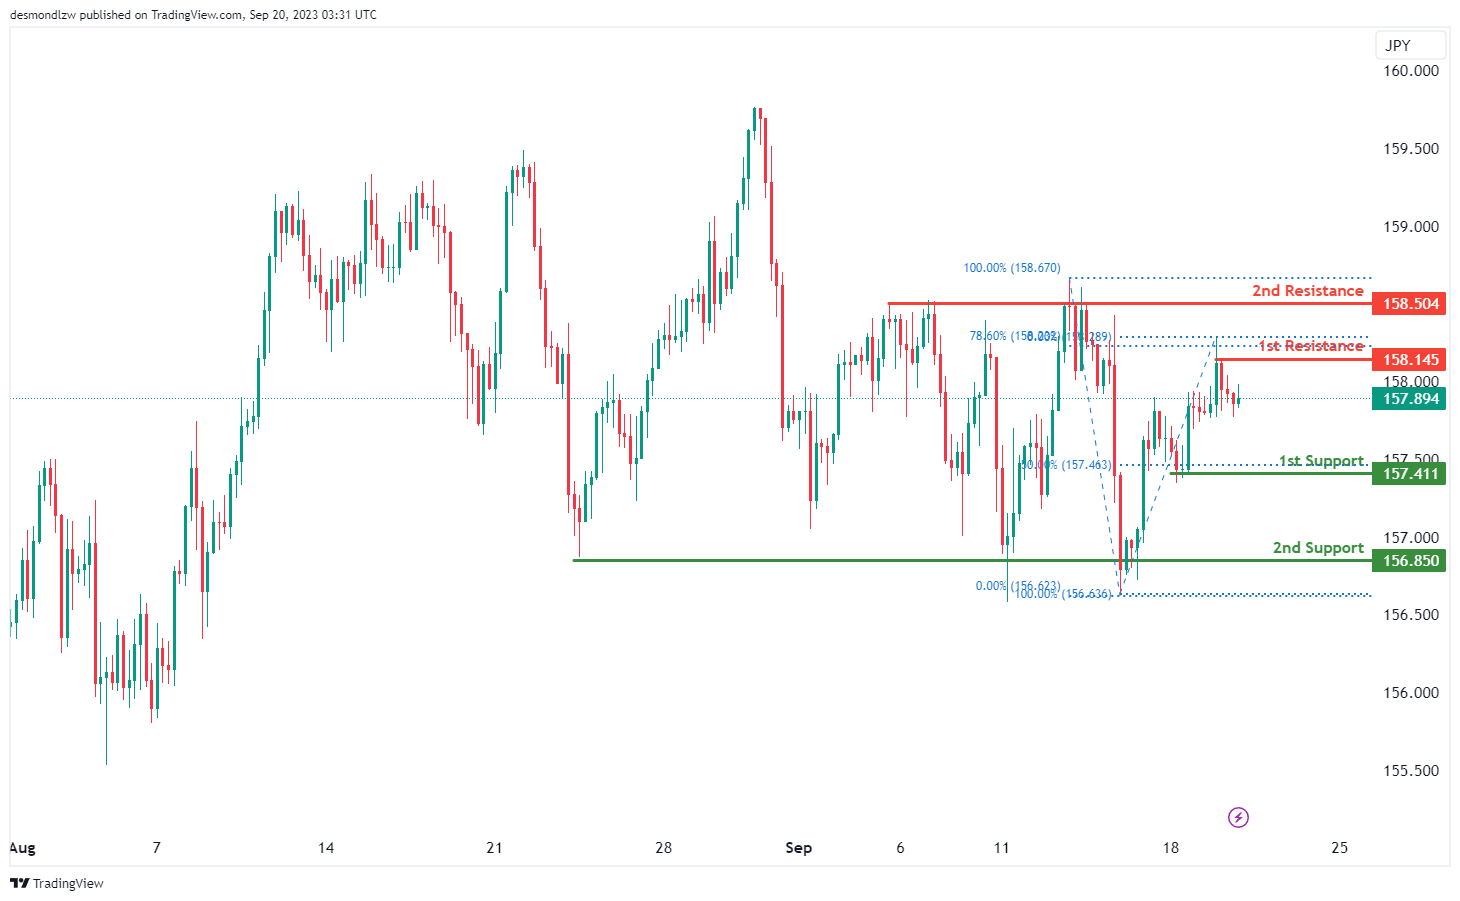
EUR/JPY:
The instrument EUR/JPY currently shows a bearish overall momentum on the chart. There’s potential for a bearish continuation towards the 1st support at 157.41, which is considered good due to its nature as a swing low support and its association with the 50% Fibonacci Retracement.
The 2nd support at 156.85 is also notable as it acts as a multi-swing low support, providing an additional level of potential support.
On the resistance side, we have the 1st resistance at 158.14, which is significant because it represents a swing high resistance and is linked to the 78.60% Fibonacci Retracement.
Meanwhile, the 2nd resistance at 158.50 is noteworthy as it functions as a multi-swing high resistance, indicating a potential barrier to price movement at this level.
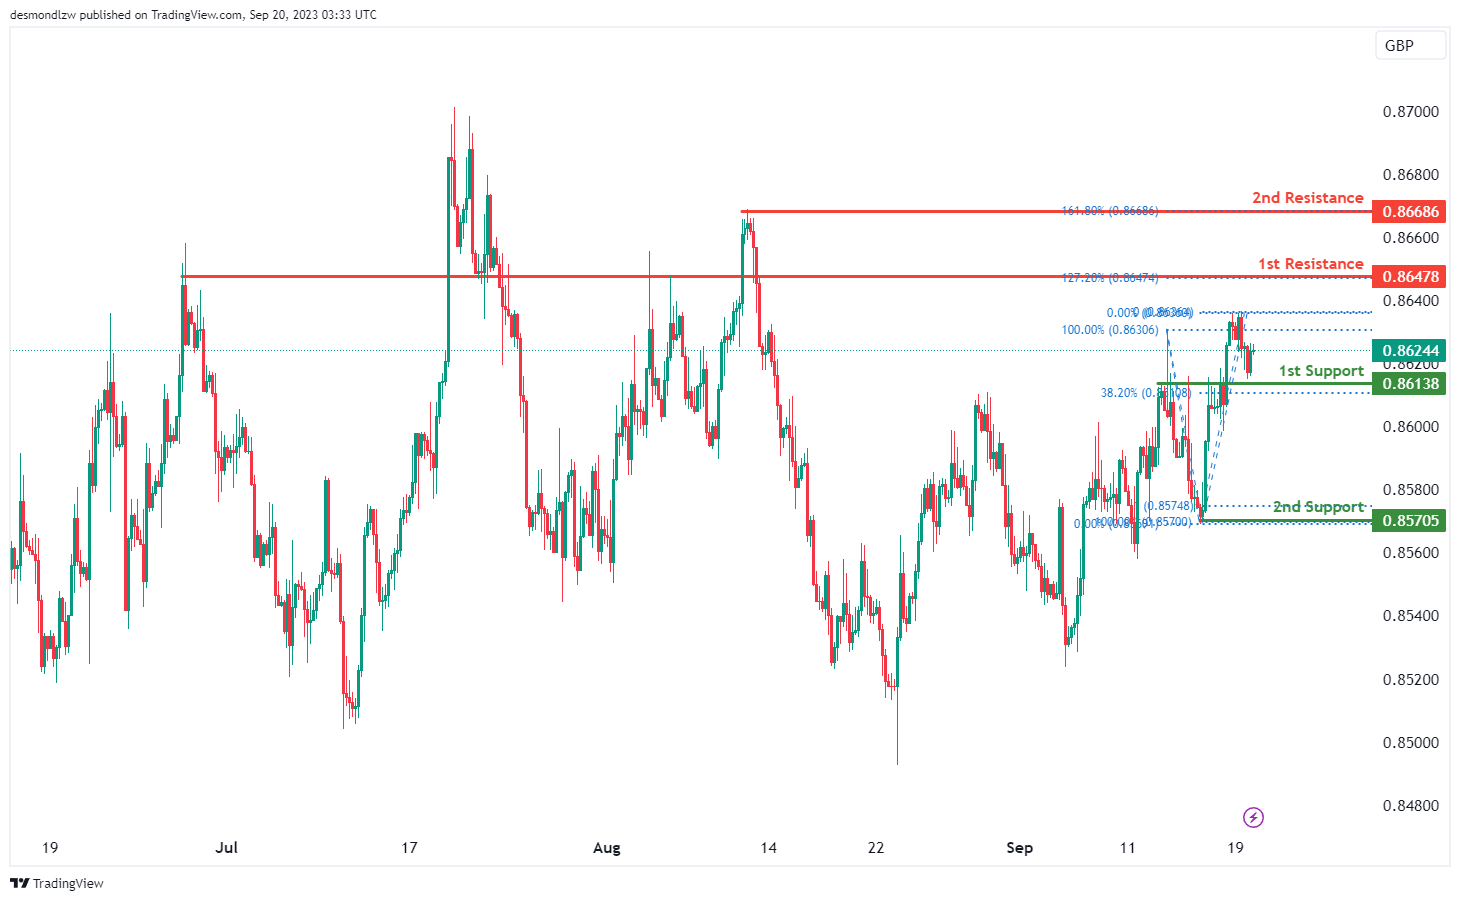
EUR/GBP:
The instrument EUR/GBP currently indicates a bullish overall momentum on the chart. There’s potential for a bullish bounce off the 1st support at 0.8613, which is considered favorable due to its nature as a pullback support and its association with the 38.20% Fibonacci Retracement. The price may then head towards the 1st resistance.
The 2nd support at 0.8570 is also noteworthy as it acts as a swing low support, providing an additional level of potential support.
On the resistance side, we have the 1st resistance at 0.8647, which is significant because it represents a pullback resistance and is associated with the 127.20% Fibonacci Extension.
Meanwhile, the 2nd resistance at 0.8668 is noteworthy as it functions as a swing high resistance and is linked to the 161.80% Fibonacci Extension, indicating a potential barrier to further bullish movement at this level.
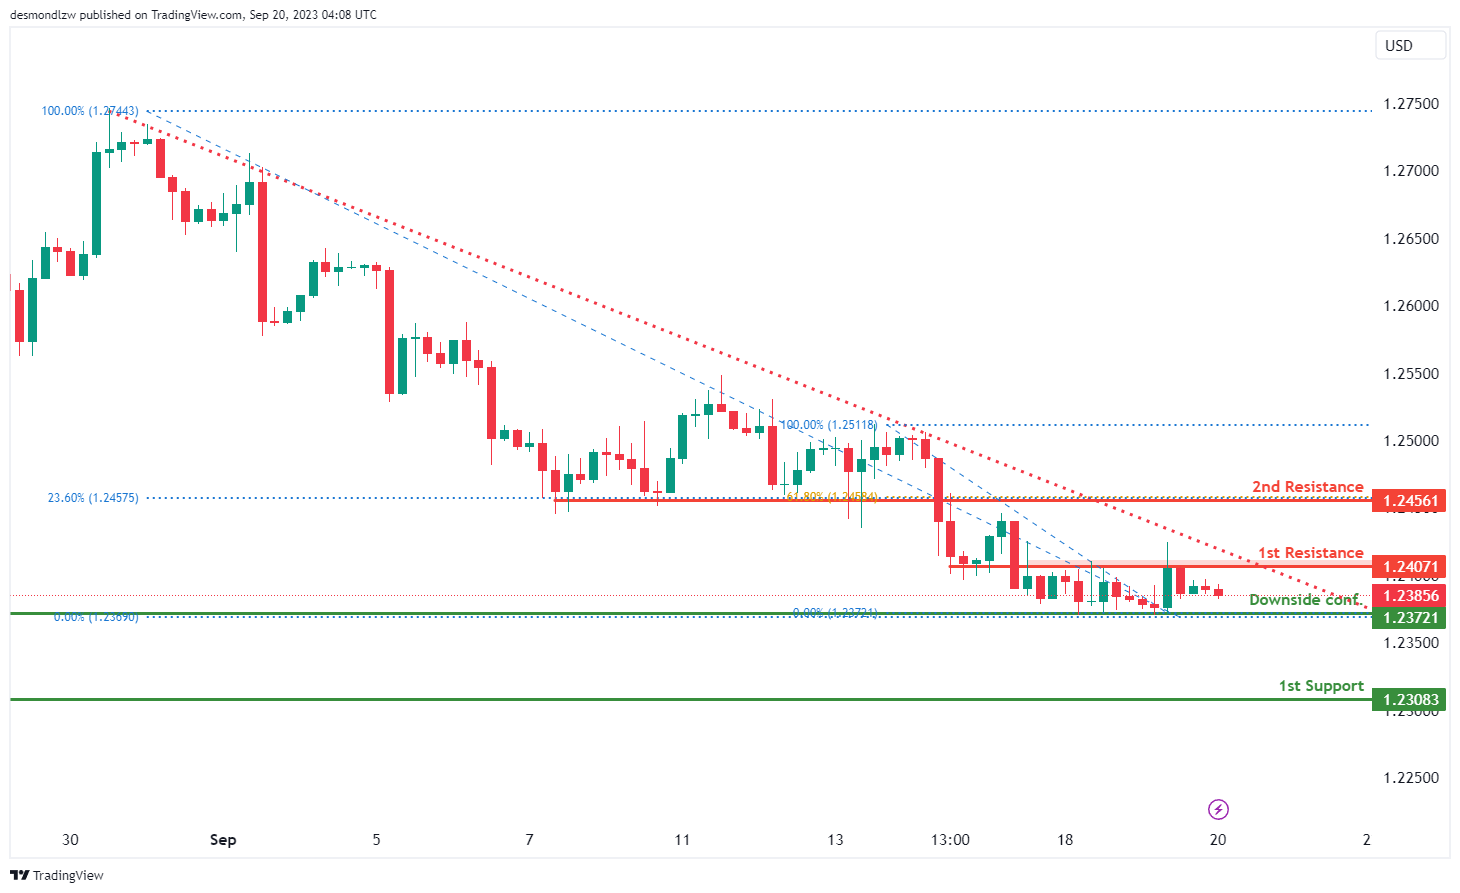
GBP/USD:
The GBP/USD chart currently exhibits a bearish overall momentum, influenced by several factors contributing to its downward trajectory. A key contributor to this bearish sentiment is the price’s position below a major descending trend line, signaling the potential for continued bearish momentum in the market. However, in the short term, there’s a potential scenario where the price may experience a temporary rise towards the 1st resistance level at 1.2407 before reversing and heading downwards towards the 1st support at 1.2305.
The 1st support at 1.2305 is a significant consideration, identified as a swing low support, highlighting its role as a key support level. Additionally, the downside confirmation level at 1.2372 is marked as an overlap support, signifying its historical relevance as a potential strong support zone.
On the resistance side, the 1st resistance at 1.2407 assumes a pivotal role, categorized as an overlap resistance, and it serves as a potential point of resistance in the short term. Beyond the 1st resistance, the 2nd resistance at 1.2456 is also identified as an overlap resistance, further emphasizing its importance. Moreover, this resistance level aligns with both the 23.60% and 61.80% Fibonacci Retracement levels, indicating a significant level of Fibonacci confluence.
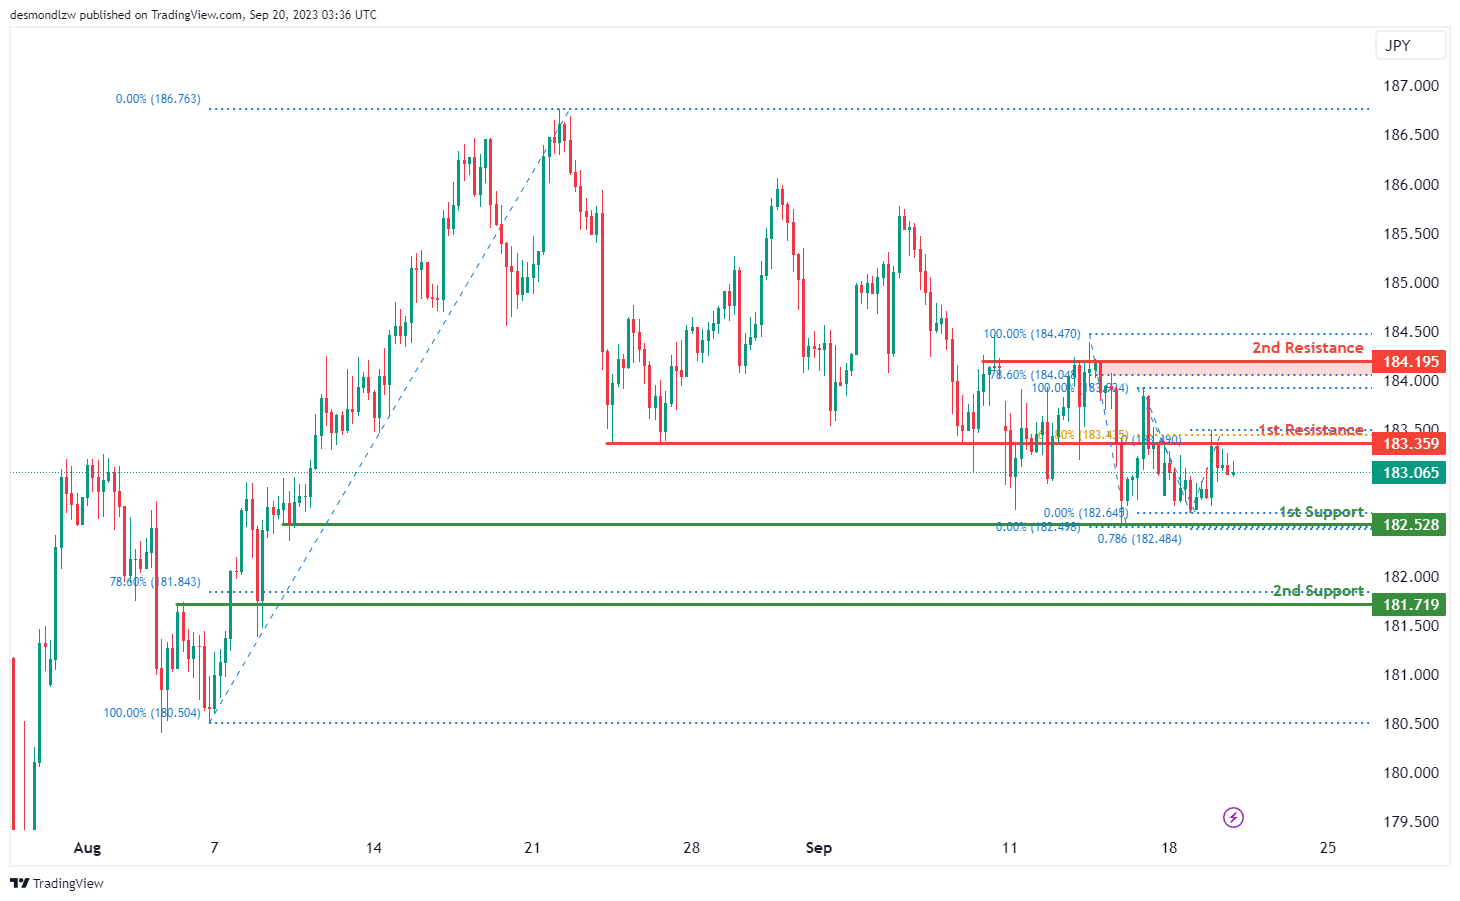
GBP/JPY:
The instrument GBP/JPY currently indicates a bearish overall momentum on the chart. There’s potential for a bearish continuation towards the 1st support at 182.52, which is considered favorable due to its nature as a multi-swing low support and its association with the 78.60% Fibonacci Projection.
The 2nd support at 181.71 is also notable as it acts as an overlap support and is associated with the 78.60% Fibonacci Retracement, providing an additional level of potential support.
On the resistance side, we have the 1st resistance at 183.35, which is significant because it represents an overlap resistance and is linked to the 61.80% Fibonacci Retracement.
Meanwhile, the 2nd resistance at 184.19 is noteworthy as it functions as a multi-swing high resistance and is associated with the 78.60% Fibonacci Retracement, suggesting a potential barrier to further bearish movement at this level.
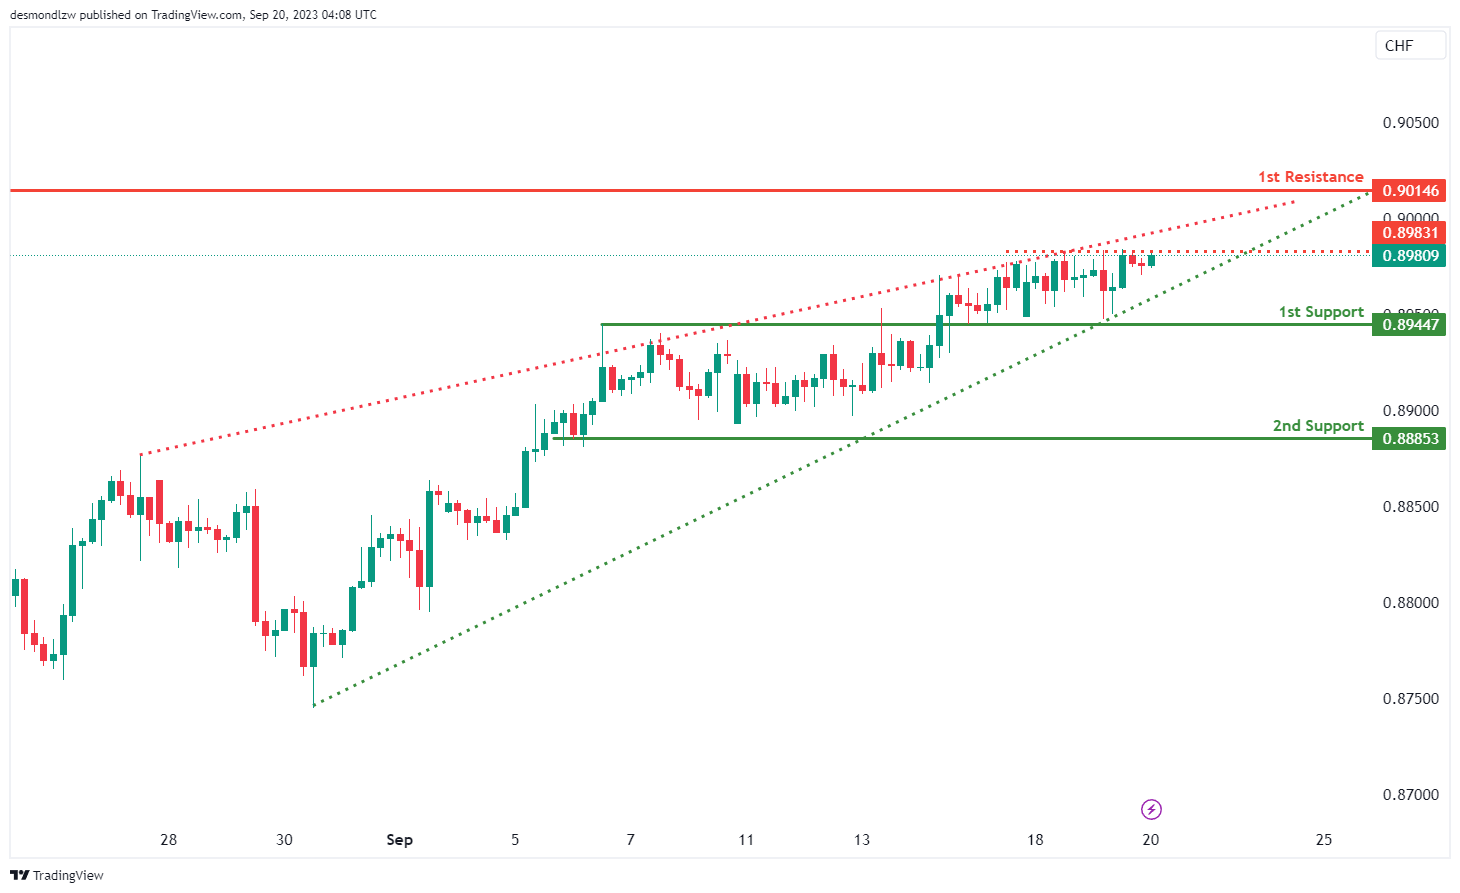
USD/CHF:
The USD/CHF chart currently displays a bearish overall momentum, with a potential scenario indicating a bearish reaction upon reaching the 1st resistance level at 0.9014, followed by a decline towards the 1st support at 0.8944.
The 1st support at 0.8944 holds significance as an overlap support, signifying its historical importance as a potential strong support zone. Similarly, the 2nd support at 0.8885 is identified as a multi-swing low support, further reinforcing its role as a key support level.
On the resistance side, the 1st resistance at 0.9014 is pivotal, characterized as a multi-swing high resistance, and it is a potential point of resistance. Additionally, there’s an intermediate resistance level at 0.8981, also characterized as a multi-swing high resistance.
Furthermore, it’s worth noting the presence of a Bearish Rising Wedge pattern on the chart. This pattern is considered bearish and typically signals an impending price drop in the downward direction.
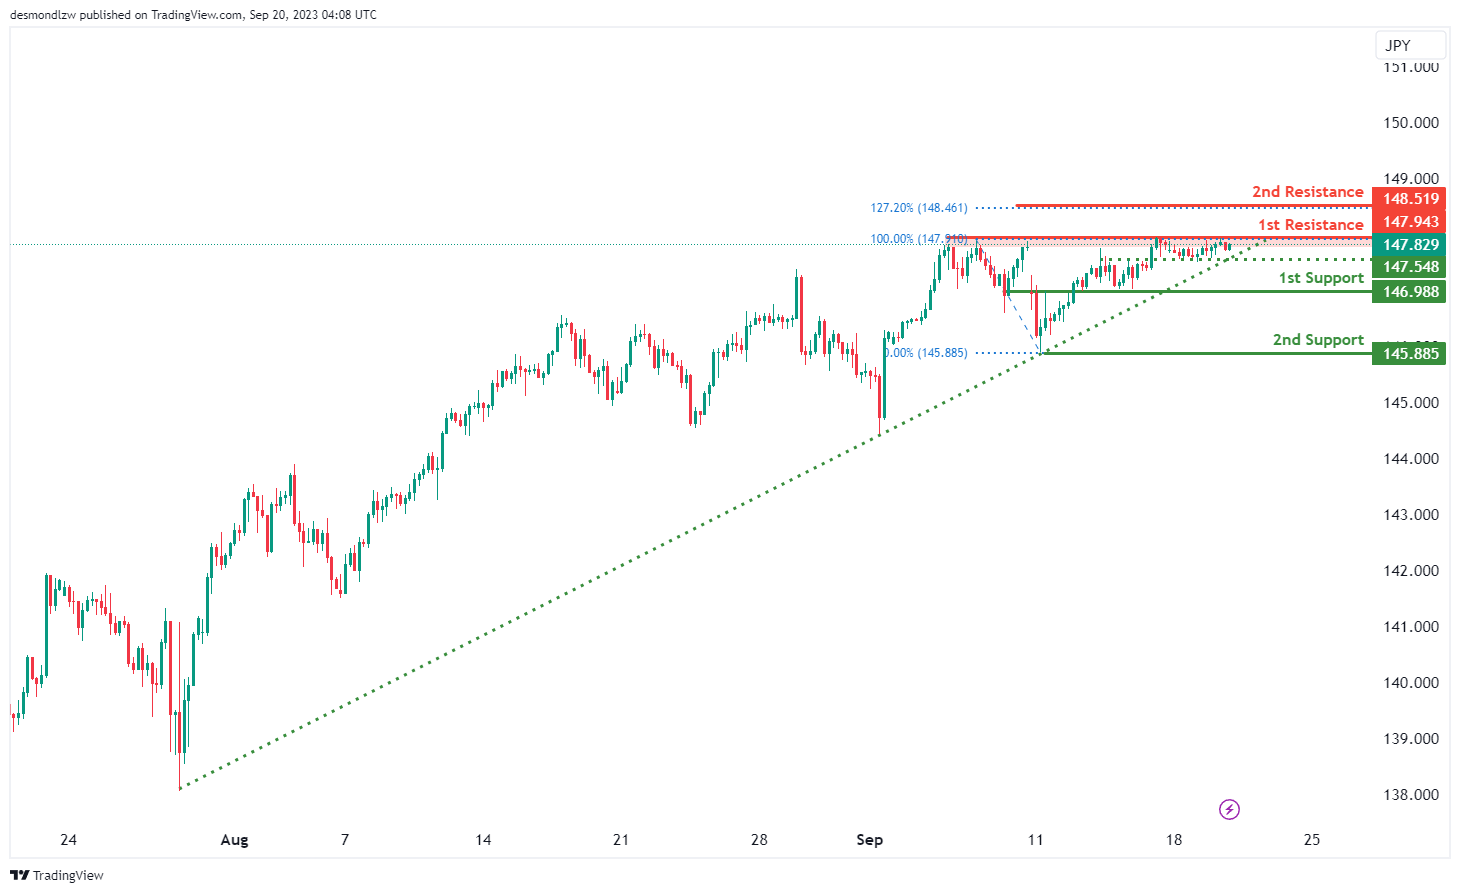
USD/JPY:
The USD/JPY chart currently maintains a bullish overall momentum, primarily due to its positioning above a major ascending trend line, suggesting the potential for further bullish movement in the market. However, there’s a plausible scenario where the price may experience a bearish reaction upon reaching the 1st resistance level at 147.94, subsequently declining towards the 1st support at 146.98.
The 1st support at 146.98 is considered significant, characterized as an overlap support, and it underscores its historical relevance as a potential strong support zone. Similarly, the 2nd support at 145.88 is identified as a swing low support, further emphasizing its role as a key support level.
On the resistance side, the 1st resistance at 147.94 assumes a pivotal role, categorized as a multi-swing high resistance, and it may serve as a point of resistance. Beyond the 1st resistance, the 2nd resistance at 148.51 is also identified as a swing high resistance and aligns with the presence of the 127.20% Fibonacci Extension, adding an extra layer of significance to its potential resistance role.
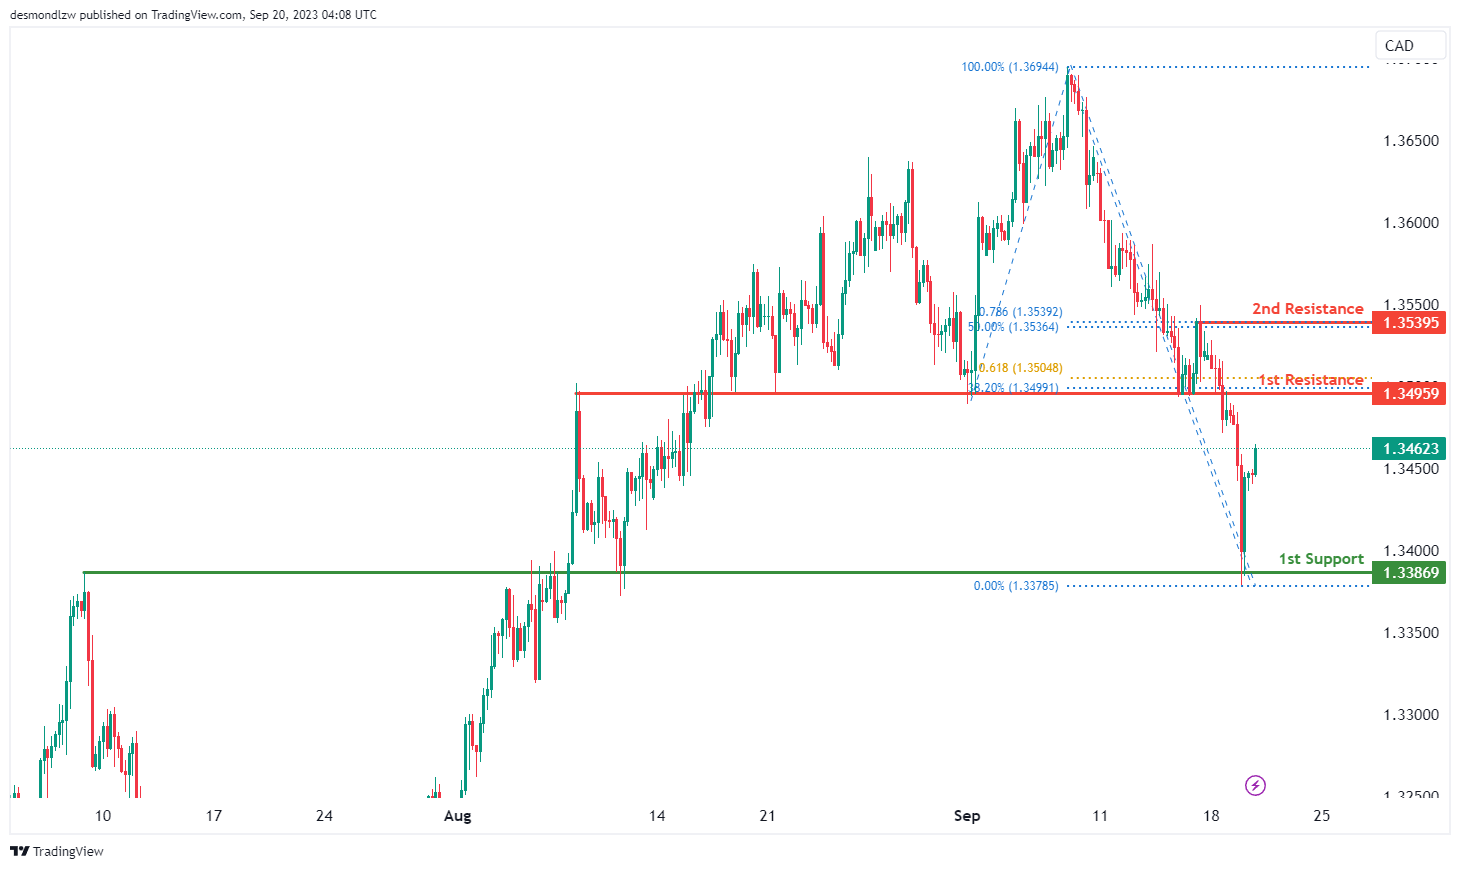
USD/CAD:
The USD/CAD chart is currently exhibiting an overall bullish momentum, indicating an upward trend with price making a bullish continuation towards the 1st resistance level.
The 1st resistance level at 1.3496 is identified as an overlap resistance that aligns with a confluence of Fibonacci levels i.e. the 38.20% retracement and the 61.80% projection levels. Additionally, the 2nd resistance level at 1.3539 is marked as a pullback resistance that also aligns with confluence of Fibonacci levels i.e. the 50% retracement and the 78.60% projection levels.
To the downside, the 1st support level at 1.3387 is identified as an overlap support, potentially acting as a strong support zone for price.
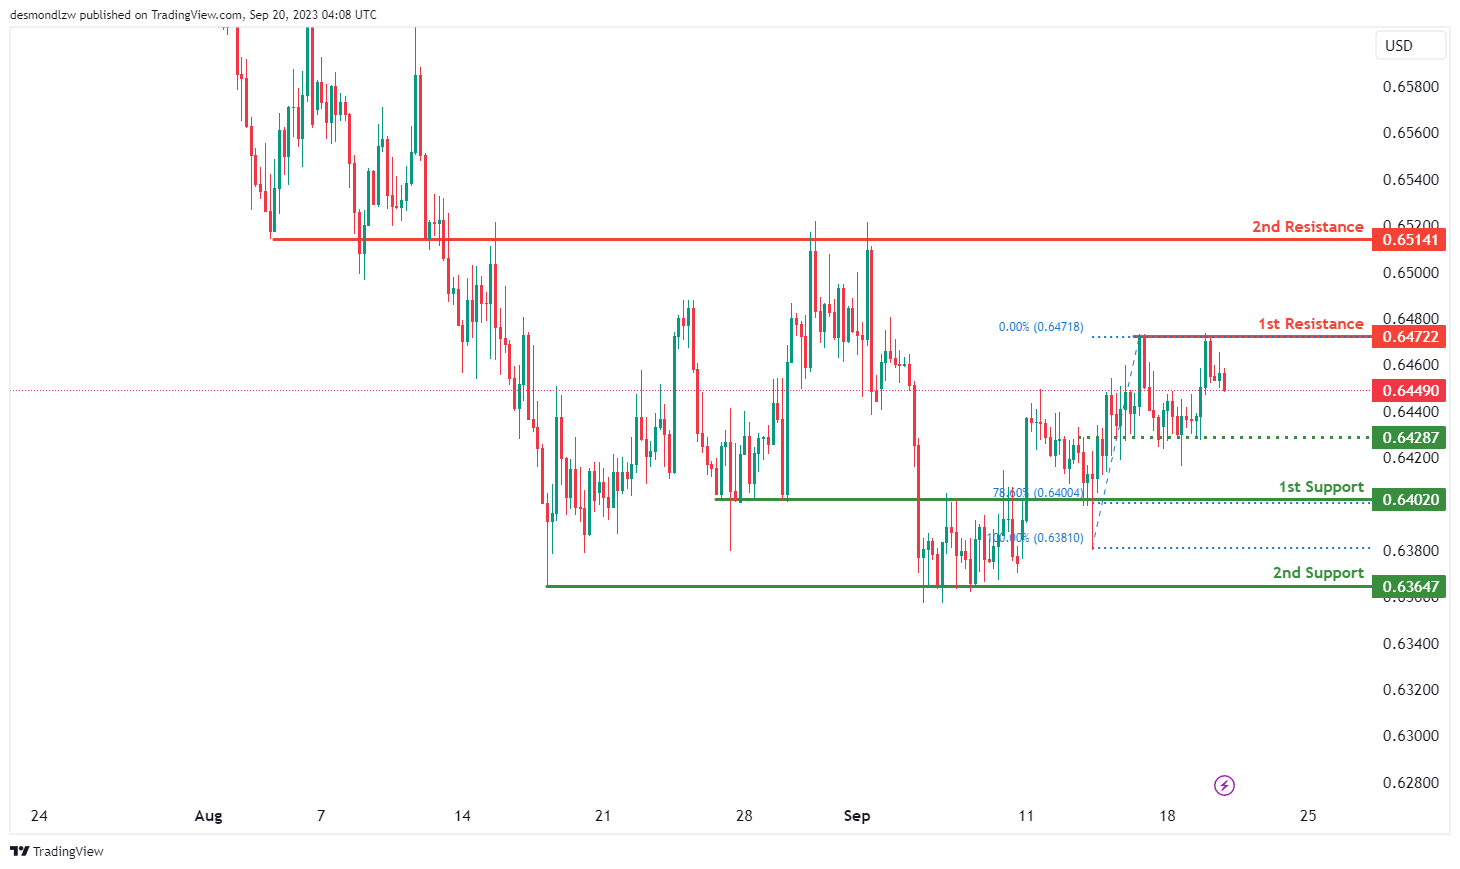
AUD/USD:
The AUD/USD chart is currently displaying an overall bearish momentum, suggesting a bearish continuation towards the 1st support level.
The intermediate support level at 0.6429 is identified as an overlap support while the 1st support level at 0.6402 is also marked as an overlap support that aligns with the 78.60% Fibonacci retracement level.
Further down, the 2nd support level at 0.6365 is identified as a pullback support, acting as a potential bounce for price.
To the upside, the 1st resistance level at 0.6472 is identified as a swing-high resistance while the 2nd resistance level at 0.6514 is noted as an overlap resistance.
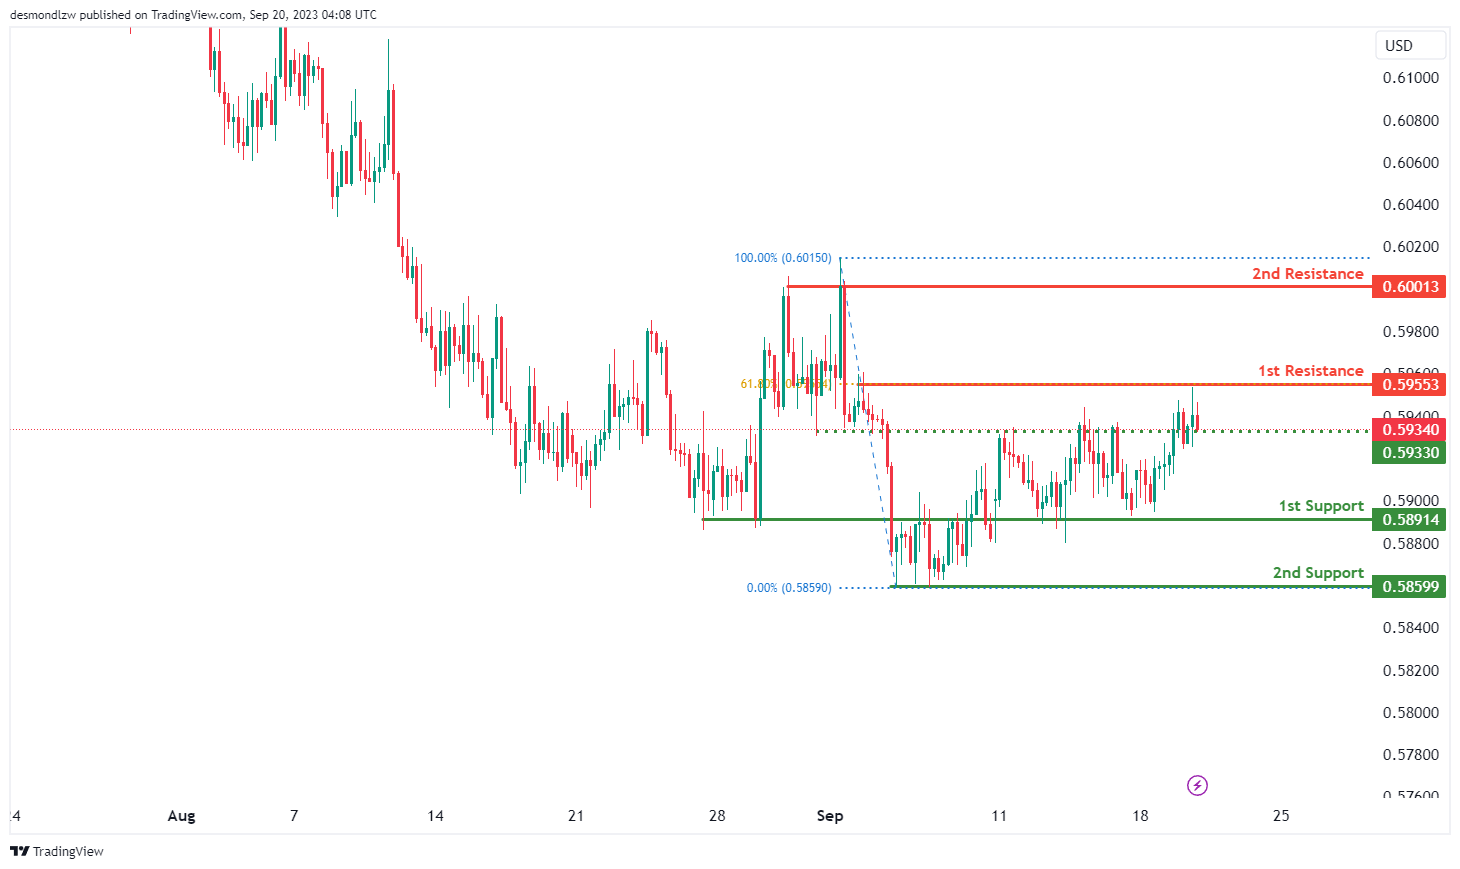
NZD/USD
The NZD/USD chart currently exhibits a weak bearish momentum, potentially dropping towards the 1st support level should price break below the intermediate support level at 0.5933 which is identified as an overlap support.
The 1st support level at 0.5891 is identified as an overlap support while the 2nd support level at 0.5859 is marked as pullback.
The 1st resistance level at 0.5955 is identified as a pullback resistance that aligns with the 61.80% Fibonacci retracement level. Further up, the 2nd resistance level at 0.6001 is marked as a multi-swing-high resistance.
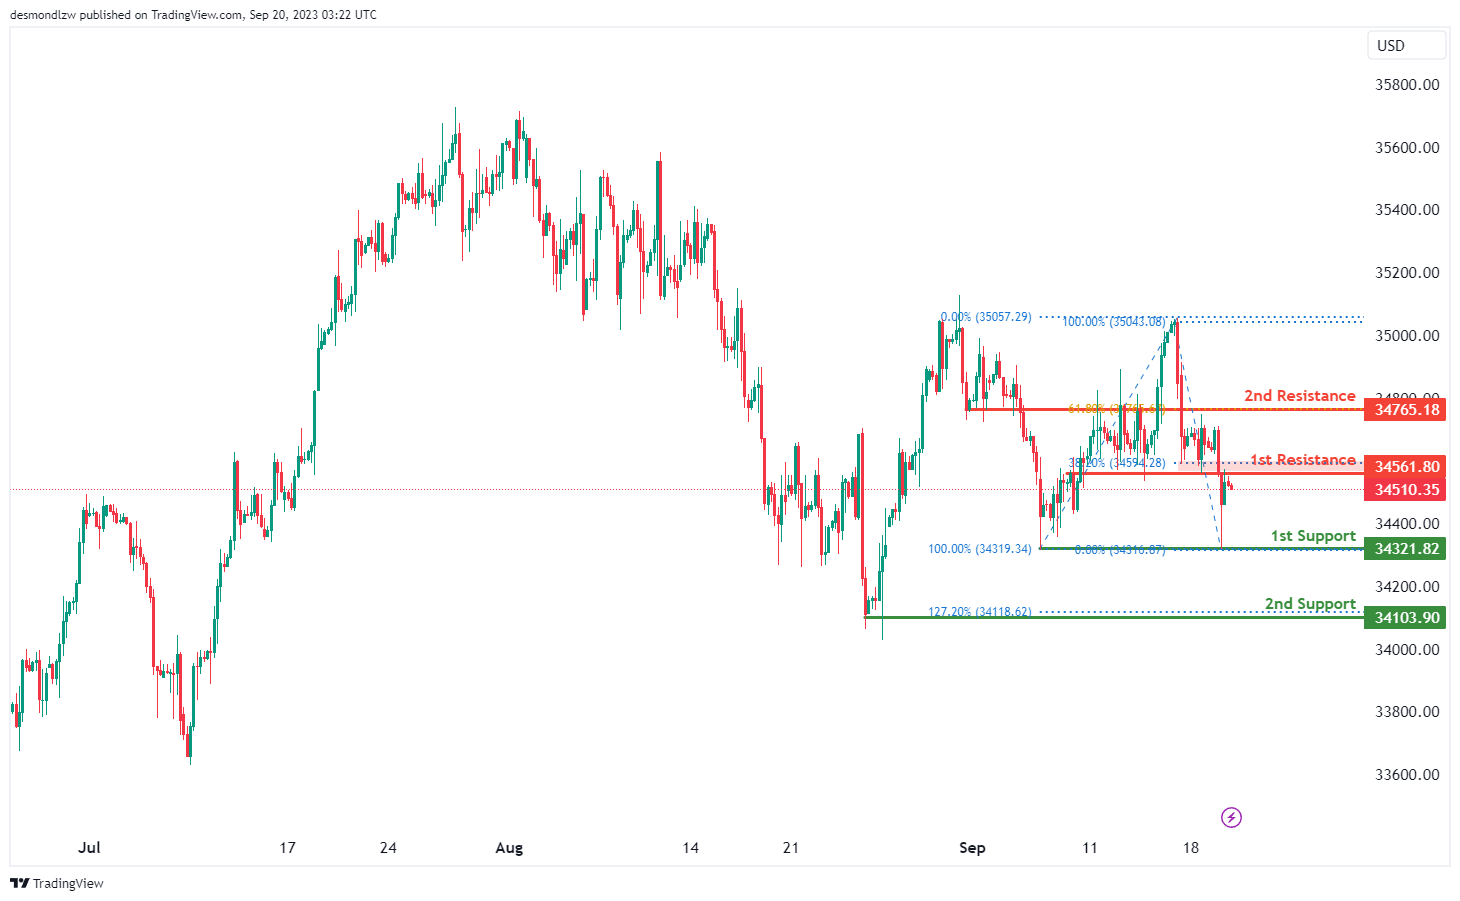
DJ30:
The instrument DJ30 is currently showing a bearish overall momentum on the chart. There’s potential for a bearish continuation towards the 1st support at 34321.82, which is considered good due to its status as a multi-swing low support.
The 2nd support at 34103.90 is also notable as it acts as a swing low support and is associated with the 127.20% Fibonacci Extension, making it a strong level of potential support.
On the resistance side, we have the 1st resistance at 34561.80, which is significant because it represents an overlap resistance and is also associated with the 38.20% Fibonacci Retracement.
Meanwhile, the 2nd resistance at 34765.18 is noteworthy as it functions as a pullback resistance and is linked to the 61.80% Fibonacci Retracement, making it a key level of potential resistance.
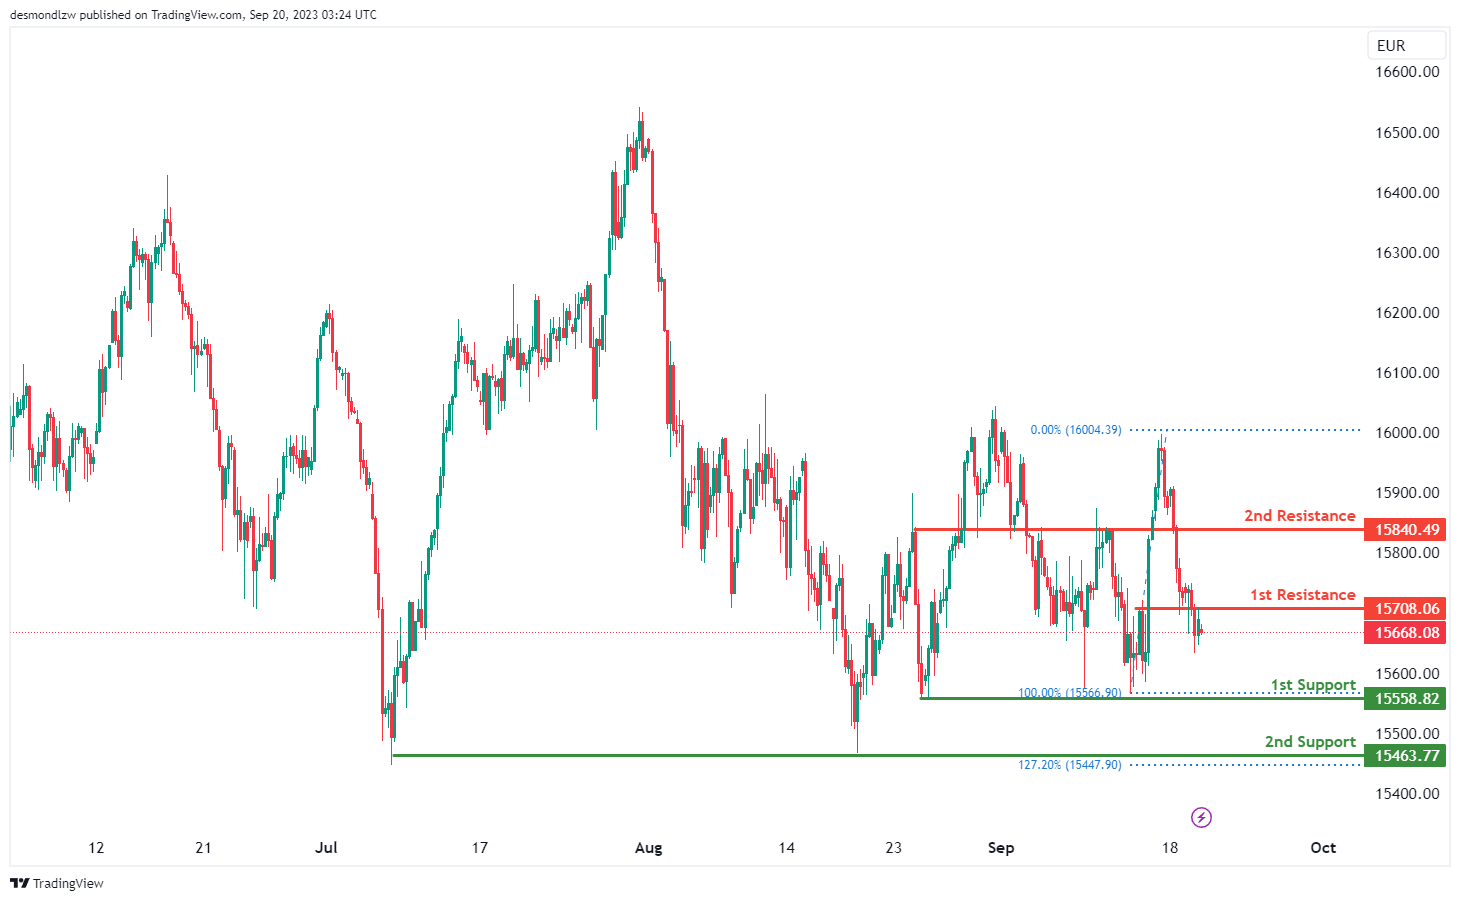
GER30:
The instrument GER30 currently exhibits a bearish overall momentum on the chart. There’s potential for a bearish continuation towards the 1st support at 15558.82, which is considered good due to its status as a multi-swing low support.
The 2nd support at 15463.77 is also notable as it acts as a multi-swing low support and is associated with the 127.20% Fibonacci Extension, making it a strong level of potential support.
On the resistance side, we have the 1st resistance at 15708.06, which is significant because it represents a pullback resistance.
Meanwhile, the 2nd resistance at 15840.49 is noteworthy as it functions as another pullback resistance, indicating potential resistance at this level.
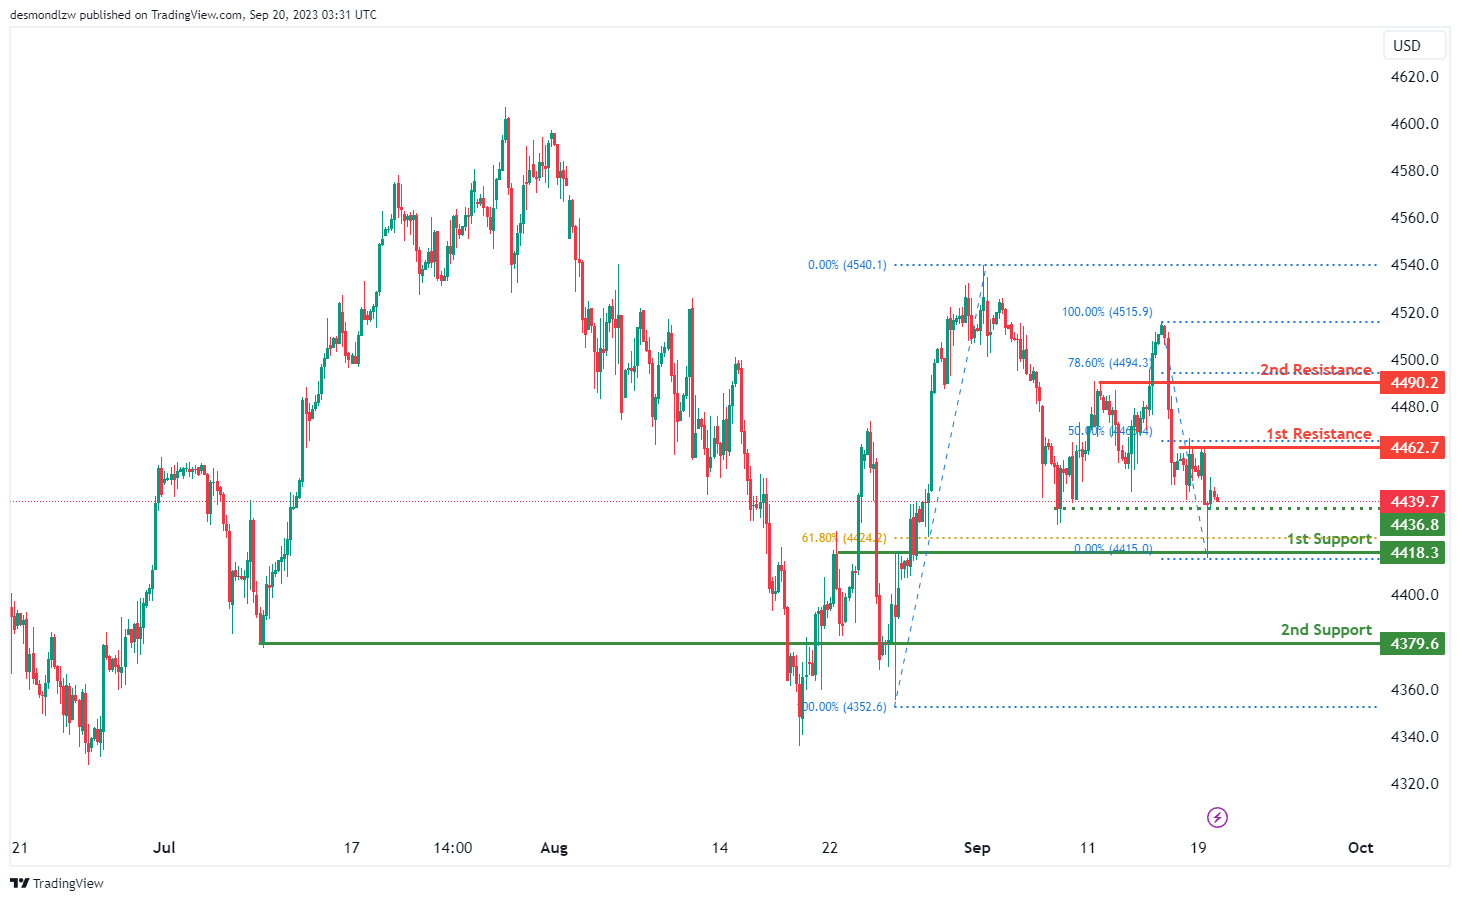
US500
The instrument US500 is currently exhibiting a bearish overall momentum on the chart. There’s potential for a bearish continuation towards the 1st support at 4418.3, which is considered good due to its nature as a pullback support and its association with the 61.80% Fibonacci Retracement.
The 2nd support at 4379.6 is also notable as it acts as an overlap support, providing an additional level of potential support.
On the resistance side, we have the 1st resistance at 4462.7, which is significant because it represents a swing high resistance and is linked to the 50% Fibonacci Retracement.
Meanwhile, the 2nd resistance at 4490.2 is noteworthy as it functions as a pullback resistance and is associated with the 78.60% Fibonacci Retracement.
Additionally, there is an intermediate support at 4436.8, which is considered good due to its status as a multi-swing low support, providing an extra layer of potential support.
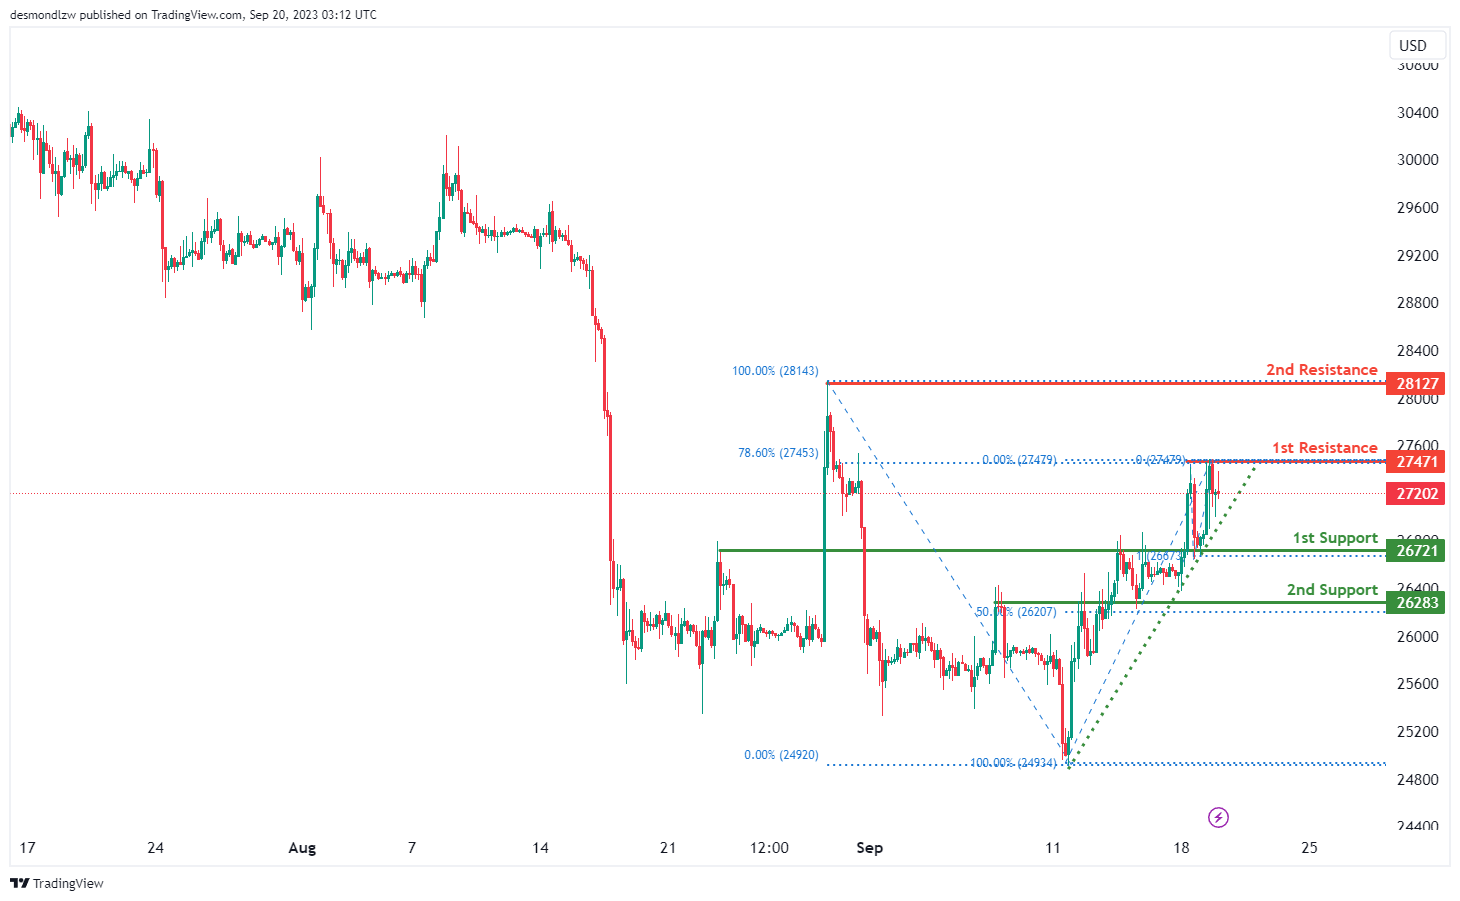
BTC/USD:
For BTC/USD, the overall momentum of the chart is currently bullish, and factors contributing to this momentum include the price being above a major ascending trend line, suggesting further bullish potential.
The potential scenario you’ve mentioned is for a bullish continuation towards the 1st resistance level at 27471. This resistance level is significant as it aligns with a multi-swing high resistance, indicating a potential barrier for further upward movement.
If the bullish momentum continues, the 2nd resistance level at 28127 is another level to watch. This resistance represents a swing high resistance and could act as a significant hurdle if the price attempts to move higher.
On the downside, the 1st support level at 26721 is a key level to consider. It is characterized as an overlap support and coincides with the 100% Fibonacci Projection, making it a strong potential support zone.
Additionally, the 2nd support level at 26283 aligns with an overlap support and the 50% Fibonacci Retracement, making it another important support area.
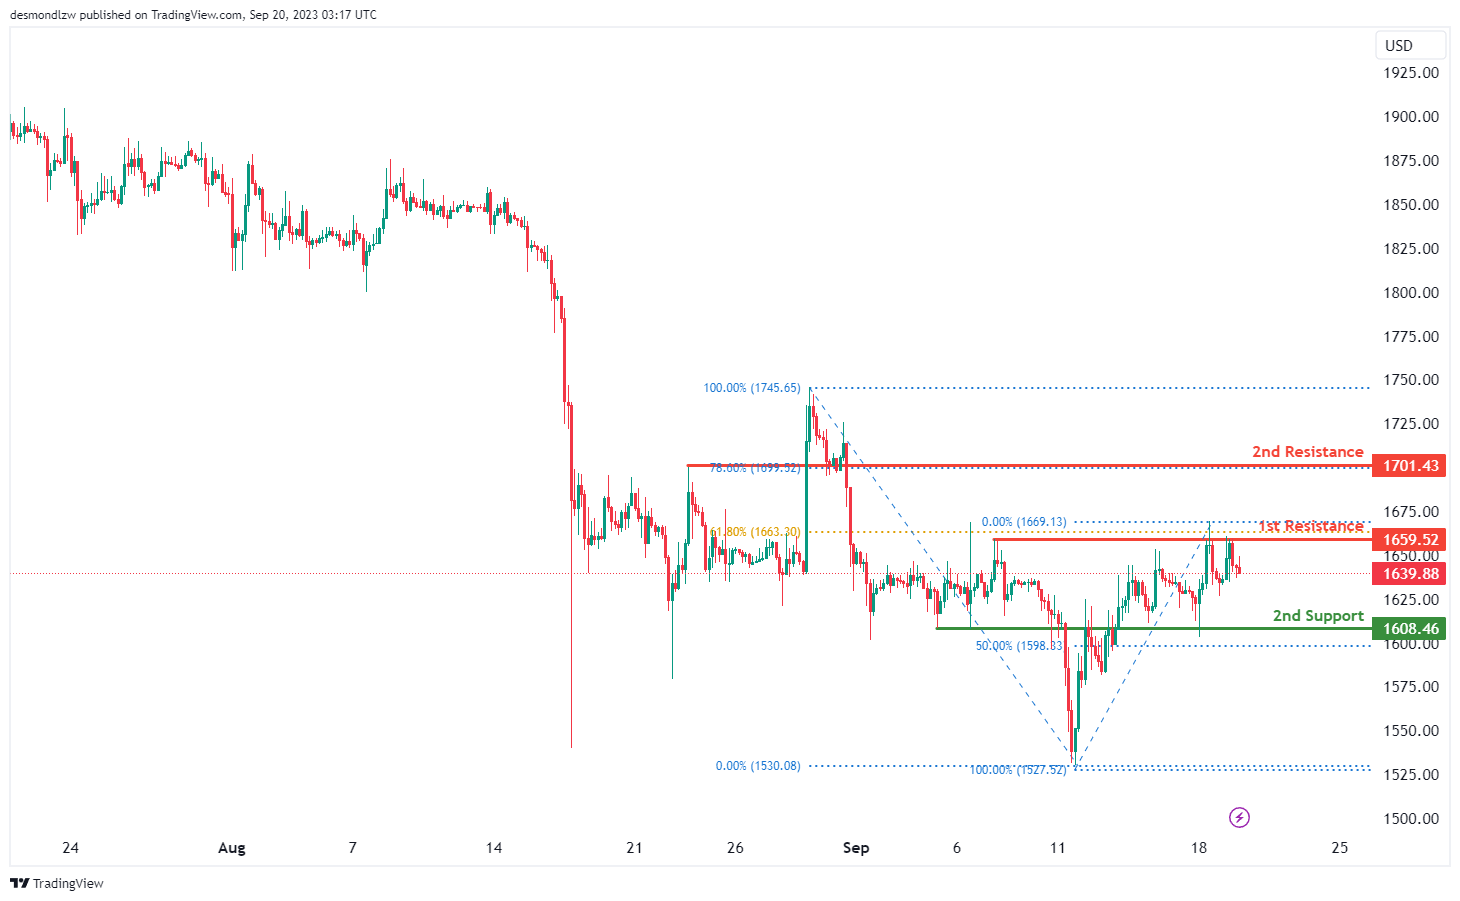
ETH/USD:
The instrument ETH/USD currently shows a bearish overall momentum on the chart. There’s potential for a bearish continuation towards the 1st support at 1608.46, which is considered good due to its overlap support at 50% Fibonacci Retracement. The 2nd support at 1540.15 is also notable for being a multi-swing low support.
On the resistance side, we have the 1st resistance at 1659.52, which is significant because it represents a multi-swing high resistance at 61.80% Fibonacci Retracement. Meanwhile, the 2nd resistance at 1701.43 is noteworthy as it acts as a pullback resistance at 78.60% Fibonacci Retracement.
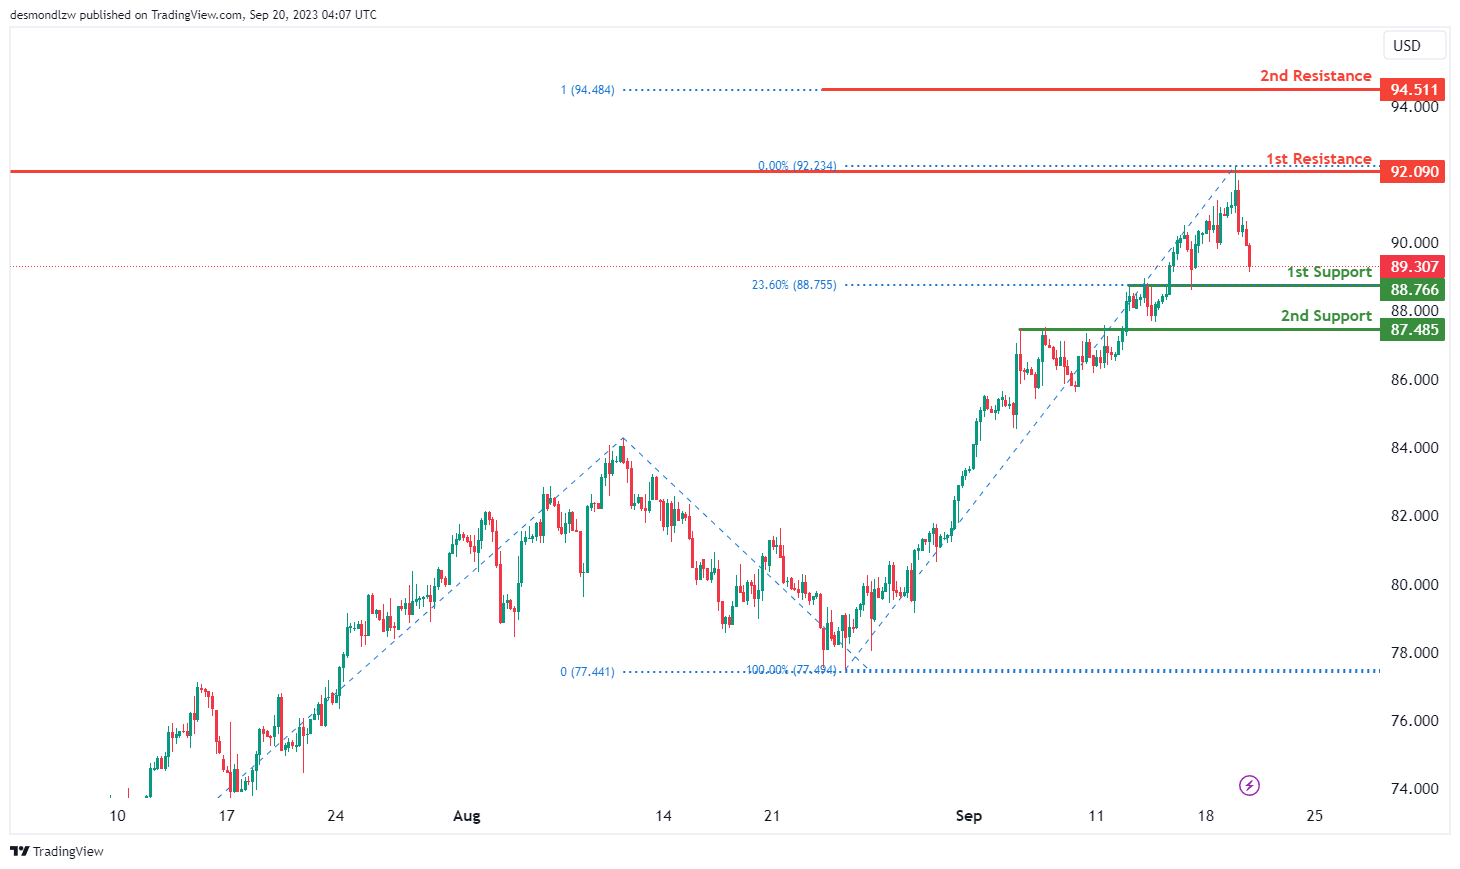
WTI/USD:
The WTI (West Texas Intermediate) chart currently exhibits a weak bullish momentum with low confidence. The short-term price action could involve a drop towards the 1st support level before potentially bouncing off this support to climb higher.
The 1st support level at 88.77 is identified as an overlap support that aligns with the 23.60% Fibonacci retracement level while the 2nd support level at 87.49 is also marked as an overlap support.
To the upside, the 1st resistance level at 92.09 is identified as a recent swing-high resistance. Further up, the 2nd resistance level at 94.51 is noted as a resistance that aligns with the 100.00% Fibonacci projection level.
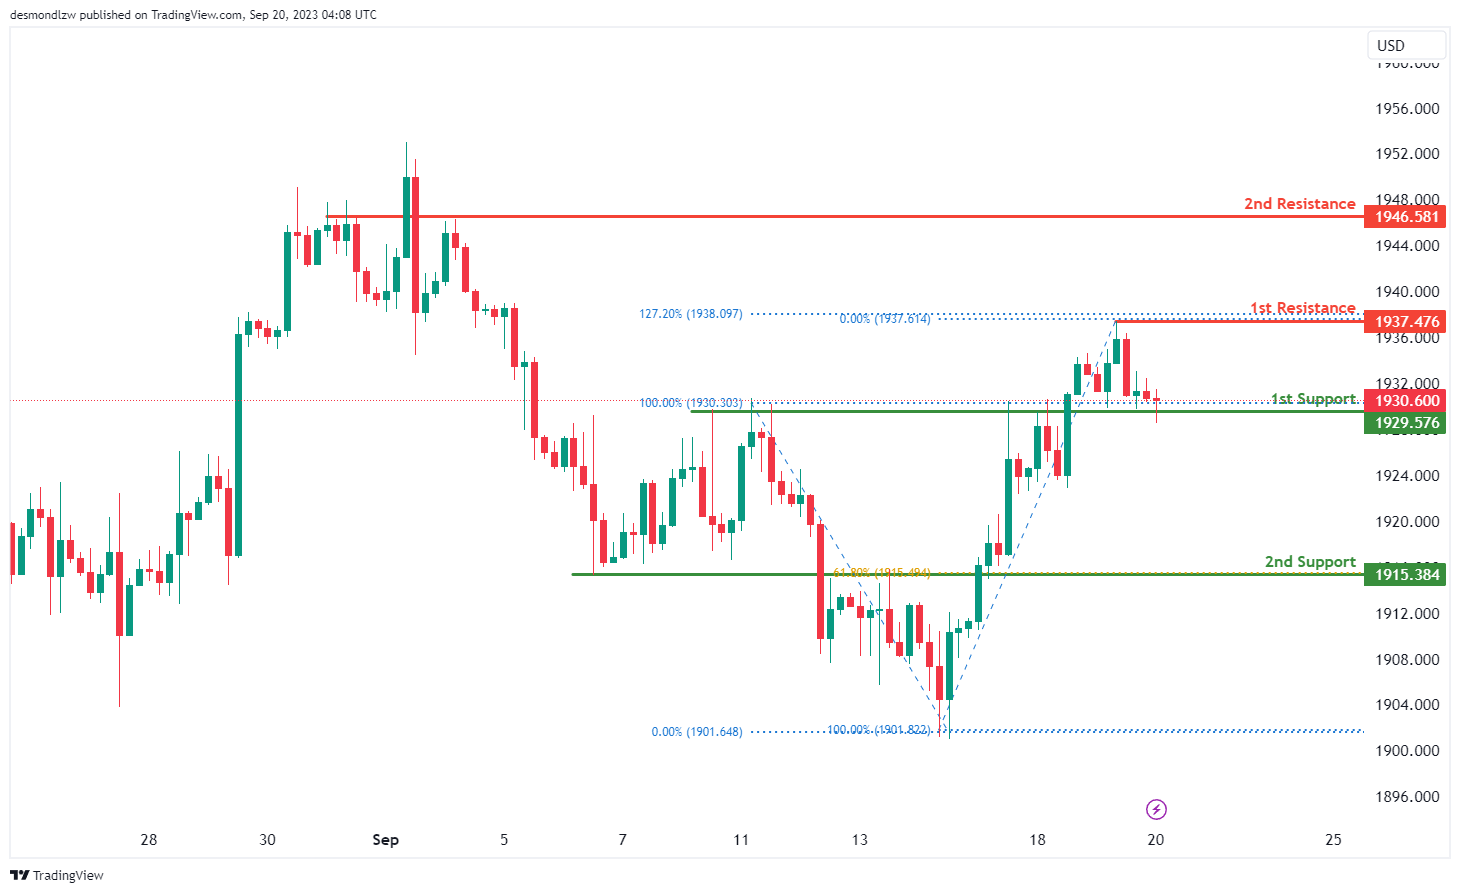
XAU/USD (GOLD):
The XAU/USD chart currently exhibits a bullish overall momentum, presenting a potential scenario where the price may experience a bullish bounce upon reaching the 1st support level at 1929.57 and subsequently advance towards the 1st resistance at 1937.47.
The 1st support at 1929.57 is considered significant, characterized as an overlap support, and it carries historical relevance as a potential strong support zone. Additionally, the 2nd support at 1915.38 is identified as an overlap support and aligns with the presence of the 61.80% Fibonacci Retracement, further emphasizing its role as a key support level.
On the resistance side, the 1st resistance at 1937.47 plays a pivotal role, categorized as a swing high resistance and associated with the 127.20% Fibonacci Extension, indicating its potential as a point of resistance. Beyond the 1st resistance, the 2nd resistance at 1946.58 is also characterized as an overlap resistance, further highlighting its significance.


