
DXY:
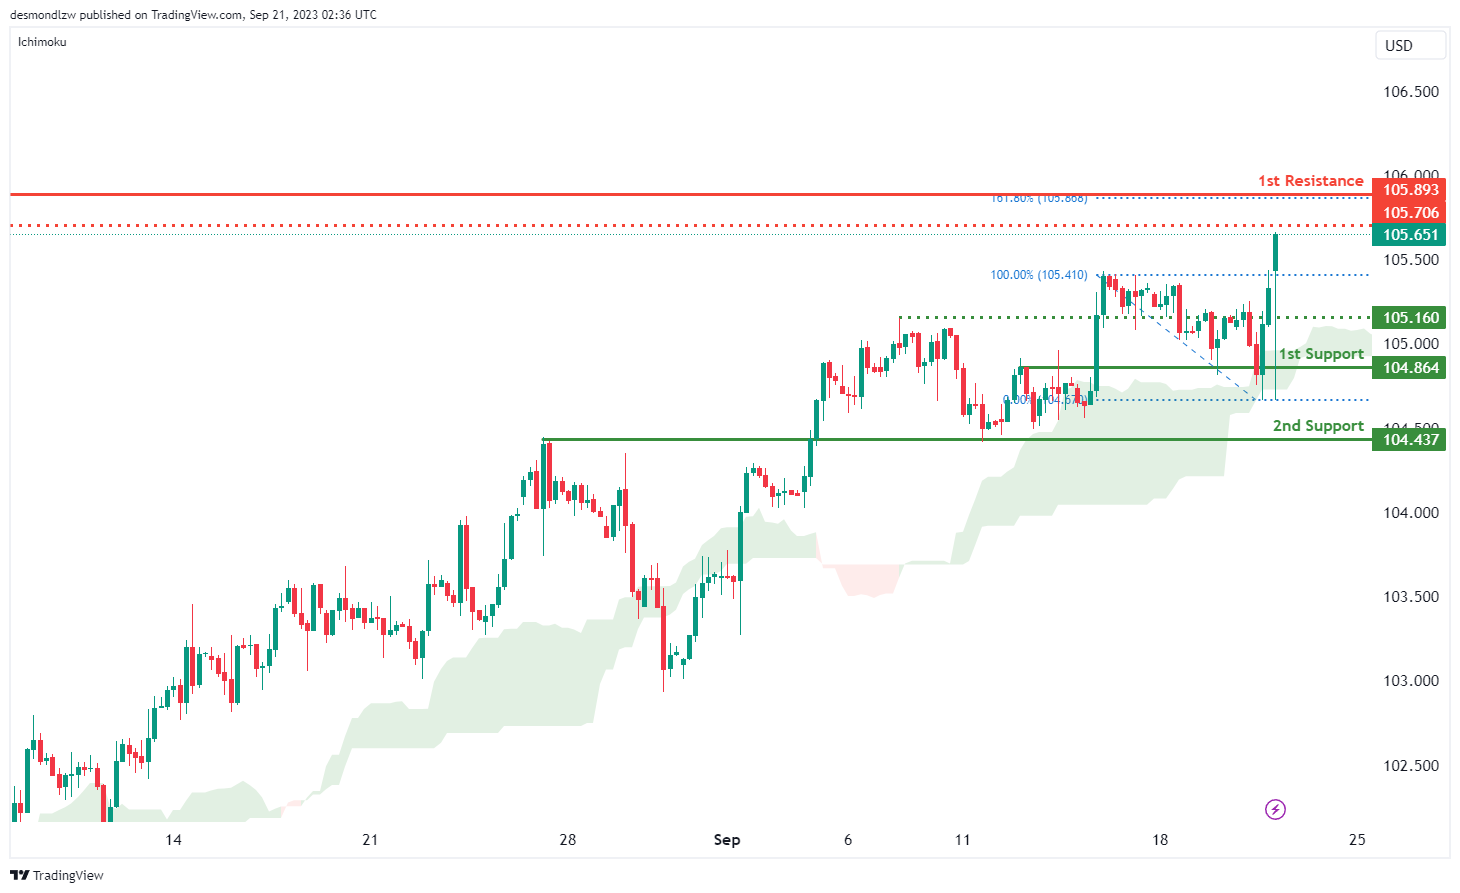
The DXY (US Dollar Index) chart currently exhibits a bullish overall momentum, with several factors contributing to its upward trajectory. A significant factor in this bullish sentiment is the price’s position above the bullish Ichimoku cloud, indicating the potential for further bullish movement.
In this context, there’s a plausible scenario where the price may experience a bullish continuation towards the 1st resistance level at 105.89.
The 1st support at 104.86 is of notable importance, characterized as an overlap support, signifying its historical relevance as a potential strong support zone. Similarly, the 2nd support at 104.43 is identified as an overlap support, further reinforcing its role as a key support level.
On the resistance side, the 1st resistance at 105.89 assumes a pivotal role, categorized as a swing high resistance, and it aligns with the presence of the 161.80% Fibonacci Extension, highlighting its potential as a point of resistance. Additionally, there’s an intermediate resistance level at 105.65, marked as a swing high resistance, further emphasizing its significance.
EUR/USD:
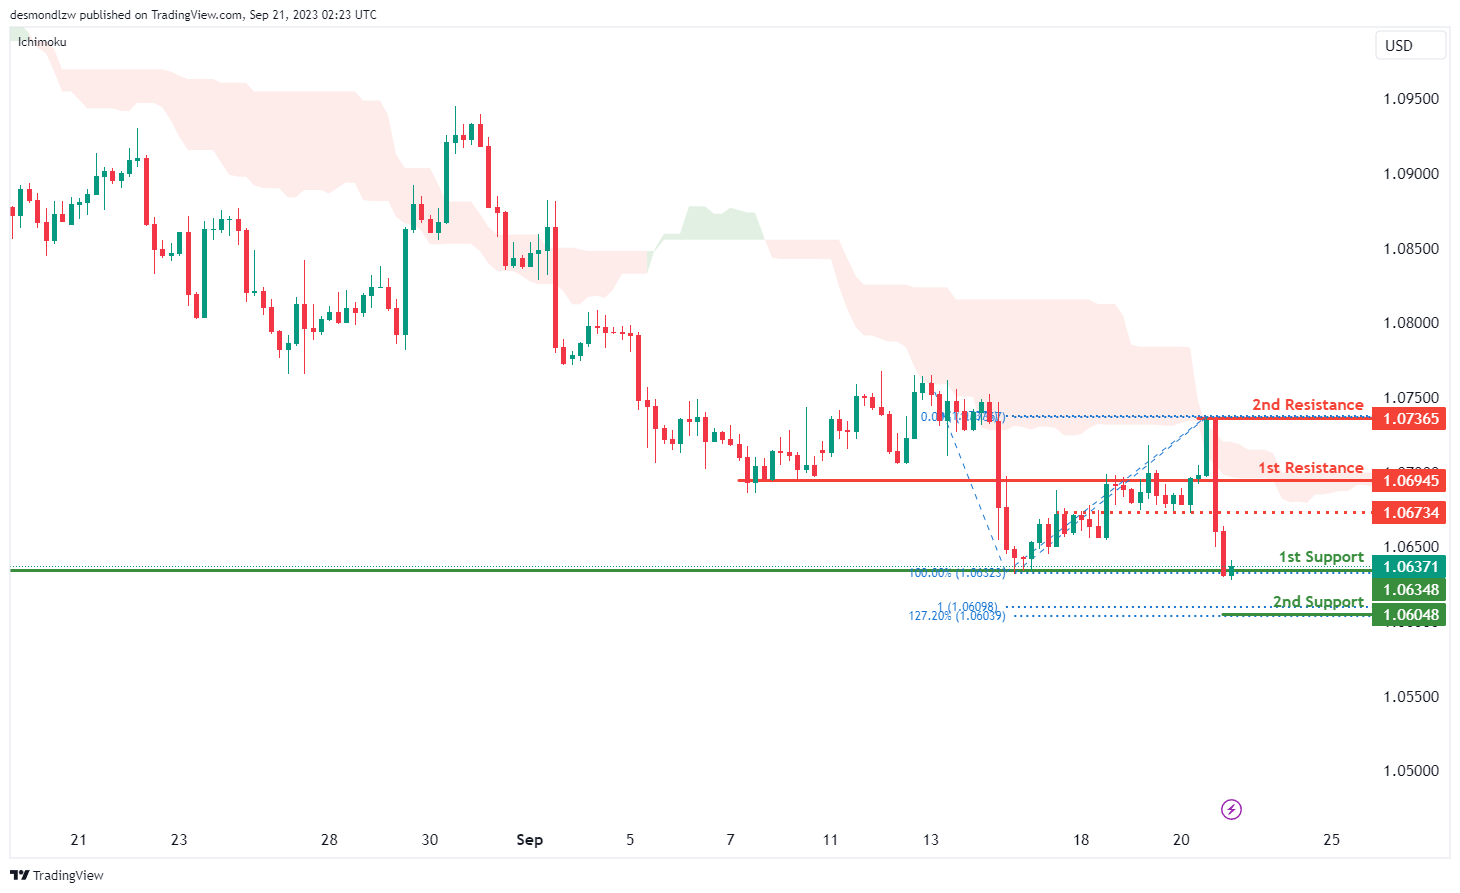
The EUR/USD chart currently maintains a bearish overall momentum, with several factors contributing to its downward trajectory. One key factor influencing this bearish sentiment is the price’s position below the bearish Ichimoku cloud, indicating the presence of bearish market conditions.
However, there’s a potential scenario where the price may experience a short-term rise towards the 1st resistance level at 1.0694 before reversing and heading downwards towards the 1st support at 1.0634.
The 1st support at 1.0634 is of significant importance, identified as a multi-swing low support, and it aligns with the presence of the 127.20% Fibonacci Extension, underscoring its role as a strong support zone. Similarly, the 2nd support at 1.0604 is characterized as an overlap support, further emphasizing its potential as a key support level. This support level also aligns with the presence of the 161.80% Fibonacci Extension and the 100% Fibonacci Projection, indicating a high degree of Fibonacci confluence.
On the resistance side, the 1st resistance at 1.0694 plays a pivotal role, categorized as a pullback resistance, and it may serve as a point of resistance in the short term. Beyond the 1st resistance, the 2nd resistance at 1.0736 is identified as a swing high resistance, further highlighting its significance. Additionally, there’s an intermediate resistance level at 1.0673, marked as a pullback resistance.
EUR/JPY:
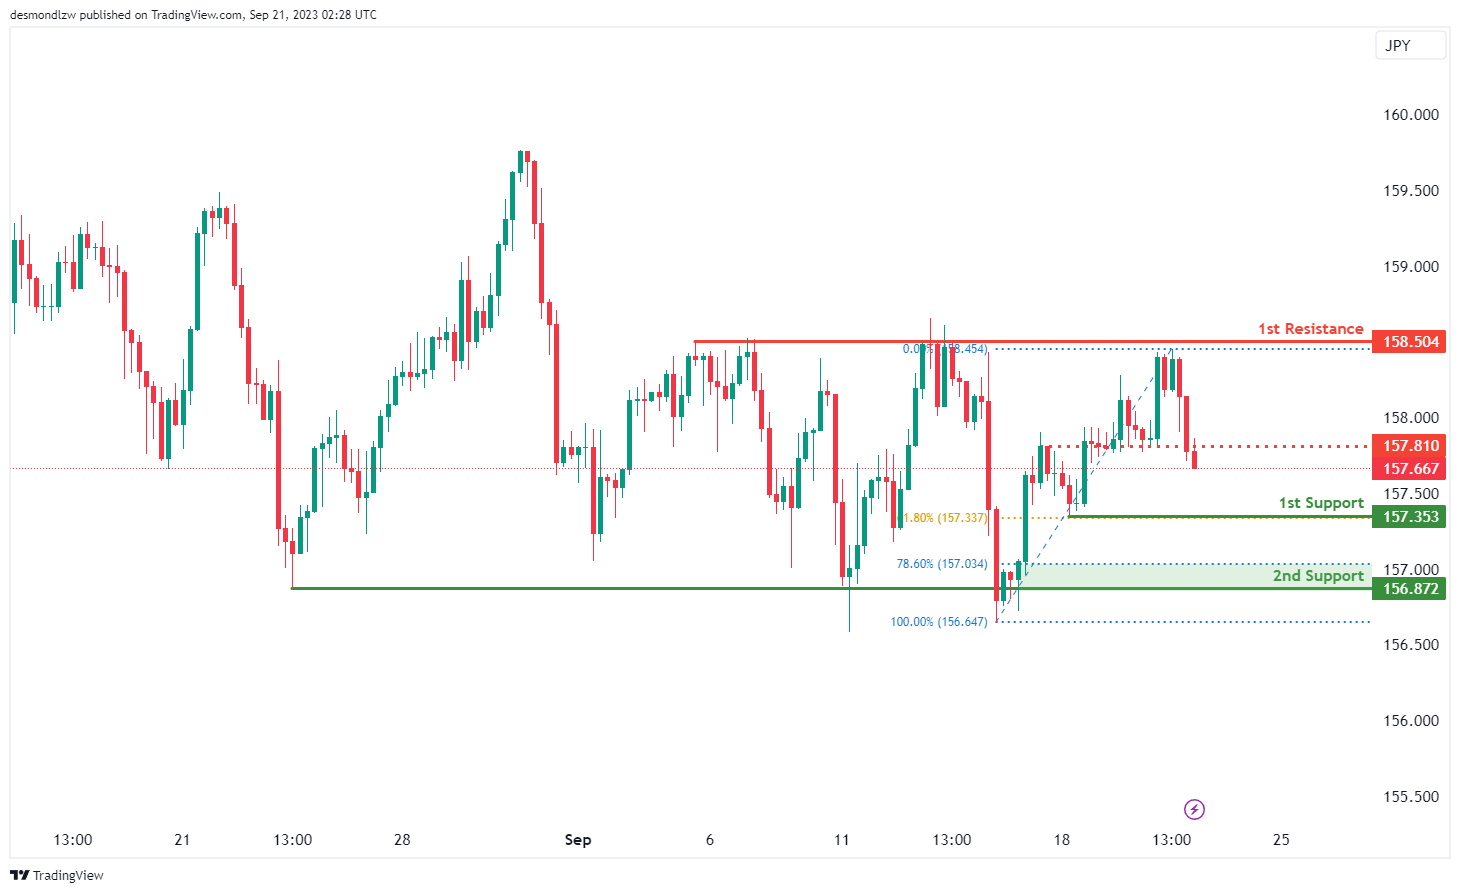
The EUR/JPY chart currently exhibits a bearish overall momentum, with several technical factors contributing to this downward sentiment. Based on the analysis, there is a potential scenario where the price could continue its bearish movement towards the 1st support level.
The 1st support level, located at 157.35, is considered a strong potential support zone. This support level is reinforced by the presence of the 61.80% Fibonacci Retracement, indicating its significance as a potential area where price might find support. Additionally, the 2nd support at 156.87 is identified as a multi-swing low support and is further supported by the 78.60% Fibonacci Retracement, highlighting its potential importance as a support level.
On the resistance side, the 1st resistance level at 158.50 is categorized as a multi-swing high resistance. Traders and investors should monitor this level closely, as it may act as a point of resistance within the ongoing bearish trend. Additionally, the intermediate resistance at 157.81 is marked as a pullback resistance, further emphasizing its potential significance.
EUR/GBP:
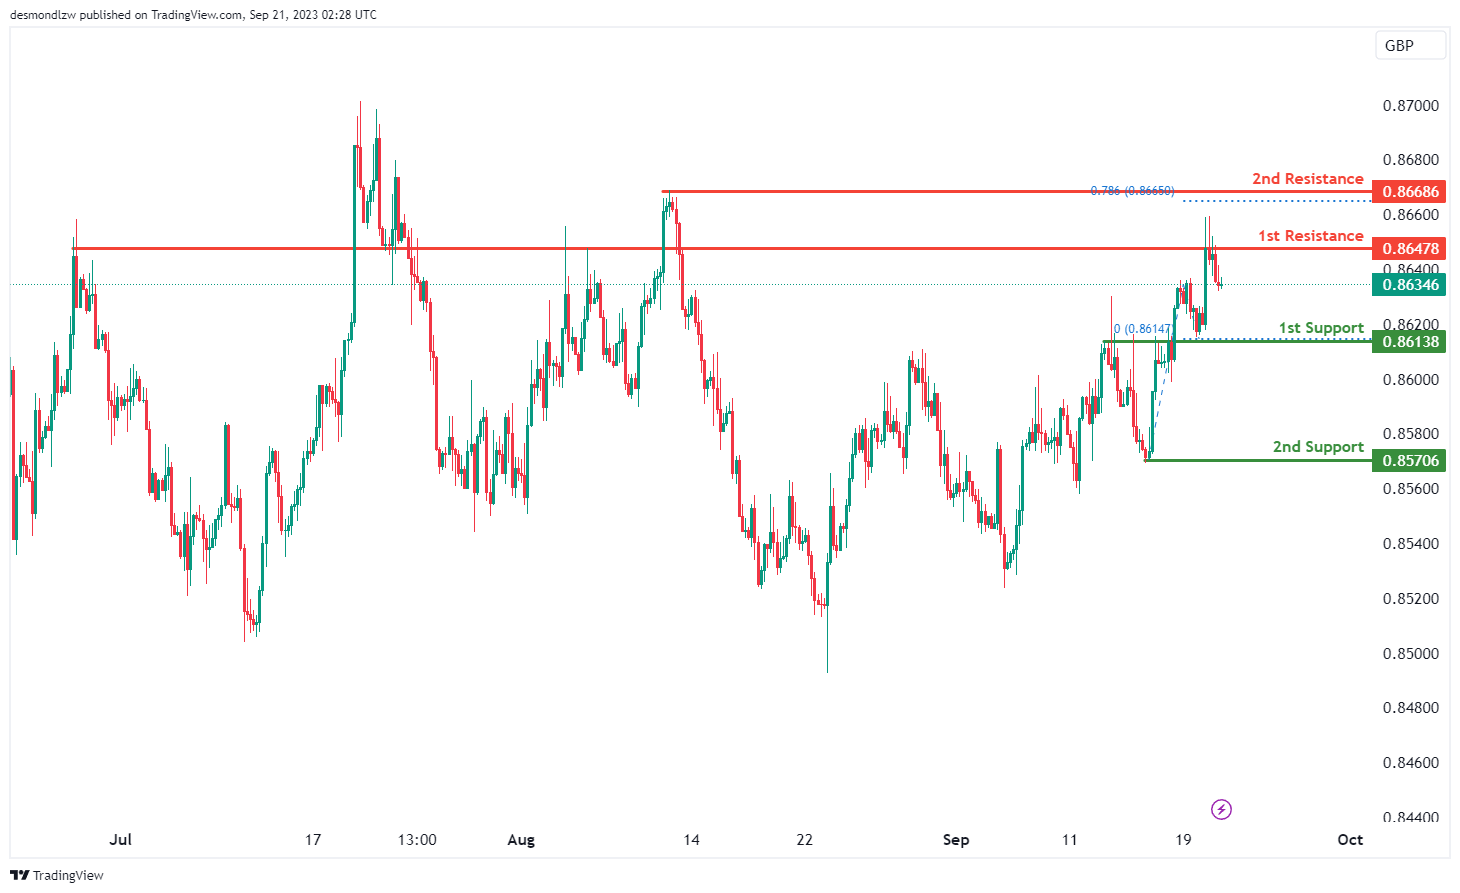
The EUR/GBP chart currently reflects a bearish overall momentum, with several factors contributing to this downward sentiment. Based on the technical analysis, there’s a potential scenario where the price could experience a bearish reaction off the 1st resistance level, potentially leading to a drop towards the 1st support.
The 1st support level, situated at 0.8613, is identified as a significant potential support zone. This level is classified as an overlap support, indicating its importance as a potential area where price might find support. Additionally, the 2nd support at 0.8570 is noted as a swing low support, further emphasizing its role as a potential support level.
On the resistance side, the 1st resistance level at 0.8647 is categorized as an overlap resistance. Traders and investors should pay attention to this level, as it may act as a point of resistance within the ongoing bearish trend. Beyond the 1st resistance, the 2nd resistance at 0.8668 is identified as a swing high resistance, signifying its potential significance as a point of reversal or resistance.
GBP/USD:
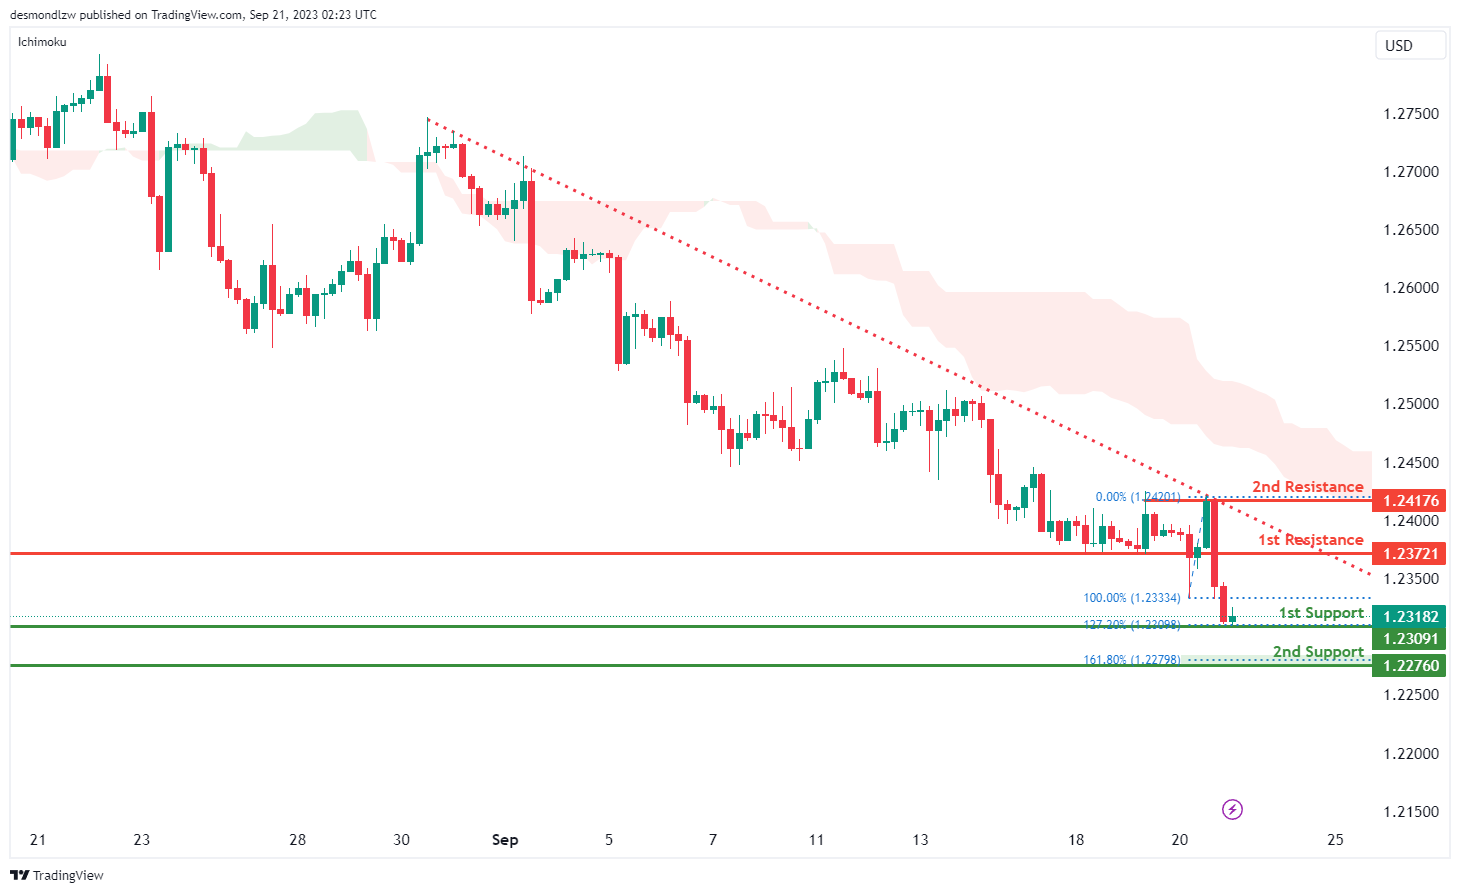
The GBP/USD chart currently maintains a bearish overall momentum, with key factors contributing to its downward trajectory. One significant factor influencing this bearish sentiment is the price’s position below a major descending trend line, which serves as a resistance and suggests the presence of bearish momentum.
In this context, there’s a plausible scenario where the price may experience a short-term rise towards the 1st resistance level at 1.2372 before reversing and heading downwards towards the 1st support at 1.2309.
The 1st support at 1.2309 is identified as a swing low support, and it aligns with the presence of the 127.20% Fibonacci Extension, indicating its role as a strong support zone. Similarly, the 2nd support at 1.2276 is characterized as a swing low support and aligns with the presence of the 161.80% Fibonacci Extension, further emphasizing its potential as a key support level.
On the resistance side, the 1st resistance at 1.2372 assumes a pivotal role, categorized as a pullback resistance, and it may serve as a point of resistance in the short term. Beyond the 1st resistance, the 2nd resistance at 1.2417 is identified as a multi-swing high resistance, underlining its significance.
GBP/JPY:
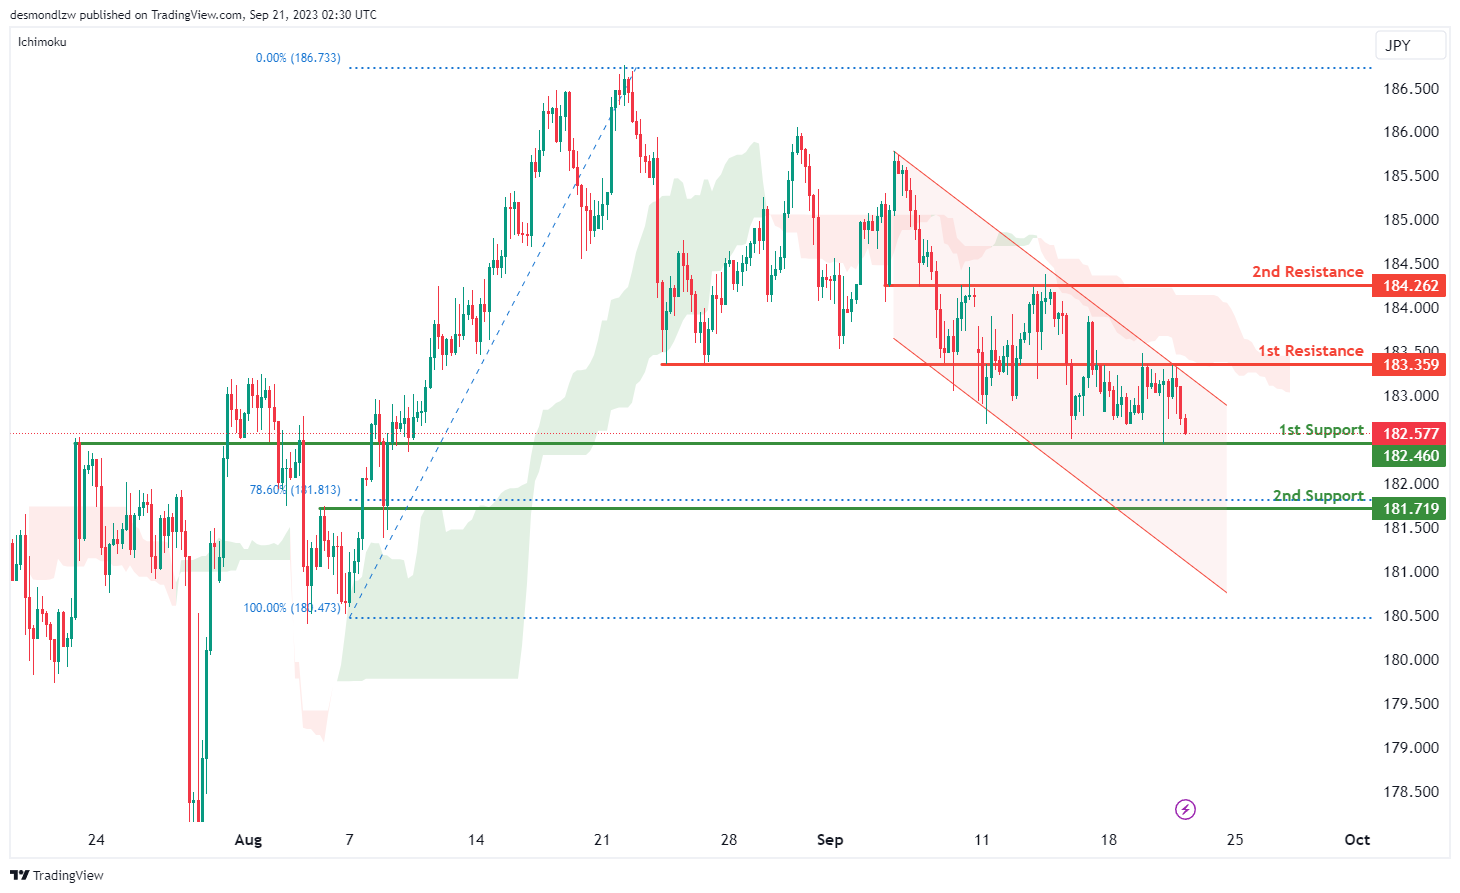
The GBP/JPY chart currently exhibits a bearish overall momentum, with several factors contributing to this downward sentiment. Price analysis reveals that the market conditions are conducive to a bearish continuation, particularly towards the 1st support level.
The 1st support level, situated at 182.52, is identified as a robust potential support zone. This level is classified as an overlap support, emphasizing its significance as a potential area where price could find support. Additionally, the 2nd support at 181.71 adds further weight to the potential support zone, as it aligns with the 78.60% Fibonacci Retracement. This confluence of technical indicators underscores the importance of these support levels in the context of the bearish trend.
On the resistance side, the 1st resistance at 183.35 is categorized as an overlap resistance. This level may act as a point of resistance within the ongoing bearish trend. Beyond the 1st resistance, the 2nd resistance at 184.26 is also identified as an overlap resistance, further reinforcing its significance as a potential resistance level.
The bearish Ichimoku cloud and the presence of a bearish descending channel are key factors contributing to the overall bearish momentum in the GBP/JPY chart
USD/CHF:
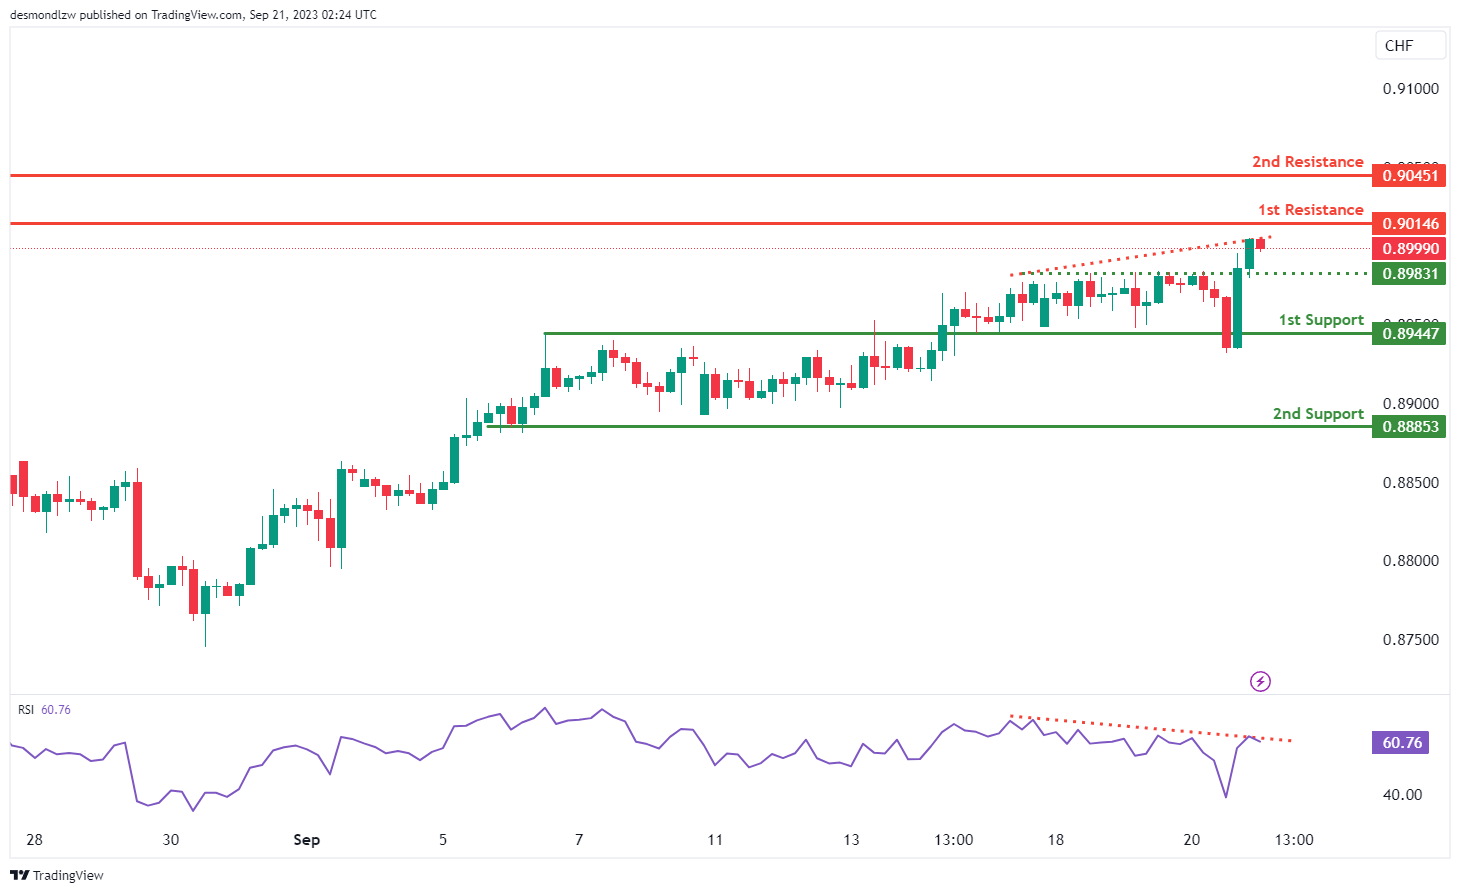
The USD/CHF chart currently exhibits a bearish overall momentum, with the potential for a bearish reaction upon reaching the 1st resistance level at 0.9014, followed by a decline towards the 1st support at 0.8944.
The 1st support at 0.8944 holds significant importance, characterized as an overlap support, signifying its historical relevance as a potential strong support zone. Similarly, the 2nd support at 0.8885 is identified as a multi-swing low support, further reinforcing its role as a key support level.
On the resistance side, the 1st resistance at 0.9014 plays a pivotal role, categorized as a multi-swing high resistance, indicating its potential as a point of resistance. Beyond the 1st resistance, the 2nd resistance at 0.9045 is characterized as an overlap resistance, further highlighting its significance.
Additionally, it’s worth noting that the Relative Strength Index (RSI) is displaying bearish divergence versus price, suggesting the possibility of a reversal occurring soon. This divergence adds to the overall bearish sentiment in the market.
USD/JPY:
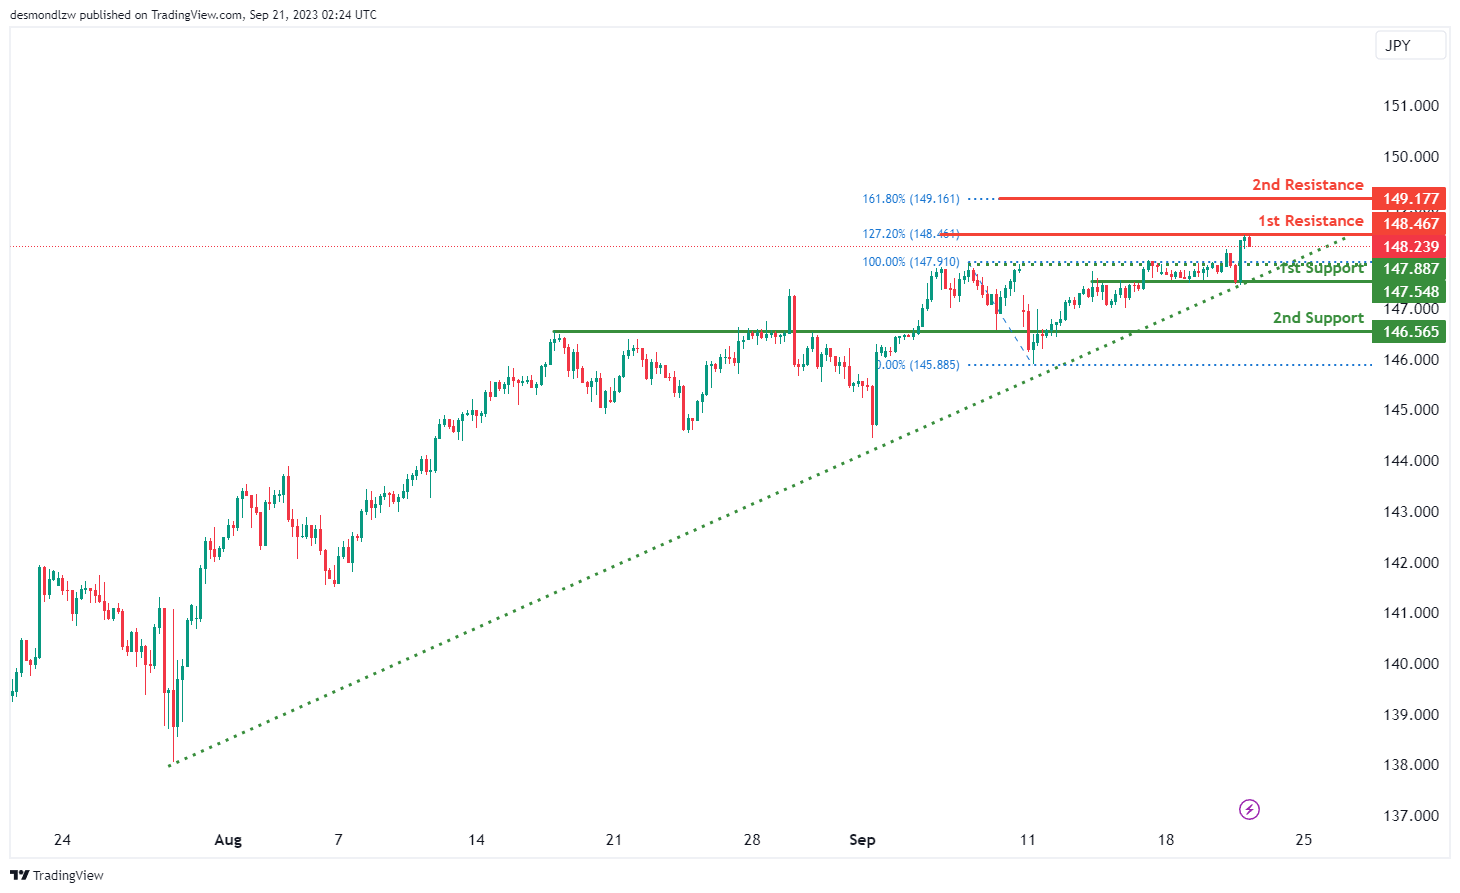
The USD/JPY chart currently maintains a bullish overall momentum, with several factors contributing to its upward trajectory. A significant factor in this bullish sentiment is the price’s position above a major ascending trend line, suggesting the potential for further bullish movement.
However, there’s a plausible scenario where the price may experience a short-term drop towards the 1st support level at 147.54 before bouncing from there and rising towards the 1st resistance at 148.46.
The 1st support at 147.54 is identified as an overlap support, signifying its historical relevance as a potential strong support zone. Similarly, the 2nd support at 146.56 is characterized as an overlap support, further reinforcing its role as a key support level.
On the resistance side, the 1st resistance at 148.46 is noted as a point of significance and is associated with the presence of the 127.20% Fibonacci Extension, highlighting its potential as a point of resistance. Beyond the 1st resistance, the 2nd resistance at 149.17 is also important and corresponds to the presence of the 161.80% Fibonacci Extension, further emphasizing its significance.
USD/CAD:
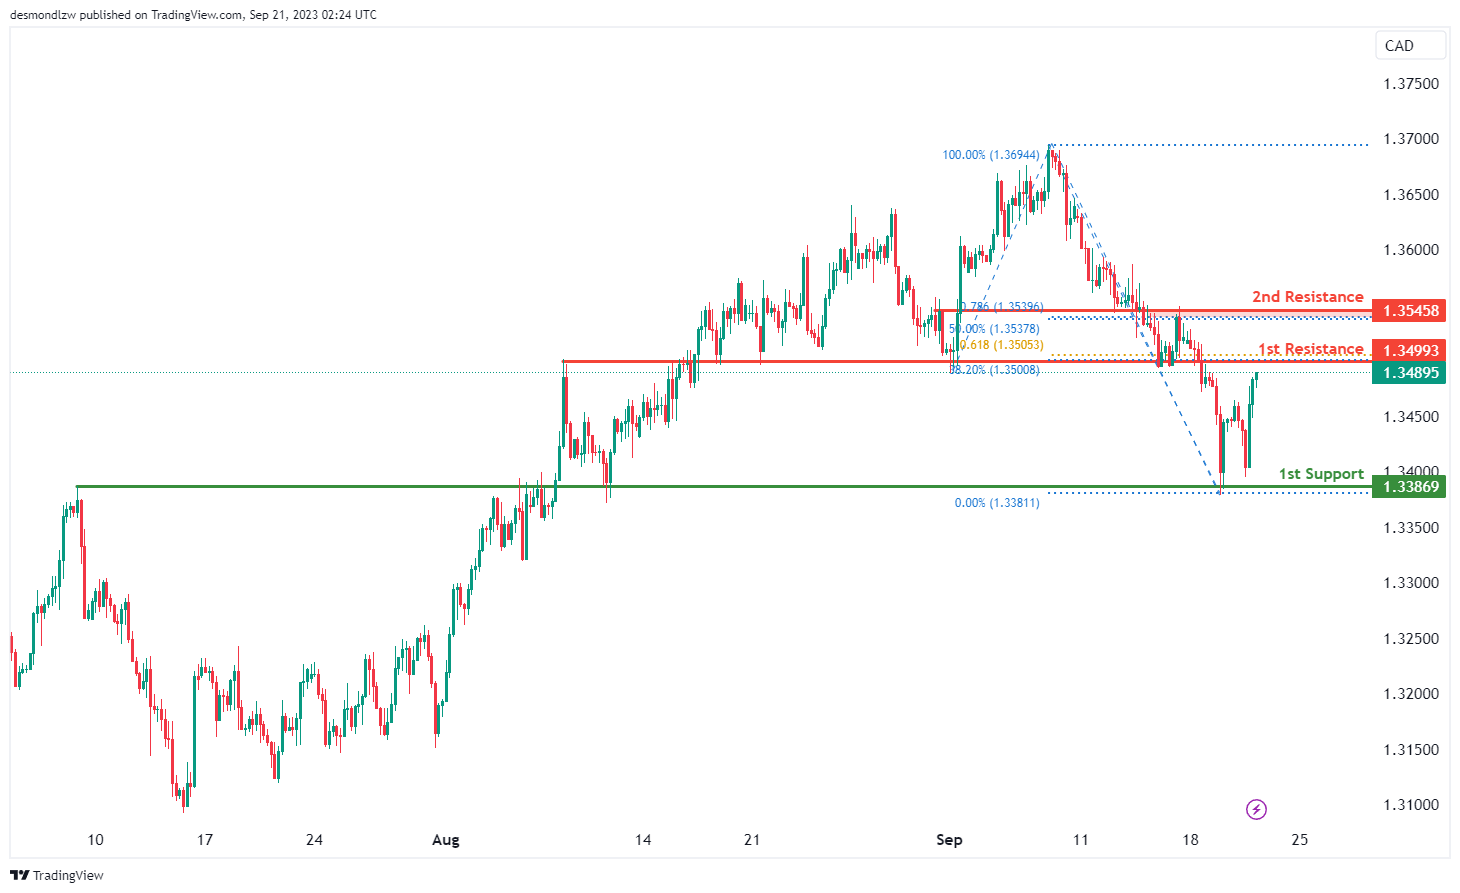
The USD/CAD chart is currently exhibiting an overall bullish momentum, indicating an upward trend with price making a bullish continuation towards the 1st resistance level.
The 1st resistance level at 1.3499 is identified as an overlap resistance that aligns with a confluence of Fibonacci levels i.e. the 38.20% retracement and the 61.80% projection levels. Higher up, the 2nd resistance level at 1.3549 is marked as a pullback resistance that also aligns with a confluence of Fibonacci levels i.e. the 50% retracement and the 78.60% projection levels.
To the downside, the 1st support level at 1.3387 is identified as an overlap support, indicating that it has previously acted as a strong support zone.
AUD/USD:
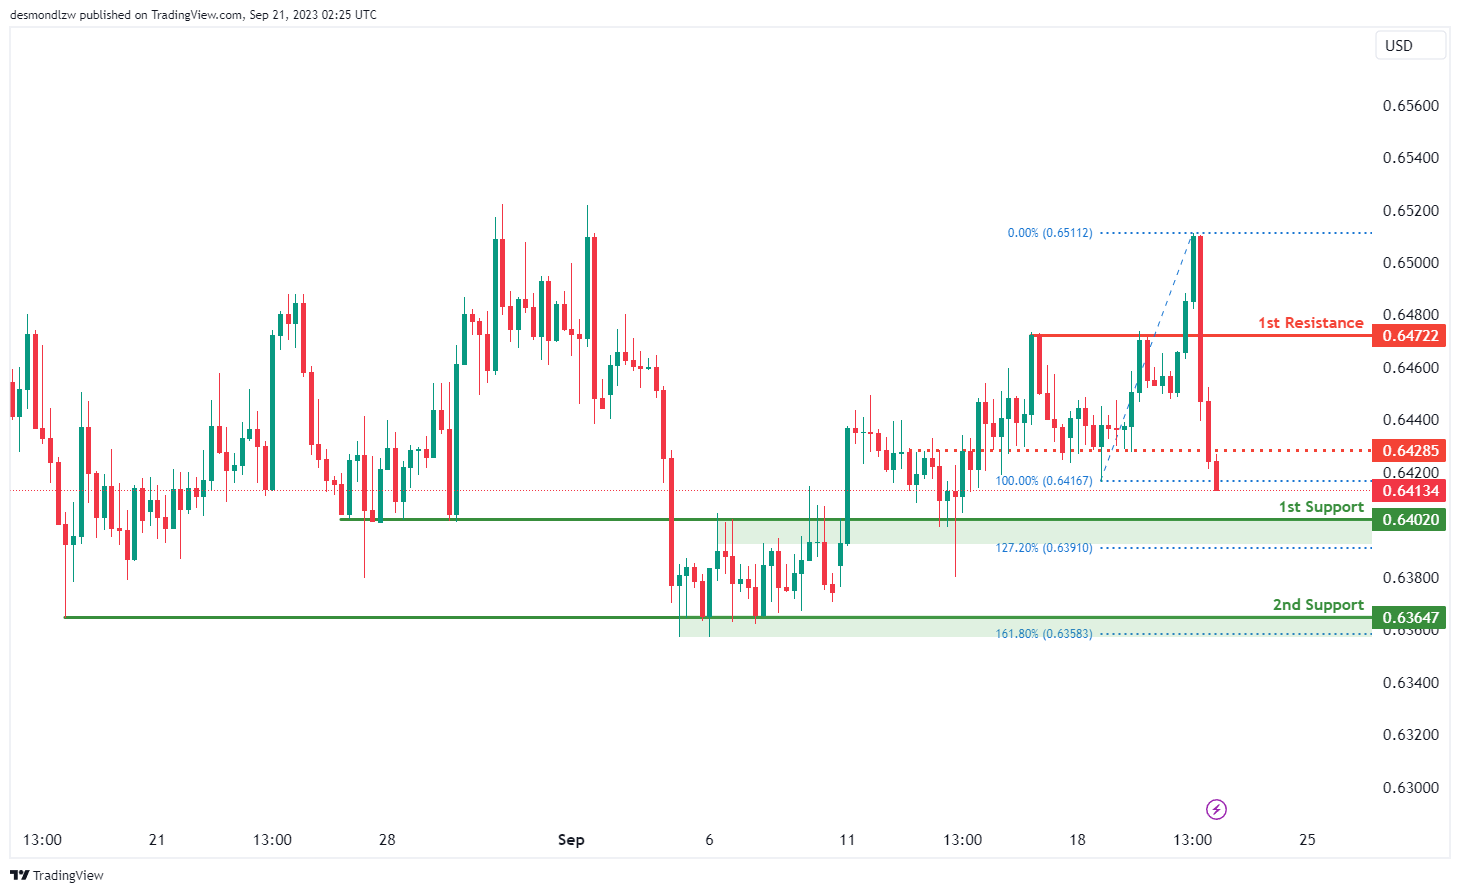
The AUD/USD chart is currently displaying an overall bearish momentum, suggesting a bearish continuation towards the 1st support level.
The 1st support level at 0.6402 is identified as an overlap support that aligns close to the 127.20% Fibonacci extension level while the 2nd support level at 0.6365 is identified as a pullback support.
To the upside, the intermediate support level at 0.6429 is identified as an overlap resistance while the 1st resistance level at 0.6472 is identified as a pullback resistance.
NZD/USD
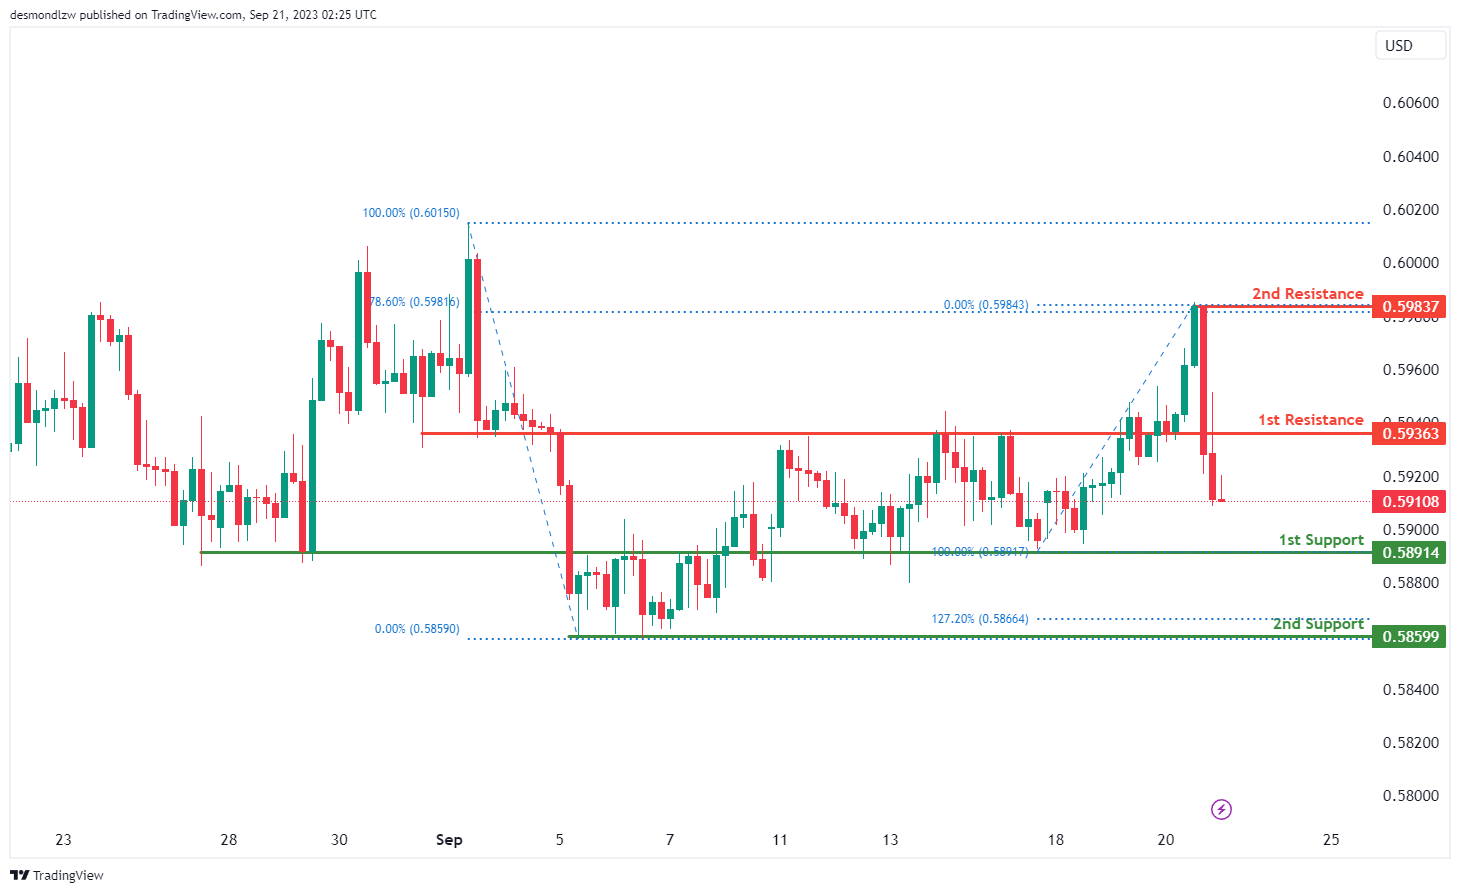
The NZD/USD chart is currently displaying an overall bearish momentum, suggesting a bearish continuation towards the 1st support level.
The 1st support level at 0.5891 is identified as an overlap support while the 2nd support level at 0.5859 is marked as pullback support that aligns close to the 127.20% Fibonacci extension level.
To the upside, the 1st resistance level at 0.5936 is identified as an overlap resistance. Further up, the 2nd resistance level at 0.2984 is marked as a swing-high resistance that aligns with the 78.60% Fibonacci retracement level.
DJ30:
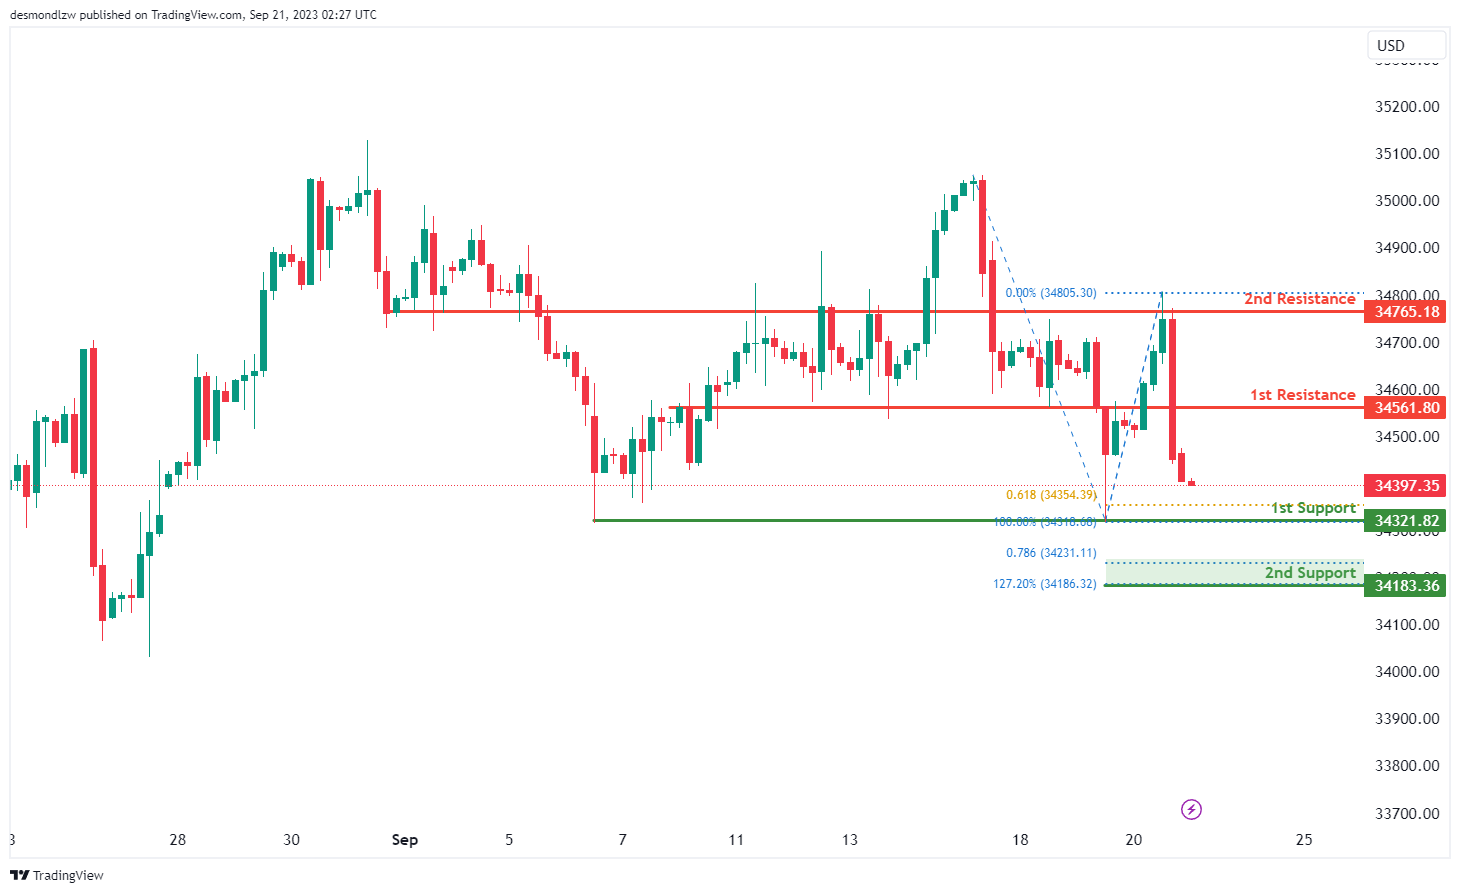
The DJ30 (Dow Jones Industrial Average) chart currently reflects a bearish overall momentum, indicating a prevailing downtrend in the market. Multiple factors contribute to this bearish sentiment.
There is a potential scenario where the price could continue its bearish movement towards the 1st support level at 34321.82. The 1st support level is characterized as a multi-swing low support, and it also aligns with a Fibonacci confluence, incorporating the 61.80% Fibonacci Projection. This confluence of technical indicators highlights the 1st support as a robust potential support zone within the current bearish trend.
Additionally, the 2nd support at 34183.36 is identified as a swing low support, and its significance is further reinforced by the presence of the 127.20% Fibonacci Extension and the 100% Fibonacci Projection, indicating a high degree of Fibonacci confluence. This emphasizes the importance of the 2nd support level as a key support zone.
On the resistance side, the 1st resistance at 34561.80 is categorized as a pullback resistance, suggesting its potential as a point of resistance within the ongoing bearish trend. Beyond the 1st resistance, the 2nd resistance at 34765.18 is characterized as an overlap resistance, further highlighting its significance as a potential resistance level.
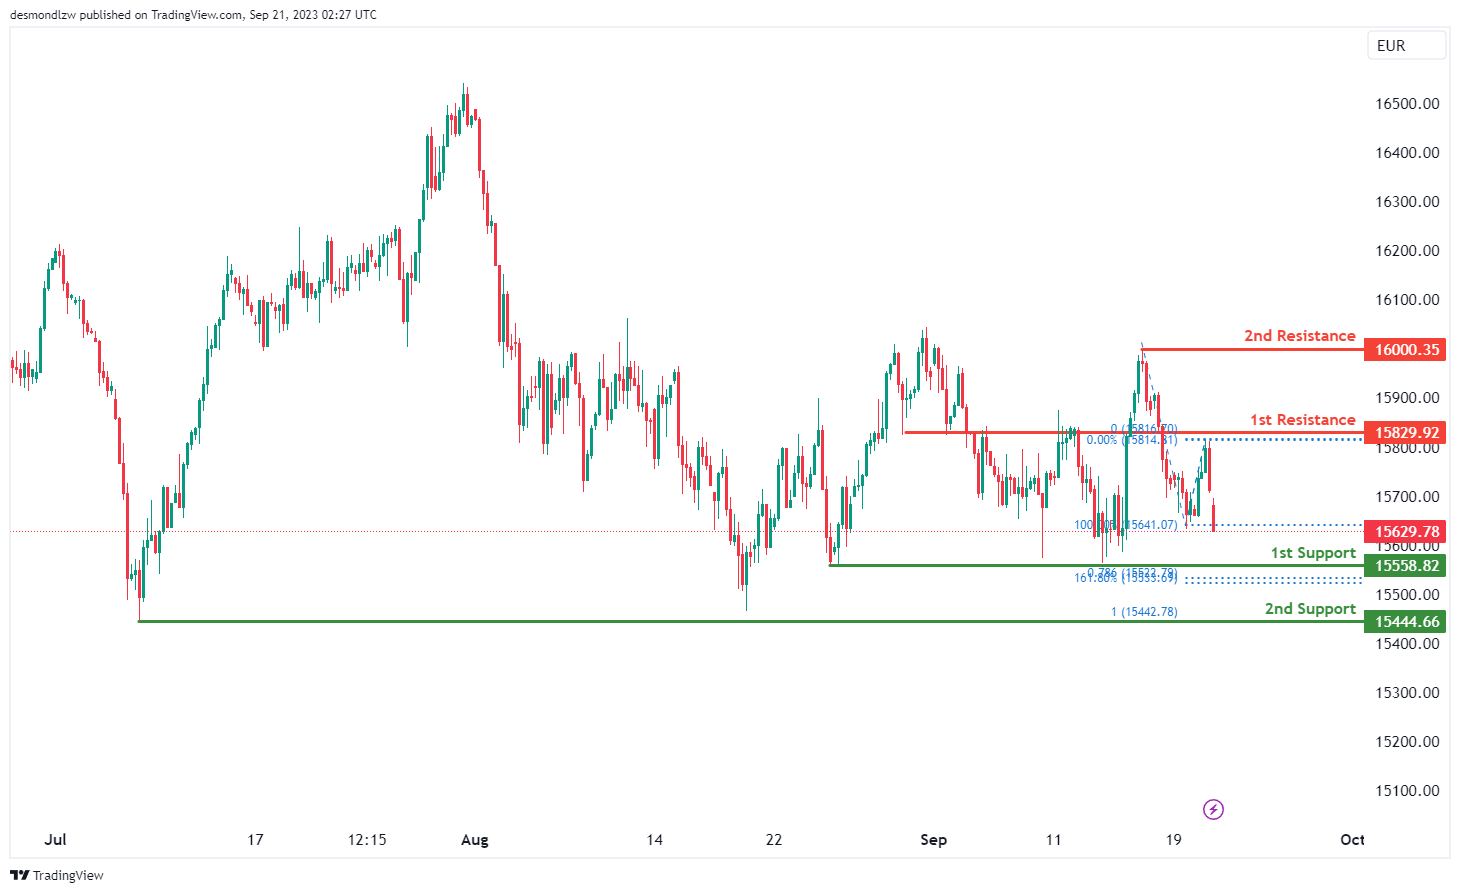
GER30:
The GER30 (DAX) chart is currently exhibiting a bearish overall momentum, indicating a prevailing downtrend in the market. Several factors contribute to this bearish sentiment.
In this context, there’s a potential scenario where the price may continue its bearish movement towards the 1st support level at 15558.82. The 1st support is identified as a multi-swing low support, and it also coincides with a Fibonacci confluence, comprising the 78.60% Fibonacci Projection and the 161.80% Fibonacci Extension. This confluence of technical indicators suggests that the 1st support level holds significance as a strong potential support zone within the current bearish trend.
Furthermore, the 2nd support at 15444.66 is categorized as a swing low support and is reinforced by the presence of the 100% Fibonacci Projection, underlining its importance as a key support level.
On the resistance side, the 1st resistance at 15829.92 is characterized as an overlap resistance, signifying its potential as a point of resistance within the ongoing bearish trend. Beyond the 1st resistance, the 2nd resistance at 16000.35 is associated with a swing high resistance, highlighting its significance as a potential resistance level.
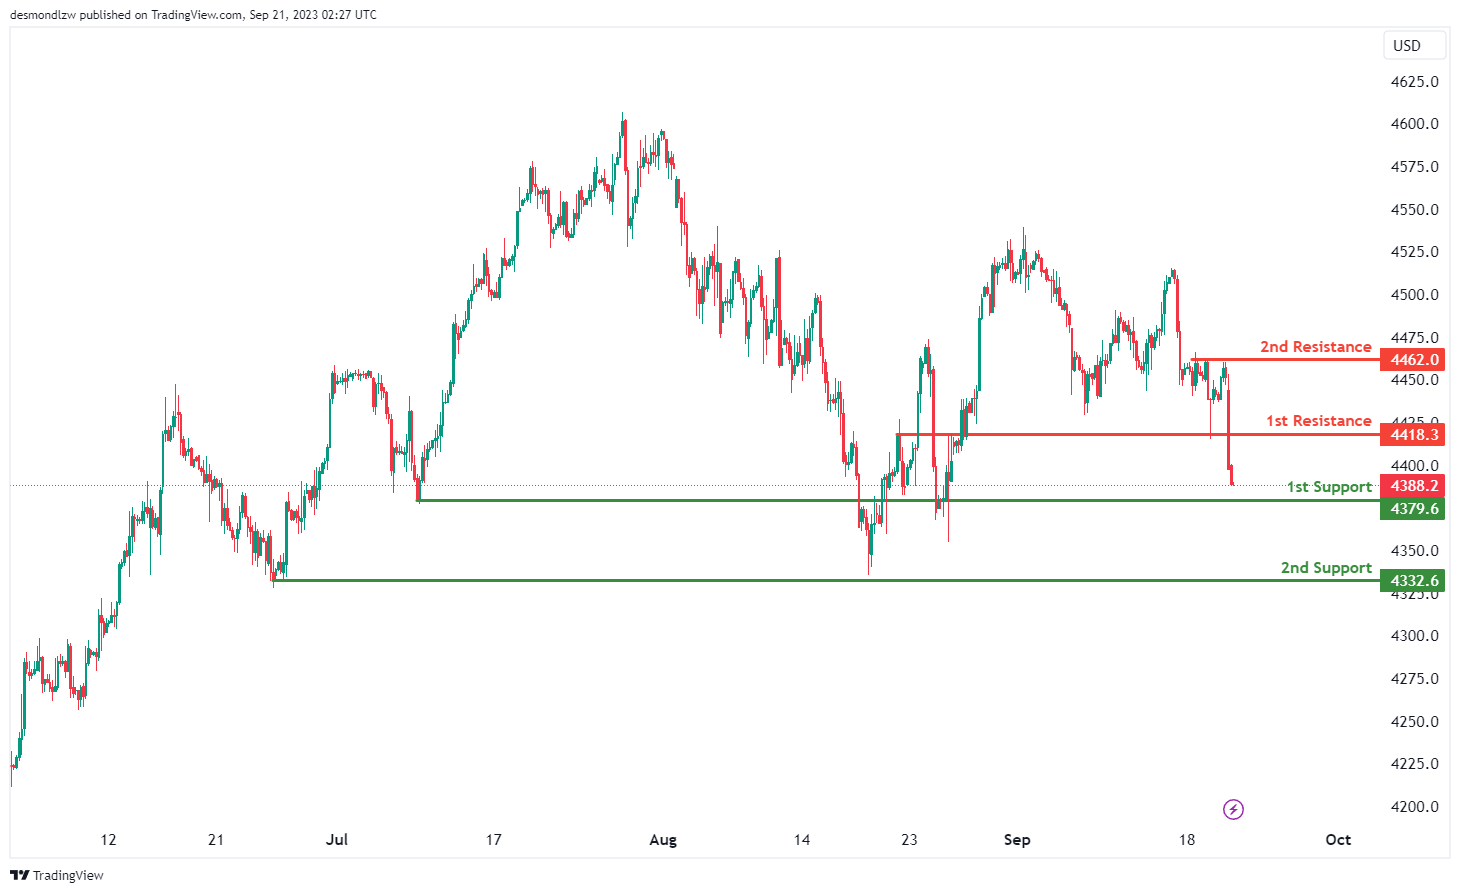
US500
The US500 (S&P 500) chart currently exhibits a bearish overall momentum, suggesting a prevailing downward trend in the market. Several factors contribute to this bearish sentiment.
There’s a potential scenario where the price may continue its bearish movement towards the 1st support level at 4379.6. The 1st support is identified as an overlap support, indicating its potential as a strong support zone. Additionally, the 2nd support at 4332.6 is categorized as a multi-swing low support, further emphasizing its importance as a key support level within the current downtrend.
On the resistance side, the 1st resistance at 4418.3 is characterized as a pullback resistance, signifying its potential as a point of resistance within the ongoing bearish trend. Beyond the 1st resistance, the 2nd resistance at 4462.0 is associated with the presence of multi-swing high resistance, further highlighting its significance as a potential resistance level.
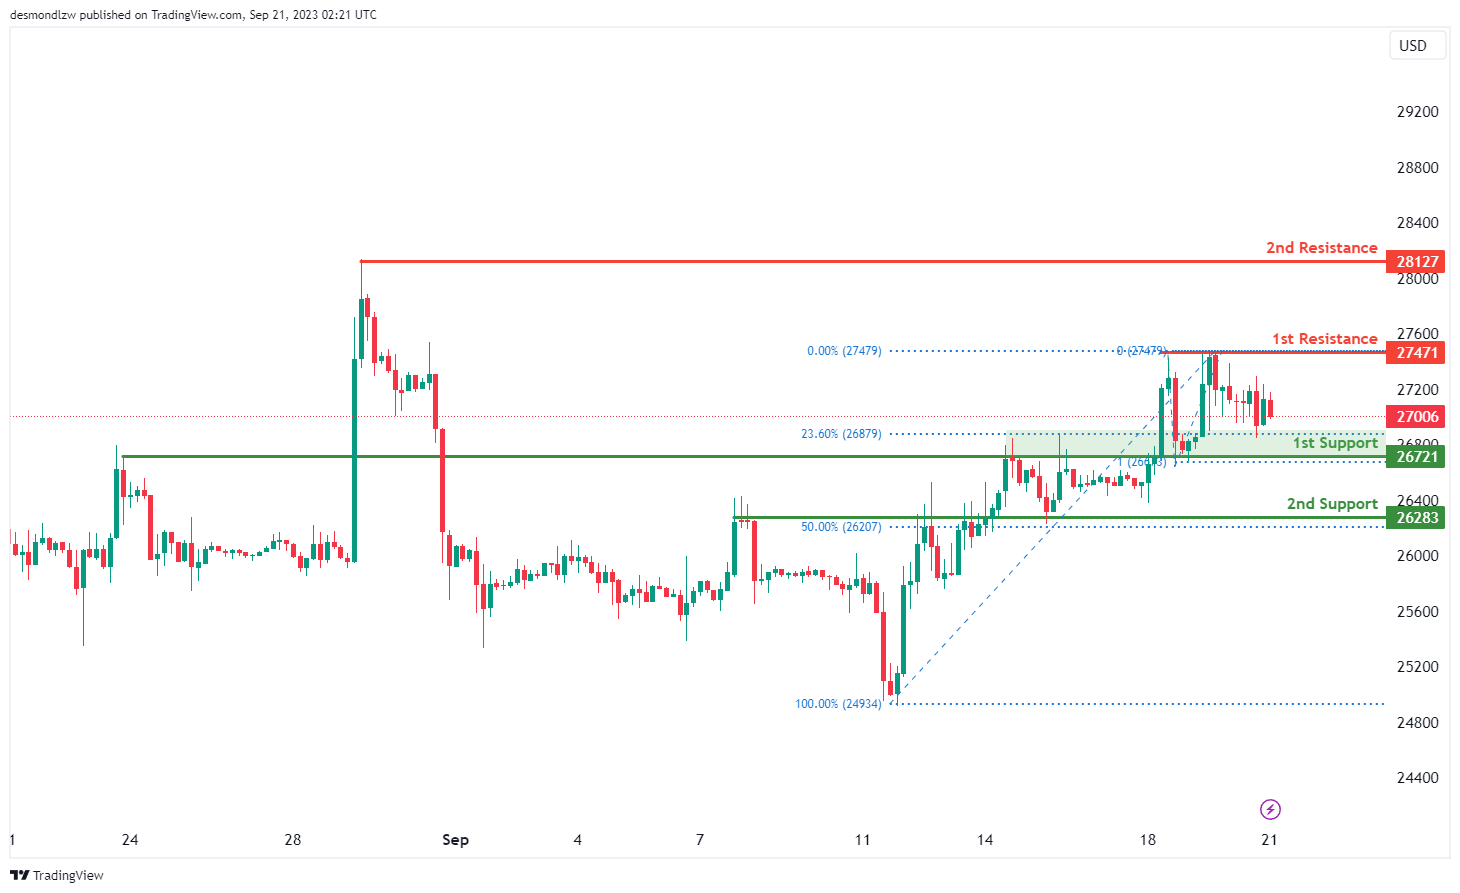
BTC/USD:
The BTC/USD chart currently exhibits a neutral overall momentum, indicating a lack of a clear directional bias in the market. Several factors contribute to this neutral sentiment.
In this context, there’s a possibility that the price may continue to fluctuate within the range defined by the 1st support and the 1st resistance levels. Traders should be prepared for potential price swings within this range while recognizing the absence of a strong bullish or bearish bias at this time.
The 1st support at 26,721 is identified as an overlap support and coincides with the presence of the 23.60% Fibonacci Retracement, signifying its potential as a key support zone. Similarly, the 2nd support at 26,283 is categorized as an overlap support, further emphasizing its importance as a potential strong support level.
On the resistance side, the 1st resistance at 27,471 is characterized as a multi-swing high resistance, indicating its potential as a point of resistance within the current range. Beyond the 1st resistance, the 2nd resistance at 28,127 is associated with the presence of a swing high resistance, further highlighting its significance.
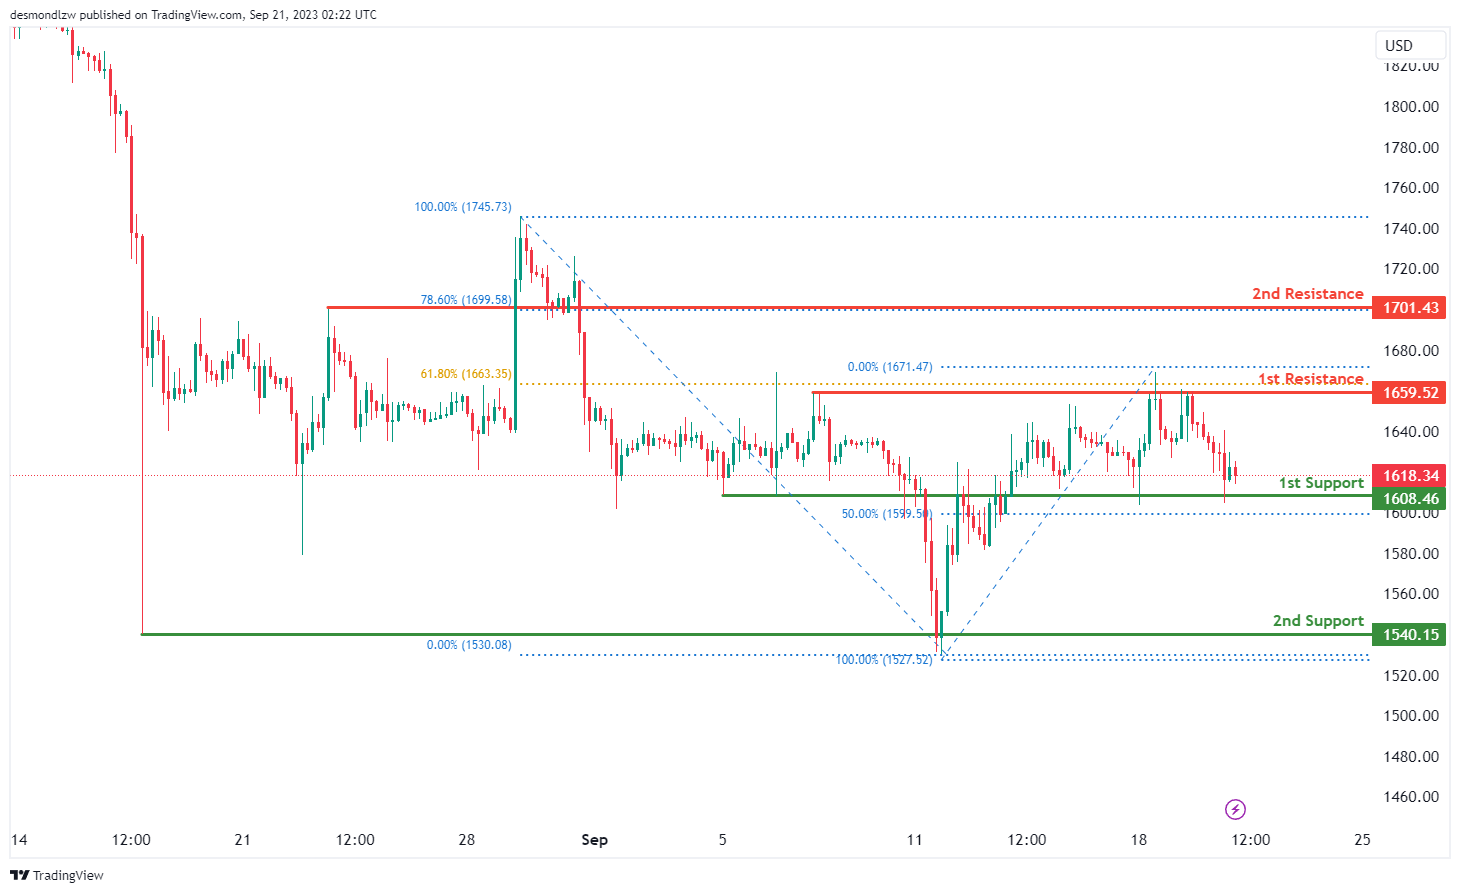
ETH/USD:
The ETH/USD chart currently maintains a neutral overall momentum, indicating a lack of a clear directional bias in the market. In this context, there’s a possibility that the price could continue to fluctuate within the range defined by the 1st support and the 1st resistance levels.
The 1st support at 1608.46 is identified as an overlap support, and it aligns with the presence of the 50% Fibonacci Retracement, suggesting its significance as a potential strong support zone. Similarly, the 2nd support at 1540.15 is categorized as a multi-swing low support, further reinforcing its role as a key support level.
On the resistance side, the 1st resistance at 1659.52 is characterized as a multi-swing high resistance, indicating its potential as a point of resistance within the current range. Beyond the 1st resistance, the 2nd resistance at 1701.43 is associated with the presence of the 78.60% Fibonacci Retracement, further emphasizing its importance as a potential resistance level.
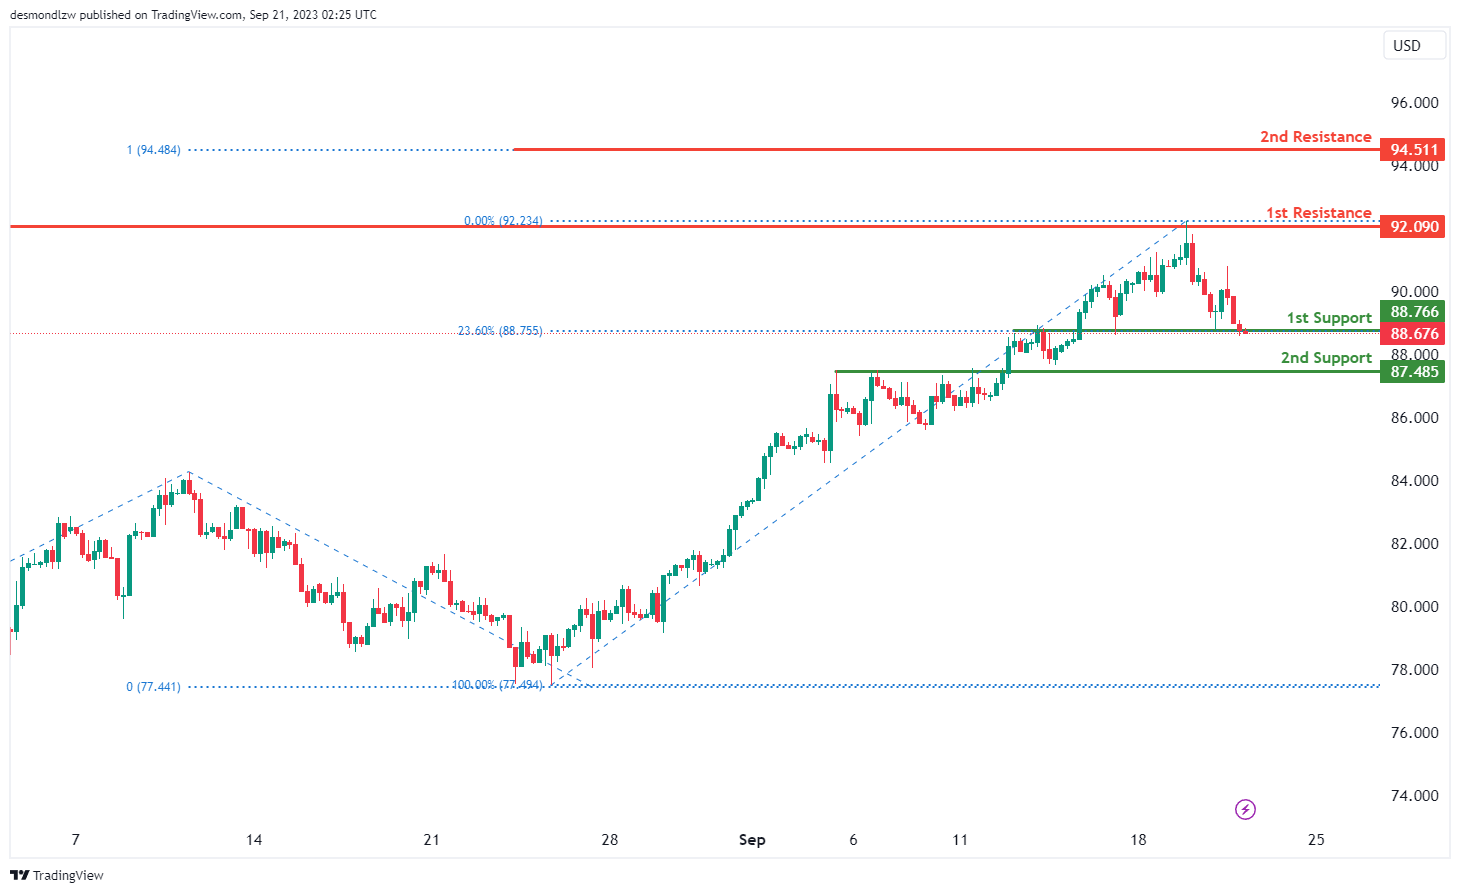
WTI/USD:
The WTI (West Texas Intermediate) chart currently exhibits an overall bearish momentum, suggesting a bearish break below the 1st support level with a potential continuation towards the 2nd support level.
The 1st support level at 88.77 is identified as an overlap support that aligns with the 23.60% Fibonacci retracement level while the 2nd support level at 87.49 is also marked as an overlap support.
To the upside, the 1st resistance level at 92.09 is identified as a multi-swing-high resistance. Further up, the 2nd resistance level at 94.51 is noted as a resistance that aligns with the 100.00% Fibonacci projection level.
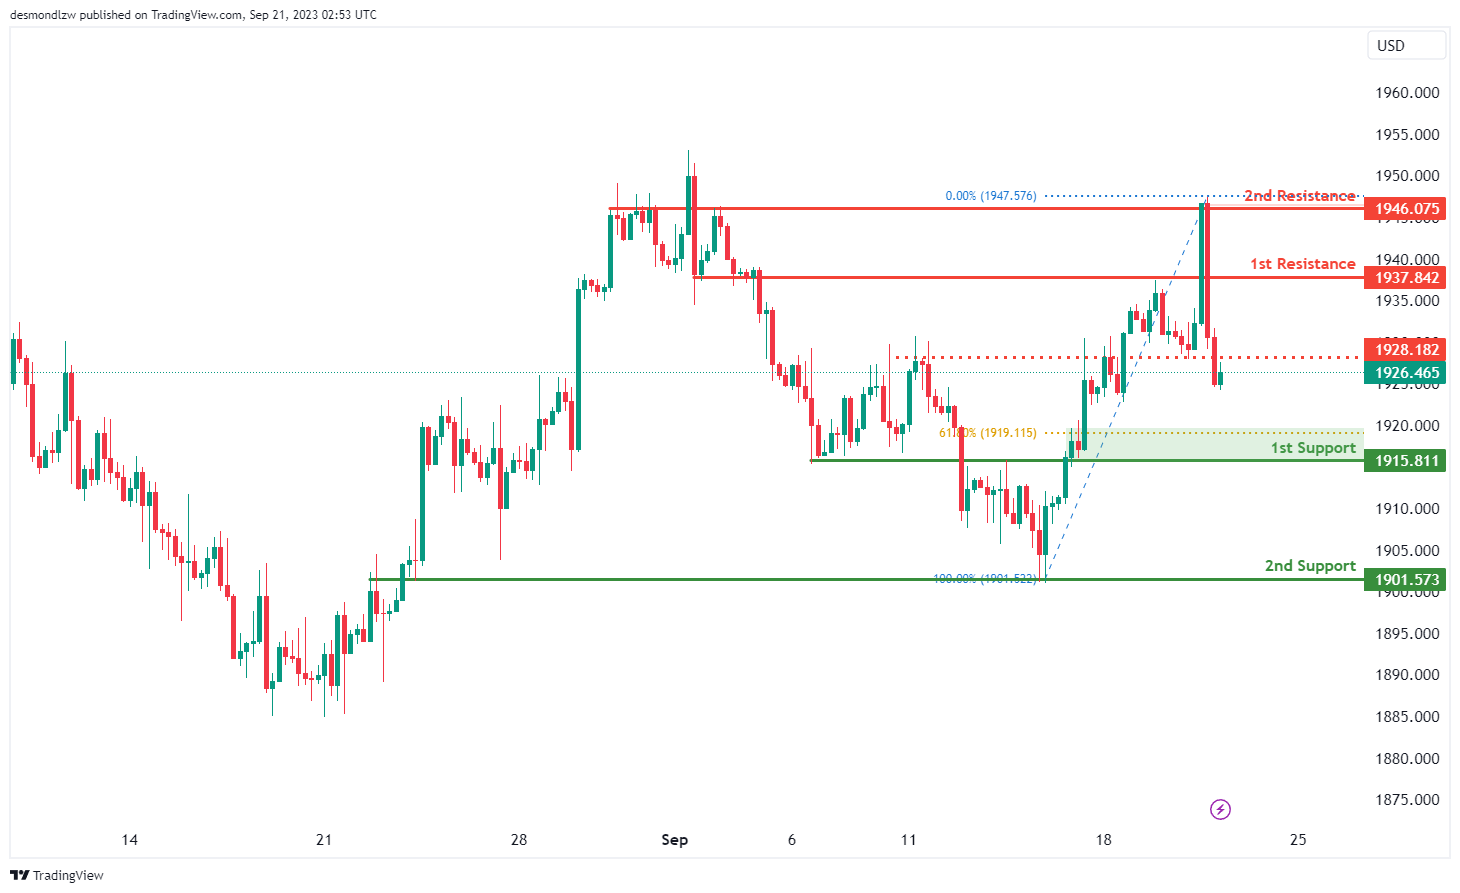
XAU/USD (GOLD):
The XAU/USD chart currently exhibits a bearish overall momentum, with key factors contributing to its downward trajectory. In this context, there’s a potential scenario where the price may continue its bearish movement towards the 1st support level at 1915.81.
The 1st support at 1915.81 is identified as a pullback support, and it coincides with the presence of the 61.80% Fibonacci Retracement, signifying its importance as a significant support zone. Similarly, the 2nd support at 1901.57 is categorized as an overlap support, further emphasizing its potential significance as a key support level.
On the resistance side, the 1st resistance at 1937.84 is characterized as a pullback resistance and may serve as a point of resistance in the short term. Beyond the 1st resistance, the 2nd resistance at 1946.07 is identified as an overlap resistance, further highlighting its significance.
Additionally, there is an intermediate resistance level at 1028.18, categorized as a pullback resistance, which traders will monitor closely.


