
After the recent strong turn down on gold we adjusted the wave count and think that the price action from the July low is wave B, but can still meet higher prices if we consider a running flat or possibly even running triangle scenario since a drop from 1990 can be a complex w-x-y in subwave (B). Because of a recent sharp drop in the 4-hour chart from around 1950 at the start of September, it’s a higher probability for a bearish running triangle pattern within wave B rather than a flat. In fact subwave (D) is also finished now followed by wave (E) that stoped at the 61.8% Fib resistance from here we can see nice turn, towards the lower side of a pattern. Keep an eye on the red trendline support now and the 1900 area; break below that zone will confirm a new drop for wave C, possibly even to around 1850 or lower.
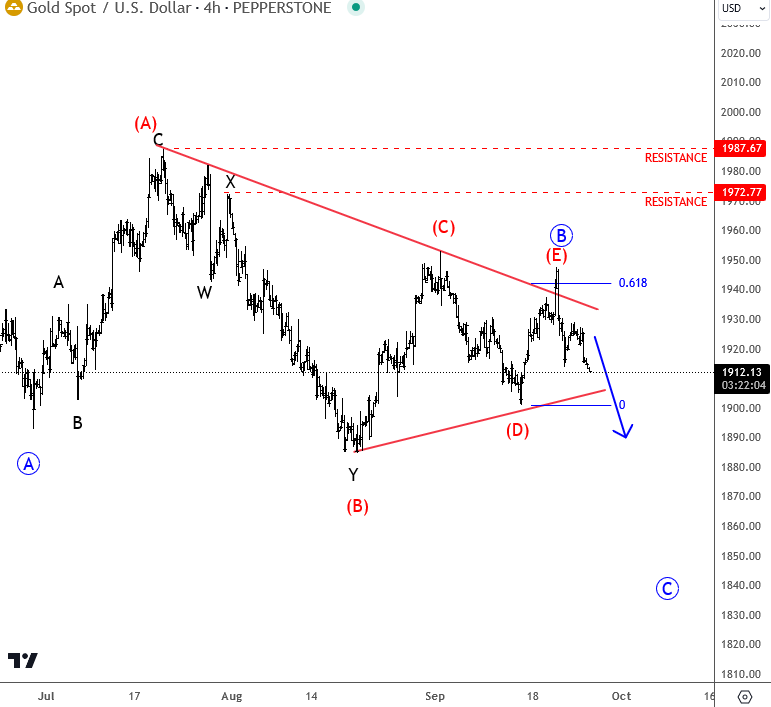


. Because of a recent sharp drop in the 4-hour chart from around 1950 at the start of September, it's a higher probability for a bearish running triangle pattern within wave B rather than a flat. In fact subwave (D) is also finished now followed by wave (E) that stoped at the 61.8% Fib resistance from here we can see nice turn, towards the lower side of a pattern. Keep an eye on the red trendline support now and the 1900 area; break below that zone will confirm a new drop for wave C, possibly even to around 1850 or lower.)