
DXY:
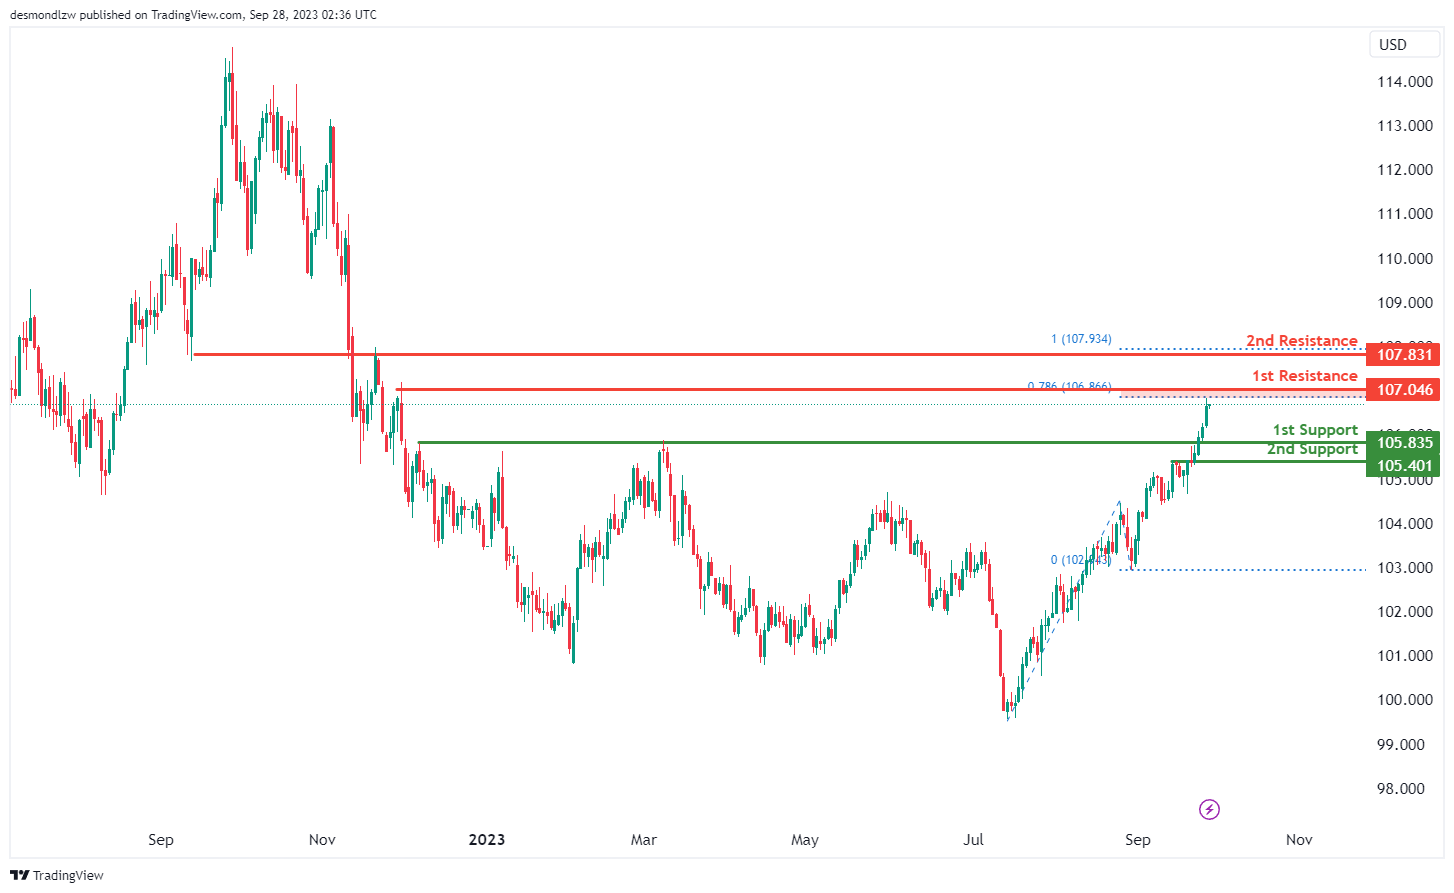
The DXY chart currently exhibits a bullish momentum, with a potential short-term drop to the 1st support at 105.83, identified as a pullback support, before potentially rising towards the 1st resistance. The 2nd support level is at 105.40, marked as an overlap support, serving as another potential floor for prices.
On the resistance side, the 1st resistance is at 107.04, a crucial swing high resistance level that aligns with the 78.60% Fibonacci Projection. Beyond this, the 2nd resistance stands at 107.83, another swing high resistance level coinciding with the 100% Fibonacci Projection, marking significant potential barriers to upward price movements
EUR/USD:
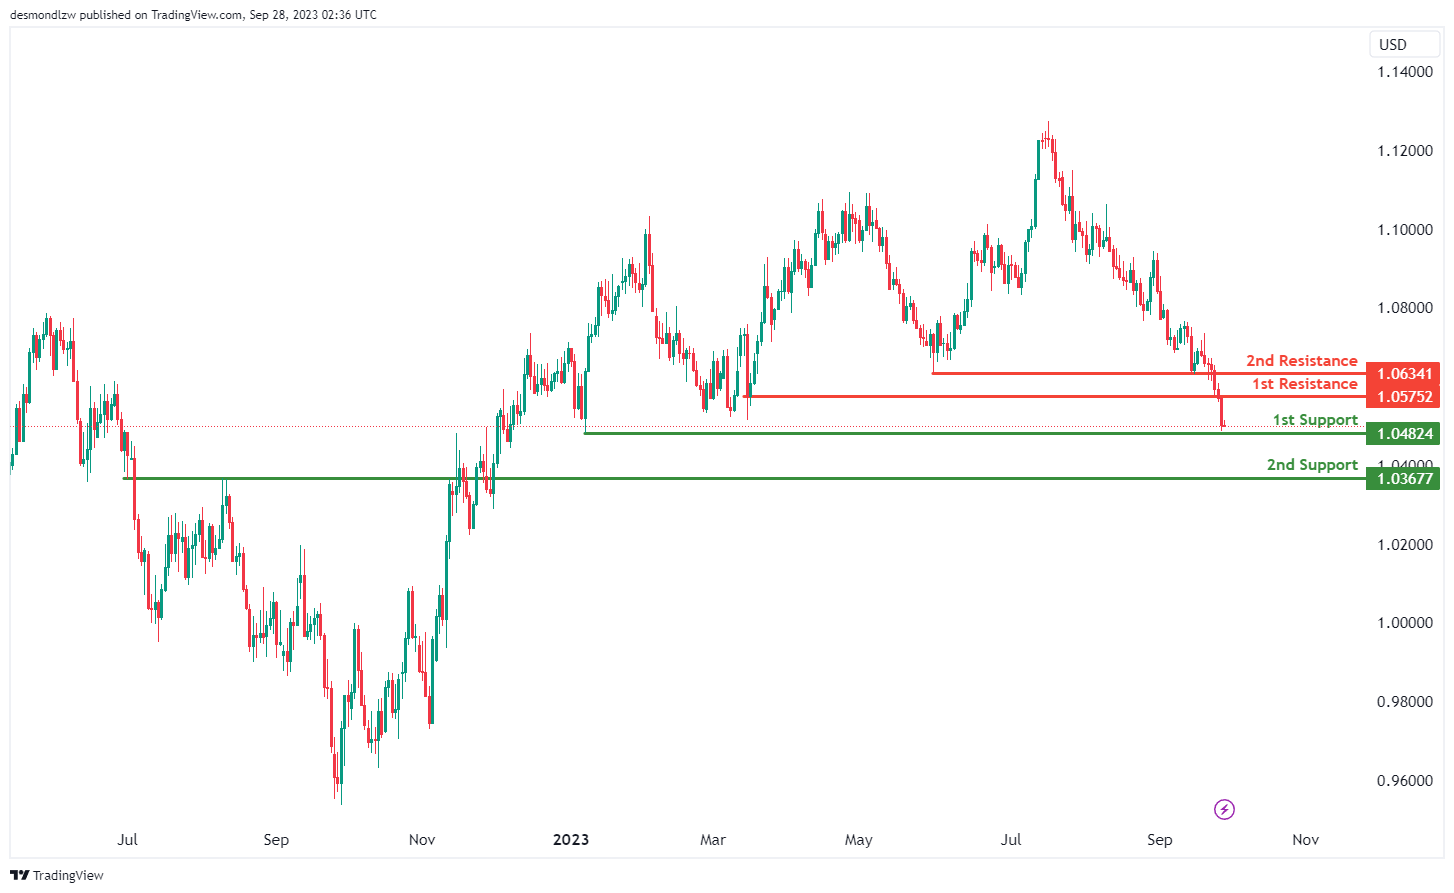
The EUR/USD chart is currently experiencing bearish momentum, with expectations of a potential bullish bounce off the 1st support level at 1.0482. This level, identified as a swing low support, is reinforced by the presence of a 127.20% Fibonacci Extension, providing a solid foundation for the price. There is also a 2nd support level at 1.0367, categorized as a pullback support, which further underpins the price.
In terms of resistance, the 1st resistance level is situated at 1.0575 and acts as a pullback resistance that might initially limit upward movements. Further up, the 2nd resistance at 1.0634, also serving as a pullback resistance, represents another potential cap to bullish advancements in the price.
EUR/JPY:
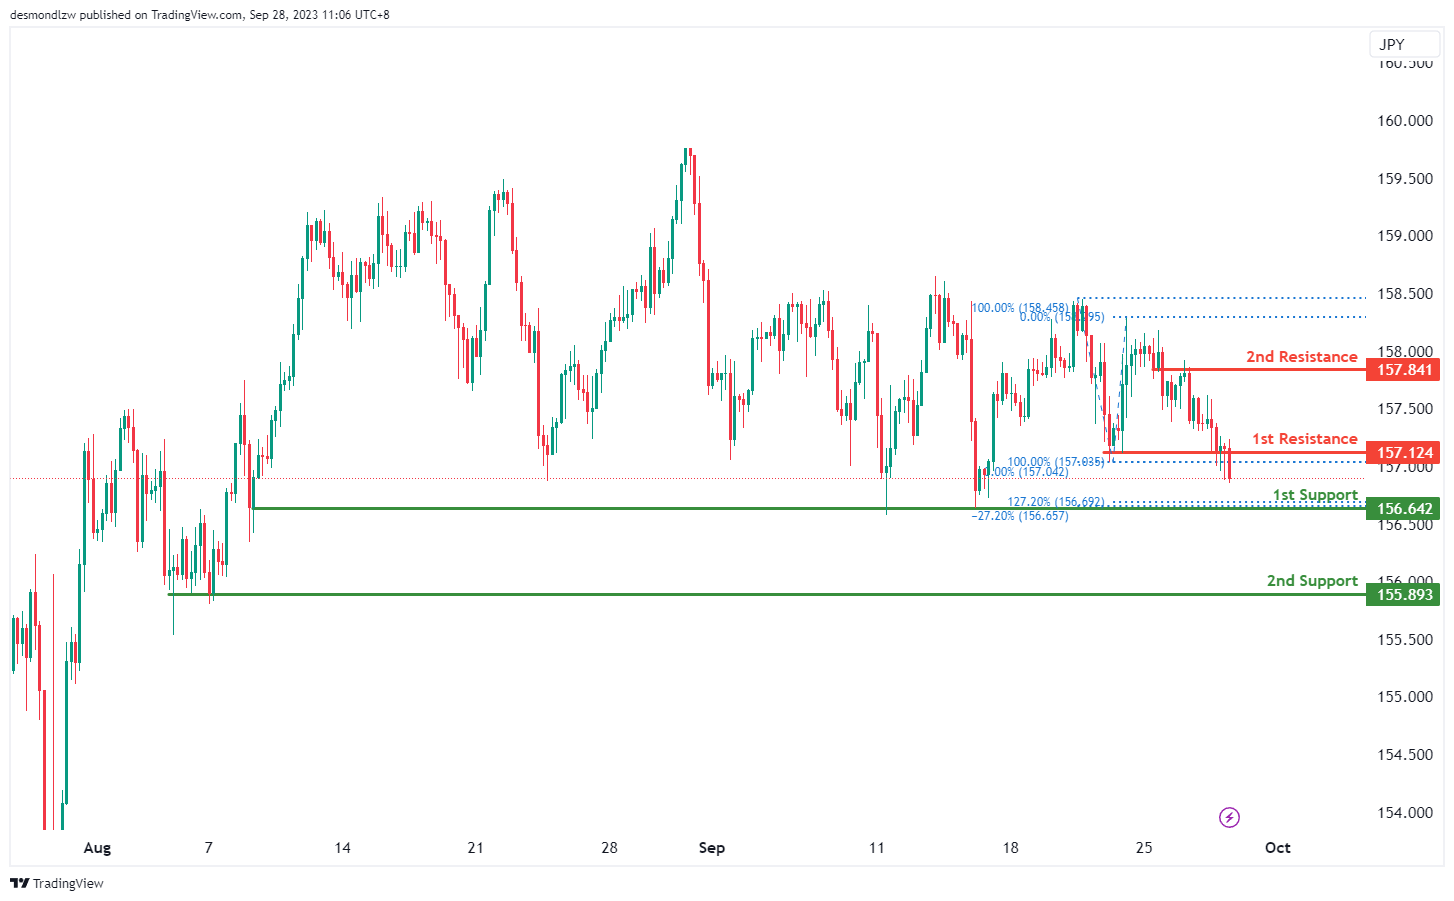
The EUR/JPY chart currently displays a bearish momentum, suggesting a potential continuation of the bearish trend.
The 1st support level at 156.64 is significant for several reasons. It is a multi-swing low support and is reinforced by the presence of a 127.20% Fibonacci Extension and a -27% Fibonacci Expansion, indicating a strong confluence of support factors. This level may serve as a crucial area where price could find support, and traders may anticipate a potential bounce or stabilization.
Slightly below, the 2nd support at 155.89 is another multi-swing low support, adding to the overall significance of this area. If the bearish pressure continues, this level might become relevant.
On the flip side, the 1st resistance level at 157.12 is marked as a pullback resistance, which could act as a barrier to any upward price movement.
Above that, the 2nd resistance at 157.84 is identified as an overlap resistance, further strengthening its potential as a significant level where sellers might step in.
EUR/GBP:
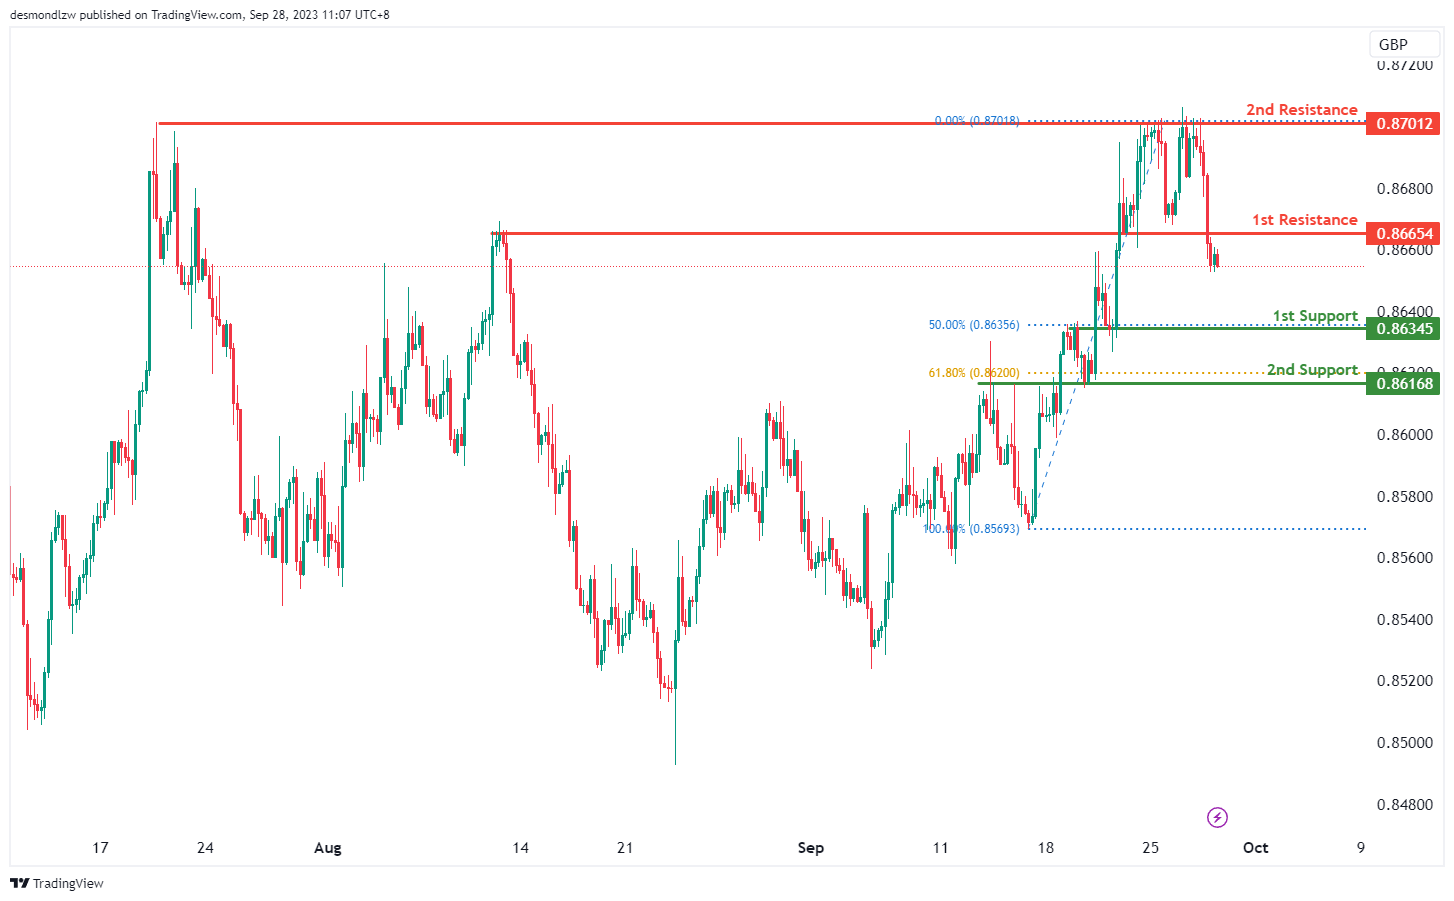
The EUR/GBP chart is currently exhibiting a bearish overall momentum, suggesting the potential for a further bearish continuation.
The 1st support level at 0.8634 is notable for several reasons. It represents an overlap support, which means it has previously acted as a significant price level where buying interest emerged. Additionally, this level coincides with the 50% Fibonacci Retracement, further reinforcing its significance. Traders may look to this level as a potential area where price could find support and reverse some of the bearish pressure.
Slightly lower, the 2nd support at 0.8616 is another overlap support, this time corresponding with the 61.80% Fibonacci Retracement. Such confluence of support factors makes this level an important area to watch for potential price reactions.
On the resistance side, the 1st resistance level at 0.8665 is marked as a pullback resistance. It could act as a barrier to any bullish attempts.
Above that, the 2nd resistance at 0.8701 is identified as a multi-swing high resistance, further strengthening its potential as a significant level where sellers might be active.
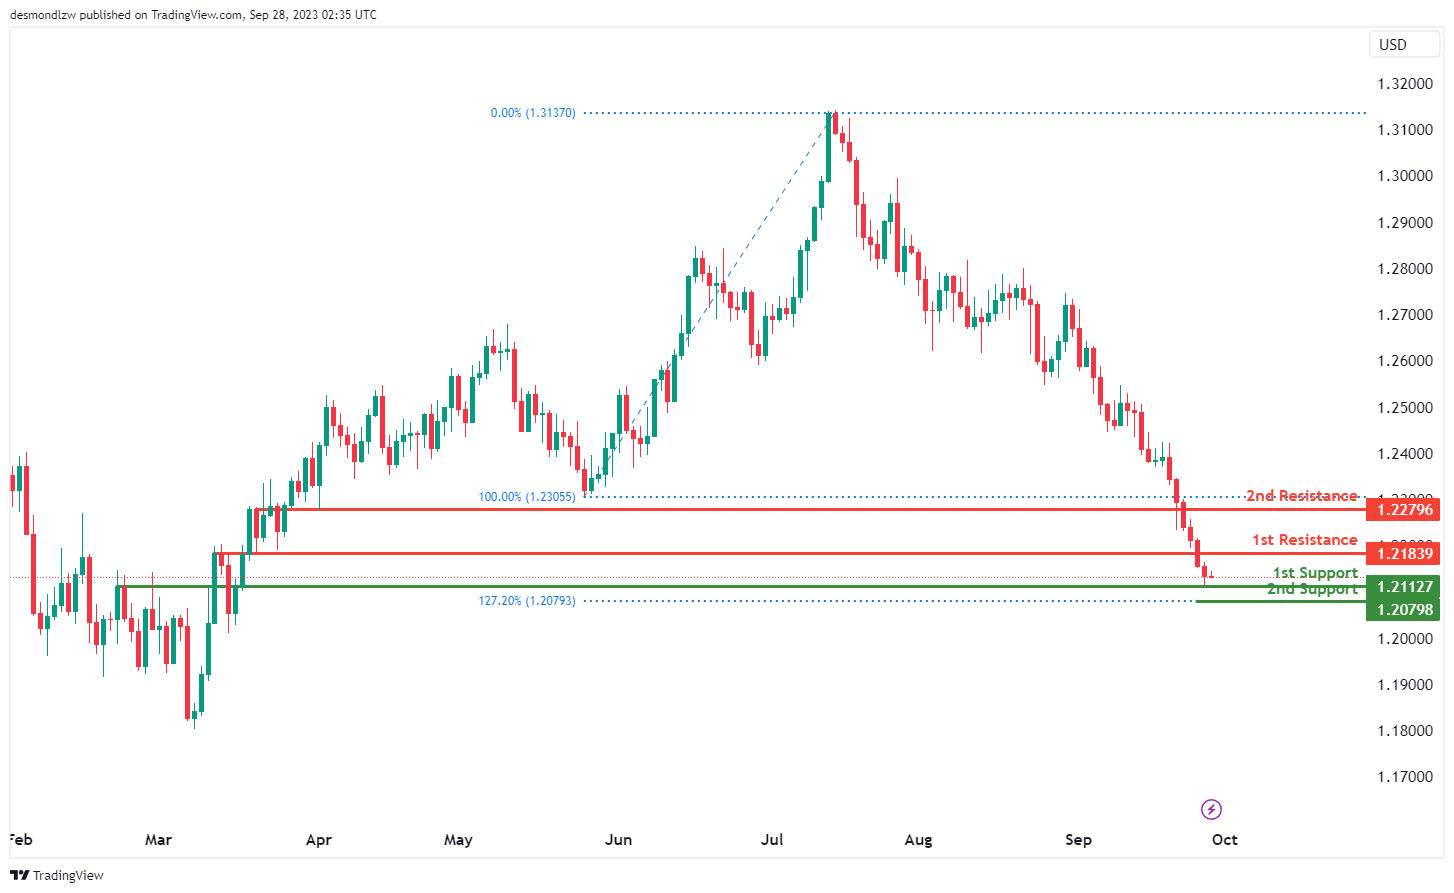
GBP/USD:
The GBP/USD chart currently signals bearish momentum but there’s anticipation for a bullish bounce from the 1st support at 1.2112, heading towards the 1st resistance. The 1st support level, which acts as an overlap support, is a crucial area where the price might find support and start ascending. Furthermore, the 2nd support at 1.2079, associated with the 127.20% Fibonacci Extension, also represents a significant support zone, reinforcing the likelihood of upward price movement from these levels.
On the resistance side, the chart has the 1st resistance at 1.2183, recognized as a pullback resistance, which might limit the price’s upward motion temporarily. Beyond this, the 2nd resistance level is at 1.2279, also a pullback resistance, marking another significant area that could act as a barrier to the price’s further ascent.
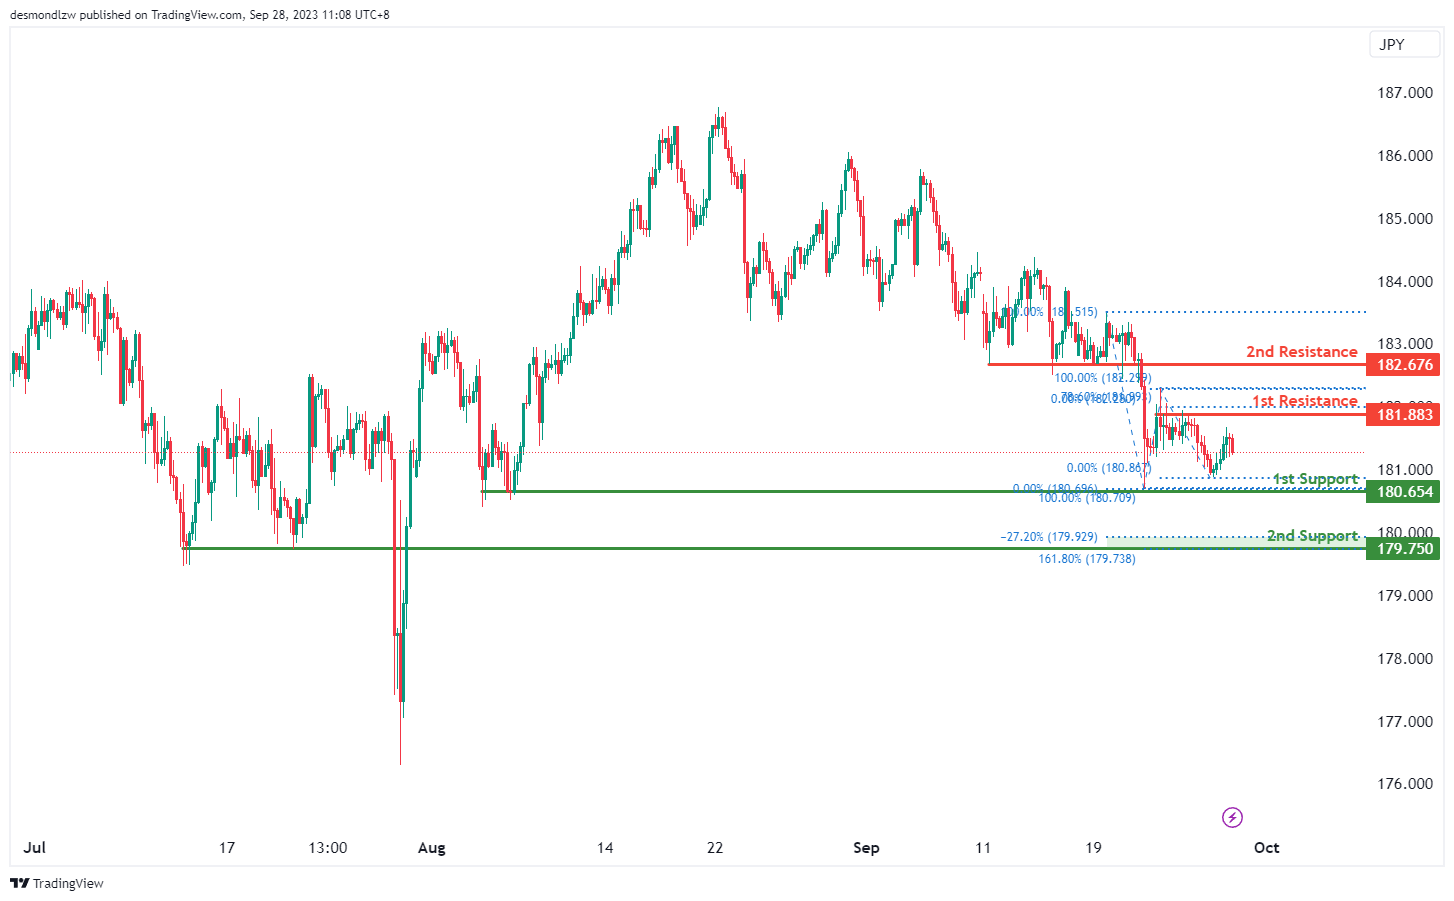
GBP/JPY:
The GBP/JPY chart is currently exhibiting a bearish overall momentum, indicating the potential for a further bearish continuation.
The 1st support level at 180.65 is considered a multi-swing low support. This suggests that it has previously served as a significant level where buyers have stepped in. Traders will be watching this level closely for potential signs of a bounce or a reversal in the bearish trend.
Below that, the 2nd support at 179.75 offers additional reinforcement for potential support. It not only represents a pullback support but also aligns with the -27% Fibonacci Expansion and the 161.80% Fibonacci Extension. The confluence of these factors makes this level an important area to monitor for potential reversals or a pause in the bearish movement.
On the resistance side, the 1st resistance level at 181.88 is a multi-swing high resistance. This level could act as a barrier to any bullish attempts, serving as a point where sellers might be active.
Above that, the 2nd resistance at 182.67 is identified as a pullback resistance, further reinforcing the potential for bearish continuation.
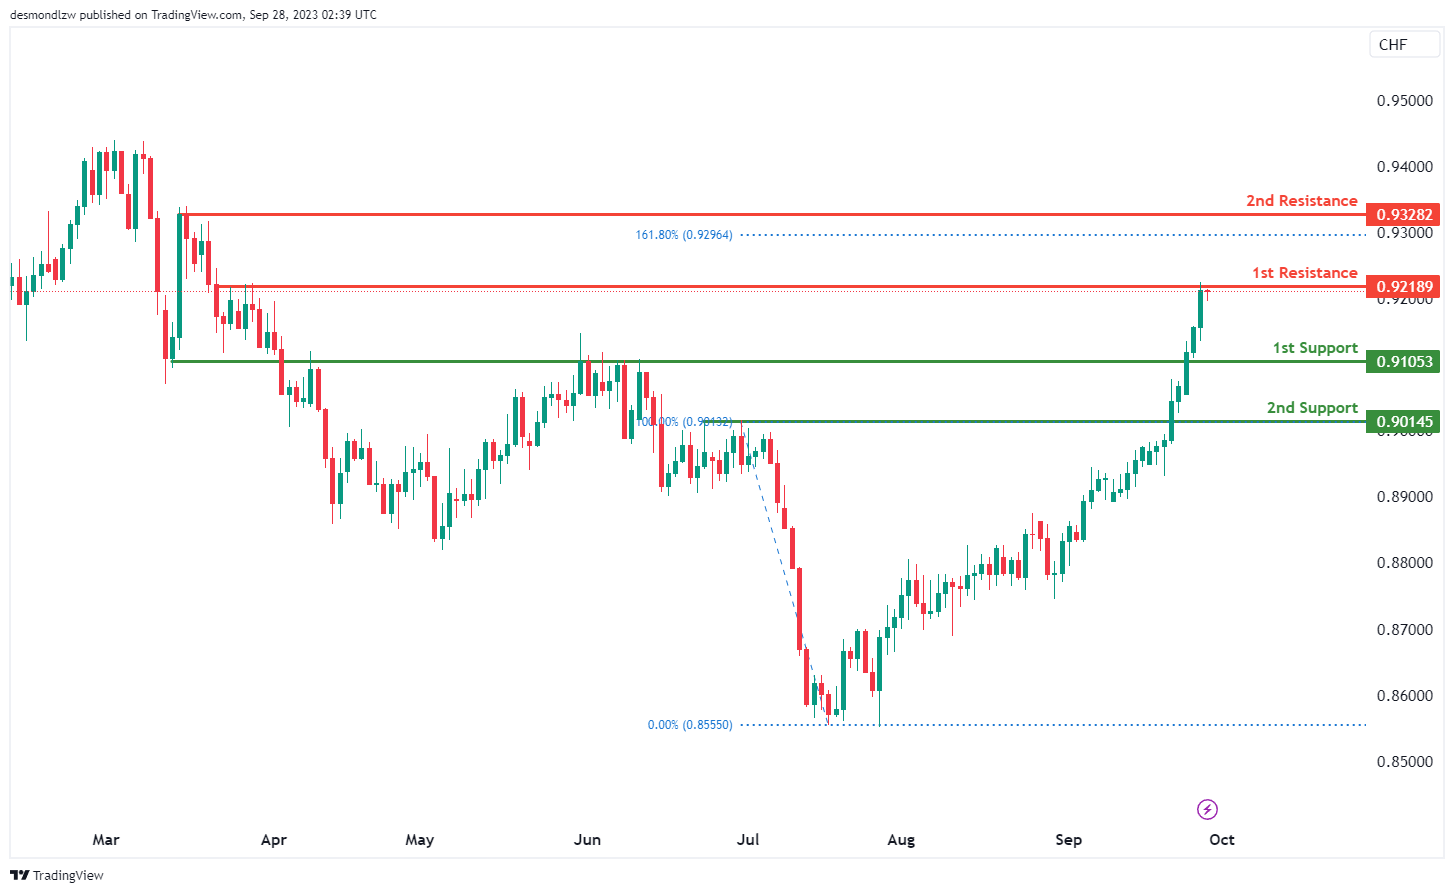
USD/CHF:
The USD/CHF chart currently demonstrates a bullish momentum. There is a potential scenario where the price might break above the intermediate resistance level and make a bullish continuation towards the 1st resistance level.
The intermediate resistance level at 0.9186 is identified as a pullback resistance while the 1st resistance level at 0.9206 is also marked as a pullback resistance. Additionally, the 2nd resistance level at 0.9251 is identified as a pullback resistance, a potential barrier for further price increases.
To the downside, the intermediate support level at 0.9143 is identified as a pullback support while the 1st support level at 0.9078 is also marked as a pullback support. Additionally, the 2nd support level at 0.9013 is identified as a pullback support.
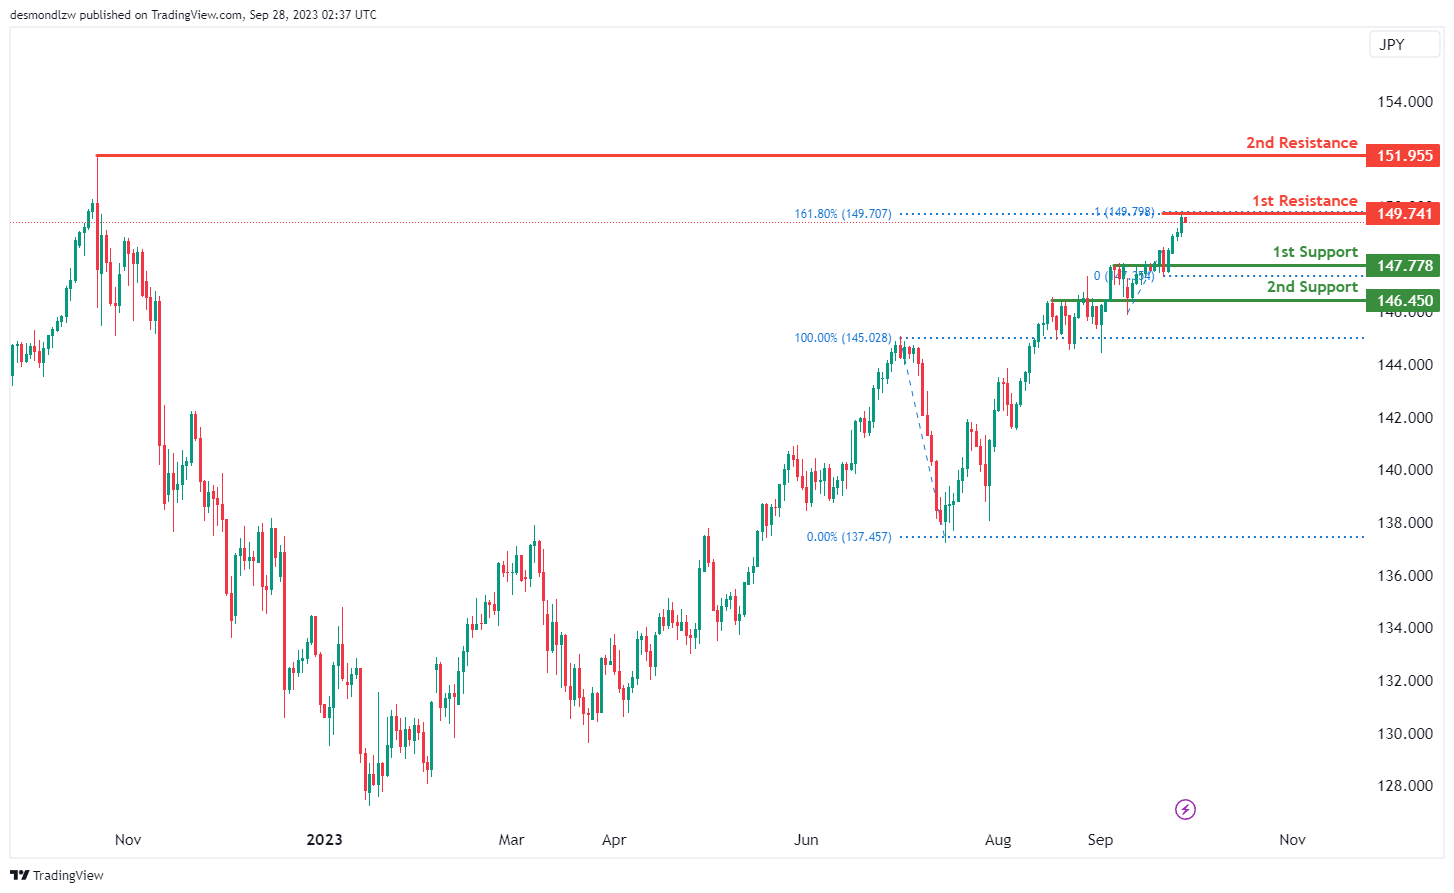
USD/JPY:
The USD/JPY chart is presently showing bearish momentum, with a forecasted bearish reaction off the 1st resistance at 149.74, leading to a potential drop to the 1st support at 147.77. The 1st support level is significant, serving as a pullback support where the price might find necessary support. Additionally, the 2nd support at 146.45, identified as an overlap support, offers another potential zone to halt further declines.
On the resistance side, the 1st resistance at 149.74 is crucial, with the convergence of the 161.80% Fibonacci Extension and 100% Fibonacci Projection, indicating a Fibonacci confluence and underlining its importance as a potential resistance zone. Beyond this, the 2nd resistance level at 151.95, recognized as a swing high resistance, further delineates a barrier for potential upward movements.
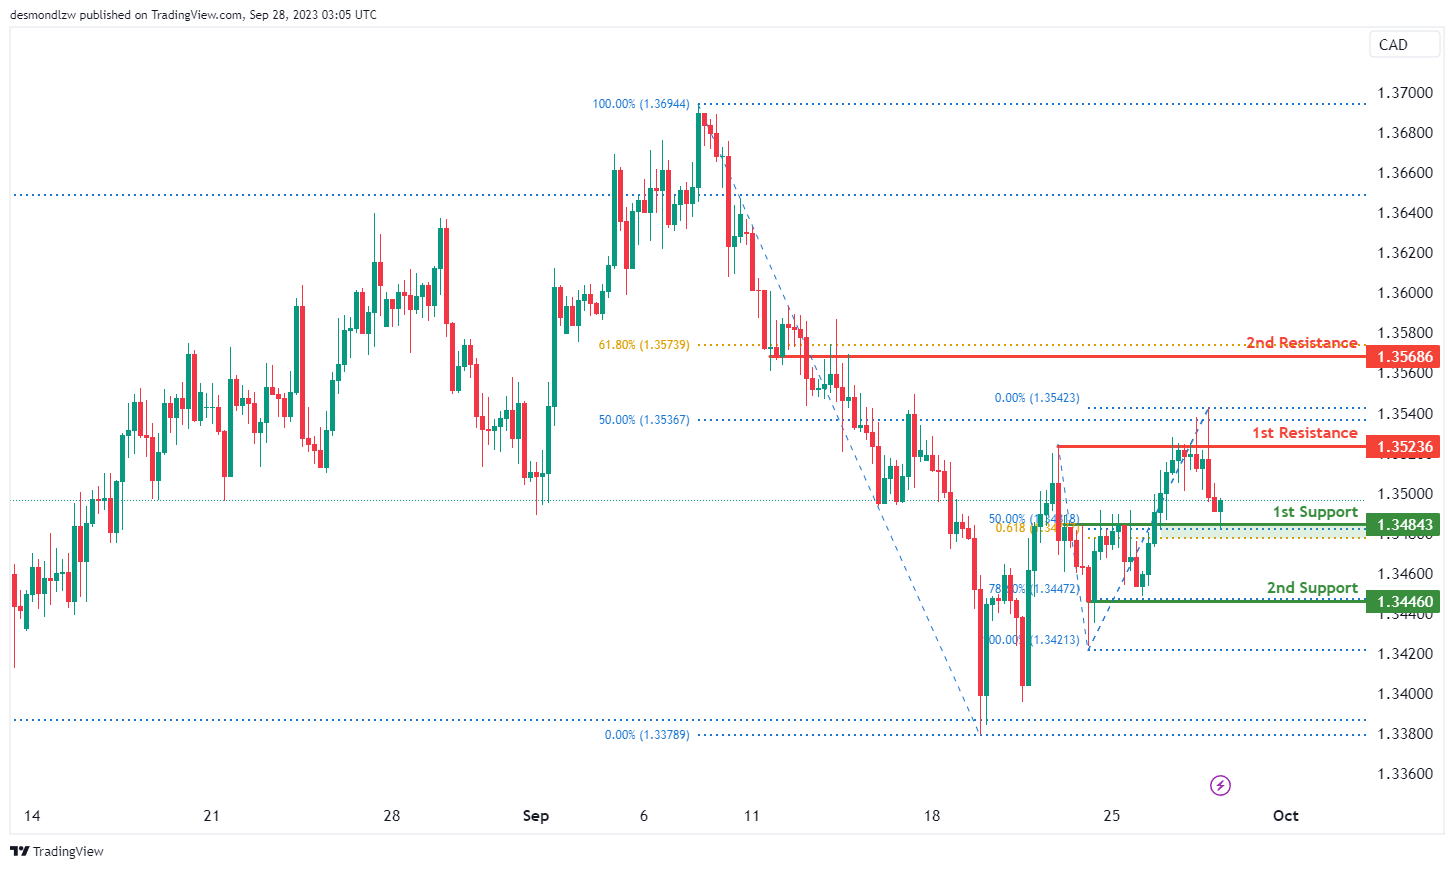
USD/CAD:
The chart for USD/CAD is currently indicating an overall bullish momentum. In this scenario, there is a potential for a bullish continuation towards the 1st resistance level.
The 1st resistance level at 1.3524 is identified as a pullback resistance that aligns close to the 50.00% Fibonacci retracement level. Additionally, the 2nd resistance level at 1.3569 is marked as a pullback resistance that aligns with the 61.80% Fibonacci retracement level.
To the downside, the 1st support level at 1.3484 is identified as an overlap support that aligns with a confluence of Fibonacci levels i.e. the 50.00% retracement and the 61.80% projection levels. Further below, the 2nd support level at 1.3446 is also noted as a pullback support that aligns with the 78.60% Fibonacci retracement level.
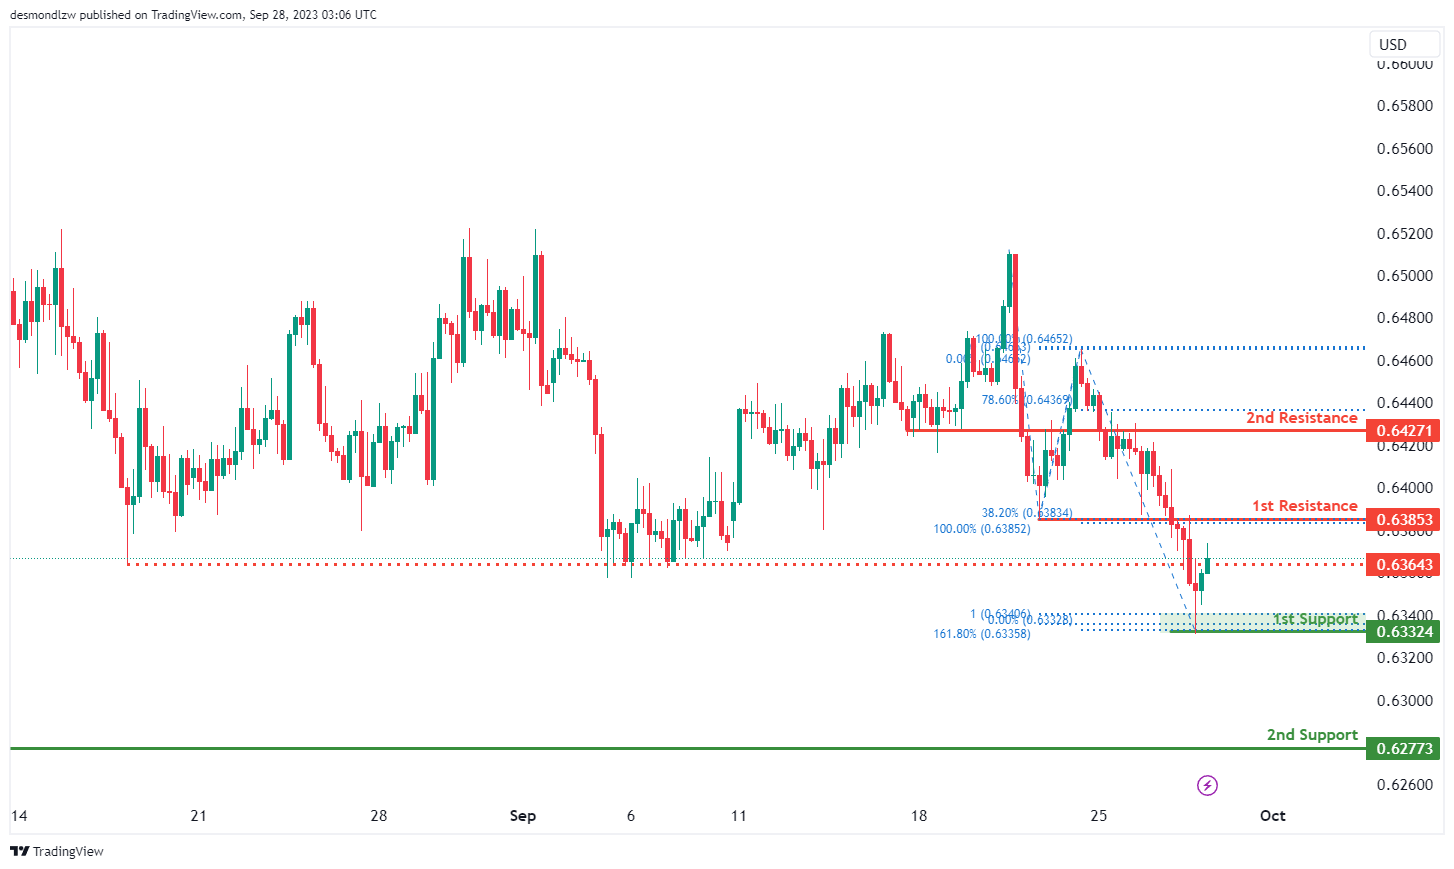
AUD/USD:
The AUD/USD chart is currently displaying an overall bullish momentum, suggesting that price may continue its bullish movement towards the 1st resistance level should price break above the intermediate resistance.
The intermediate resistance level at 0.6364 is identified as a pullback resistance while the 1st resistance level at 0.6385 is also marked as a pullback resistance that aligns with the 38.20% Fibonacci retracement level. Further up, the 2nd resistance level at 0.6427 is identified as an overlap resistance that aligns close to the 78.60% Fibonacci retracement level.
To the downside, the 1st support level at 0.6332 is identified as a swing-low support that aligns with a confluence of Fibonacci levels i.e. the 161.80% extension and the 100.00% projection levels. Additionally, the 2nd support level at 0.6277 is also noted as a multi-swing-low support.
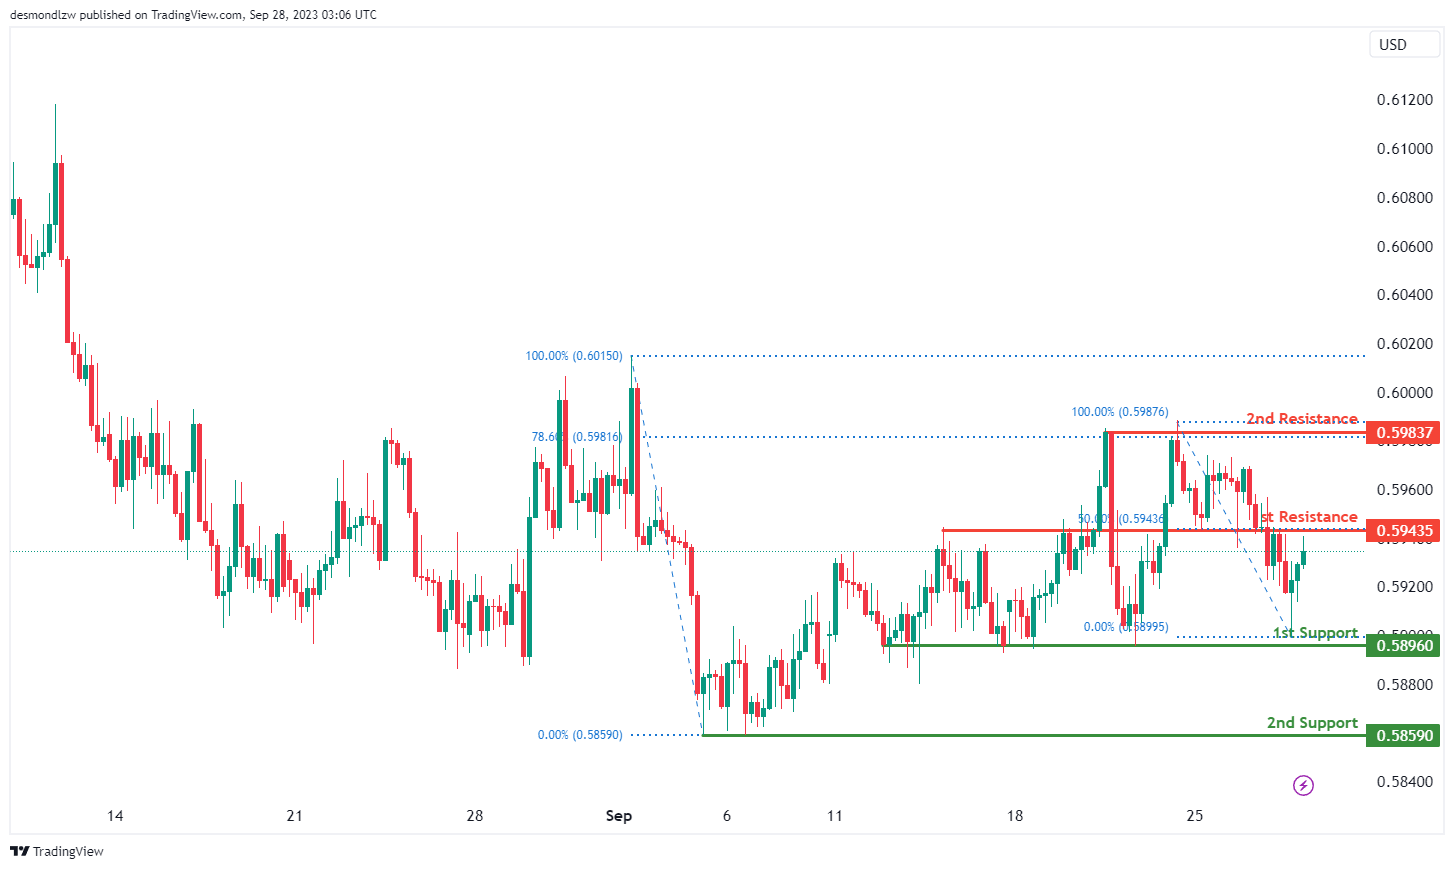
NZD/USD
The NZD/USD chart is currently showing an overall bullish momentum, suggesting that the price may rise towards the 1st resistance level.
The 1st resistance level at 0.5944 is identified as an overlap resistance that aligns with the 50.00% Fibonacci retracement level. Further up, the 2nd resistance level at 0.5984 is marked as a pullback resistance that coincides with the 78.60% Fibonacci retracement level.
To the downside, the 1st support level at 0.5896 is identified as a pullback support while the 2nd support level at 0.5859 is also marked as a pullback support which could potentially act as a major support zone.
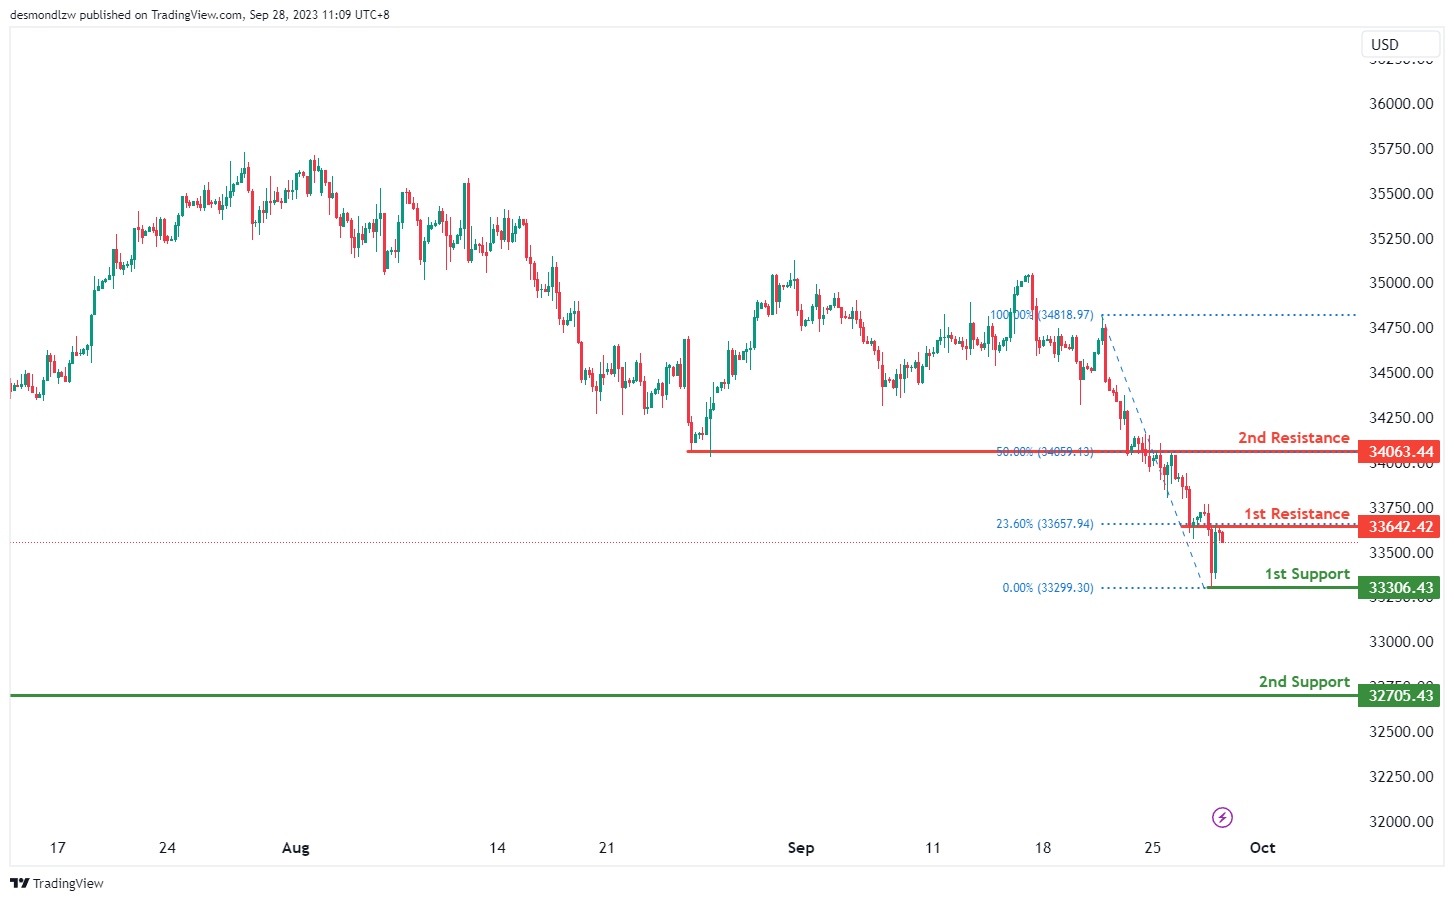
DJ30:
The DJ30, representing the Dow Jones Industrial Average, currently maintains a bearish overall momentum on the chart.
In the upcoming price action, there is potential for a bearish scenario, where the price of DJ30 may experience a bearish reaction upon approaching the 1st resistance level. Subsequently, it could decline, targeting the 1st support level.
The 1st support level, located at 33306.43, holds significance due to its historical role as a swing low support. This indicates that in the past, this level has acted as a substantial area of buying interest, potentially providing support and preventing further declines.
An intermediate support level is also noted at 32705.43, signifying a multi-swing low support. Such a support level carries weight as it suggests a history of multiple instances where buyers have intervened, reinforcing its significance as a potential area of price support.
On the resistance side, the 1st resistance is marked at 33642.42. This resistance level is justified by its status as an overlap resistance, indicating a point where selling pressure has historically emerged. Additionally, it aligns with the 23.60% Fibonacci Retracement level, further enhancing its significance as a potential area of resistance.
The 2nd resistance level, positioned at 34063.44, is also noteworthy, as it represents another overlap resistance.
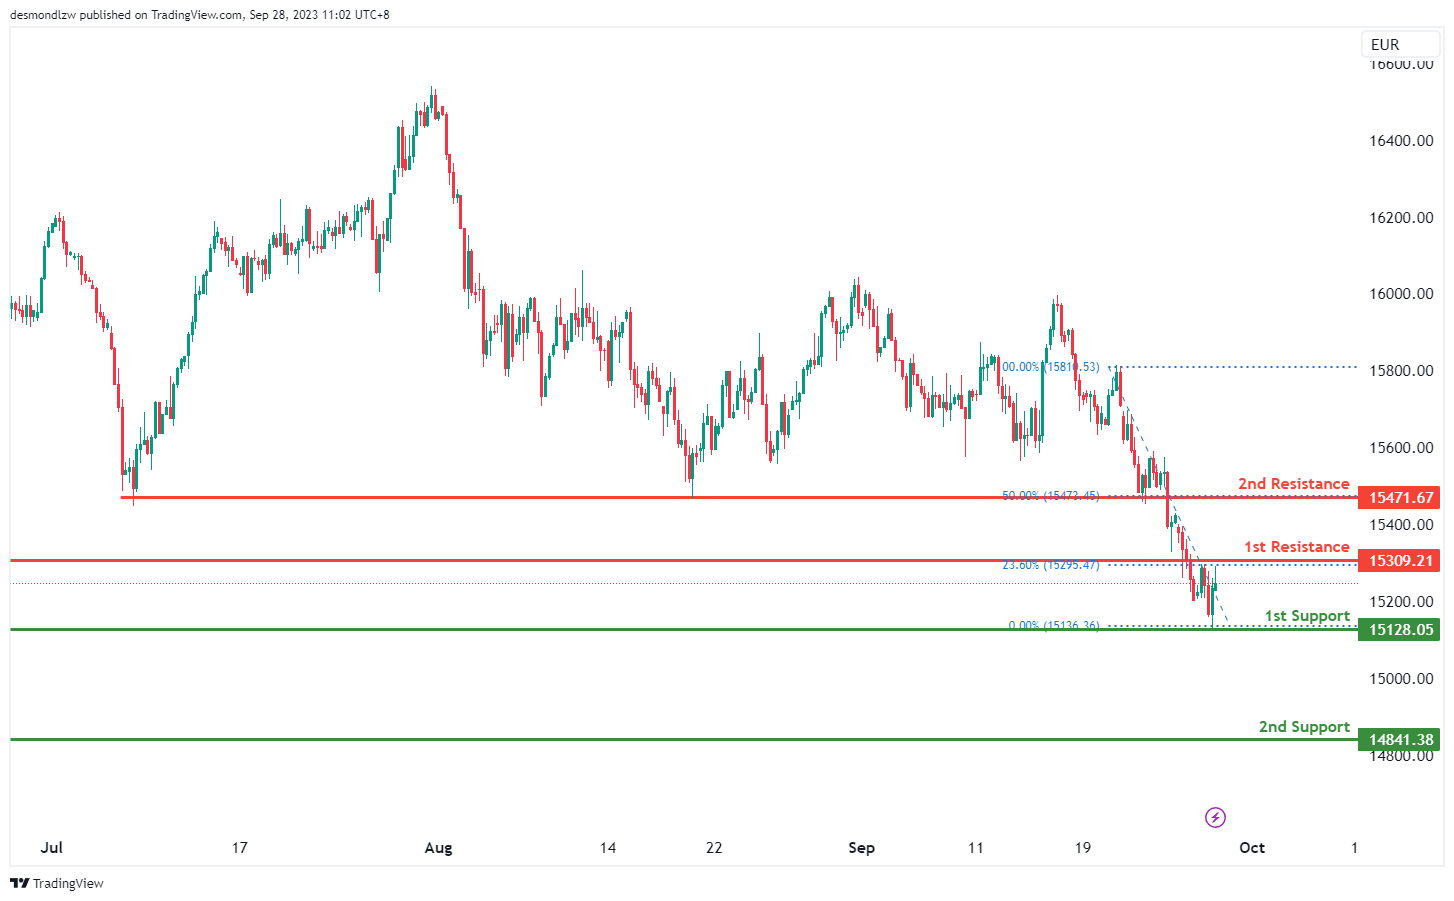
GER30:
The GER30, representing the Germany 30 (DAX) index, currently exhibits a bearish overall momentum on the chart. There is a potential scenario in which the price may experience a bearish reaction upon reaching the 1st resistance level and subsequently decline towards the 1st support level.
The 1st support level, situated at 15128.05, holds significance as it represents a multi-swing low support. This level has historically acted as a strong area of buying interest, indicating a potential zone where buyers may step in to support the price.
Additionally, the 2nd support level at 14841.38 is worth noting, as it corresponds to a swing low support. Such support levels, particularly those with a history of multiple instances of buying activity, can be robust areas of price support.
On the resistance side, the 1st resistance level is marked at 15309.21. This resistance is justified by its role as a pullback resistance and aligns with the 23.60% Fibonacci Retracement level. This confluence of resistance factors enhances the significance of this level as a potential area where selling pressure may emerge.
The 2nd resistance level, positioned at 15471.67, is another notable level as it also represents a pullback resistance. Moreover, it coincides with the 50% Fibonacci Retracement level, reinforcing its importance as a potential area of strong selling interest.
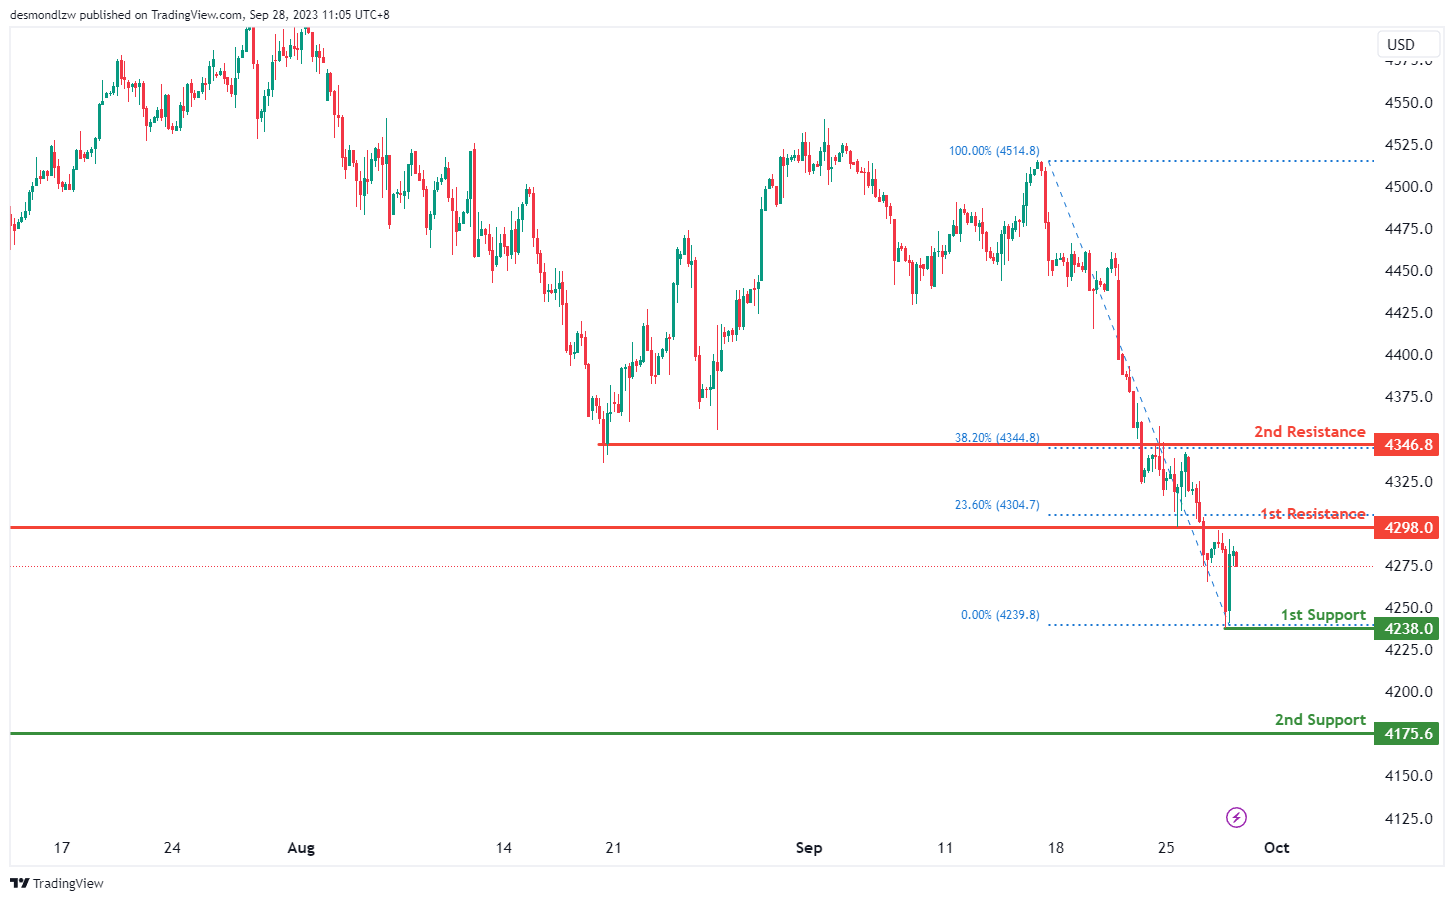
US500
The US500 chart currently exhibits a bearish momentum, with contributing factors indicating a potential bearish continuation. Price action may target the 1st support level at 4238.0, which is characterized by a swing low support. This level could act as a key area where buyers may step in to provide some stability.
Further down, the 2nd support at 4175.6, also identified as a swing low support, represents an additional layer of potential support and could serve as a significant level if the bearish momentum persists.
On the upside, the 1st resistance level at 4298.0 presents a barrier to upward movement. This resistance is marked by a pullback resistance and is further strengthened by the presence of a 23.60% Fibonacci Retracement.
Beyond that, the 2nd resistance level at 4346.8 is characterized as an overlap resistance, with an additional confluence of a 38.20% Fibonacci Retracement, making it a potentially strong resistance area for any bullish attempts.
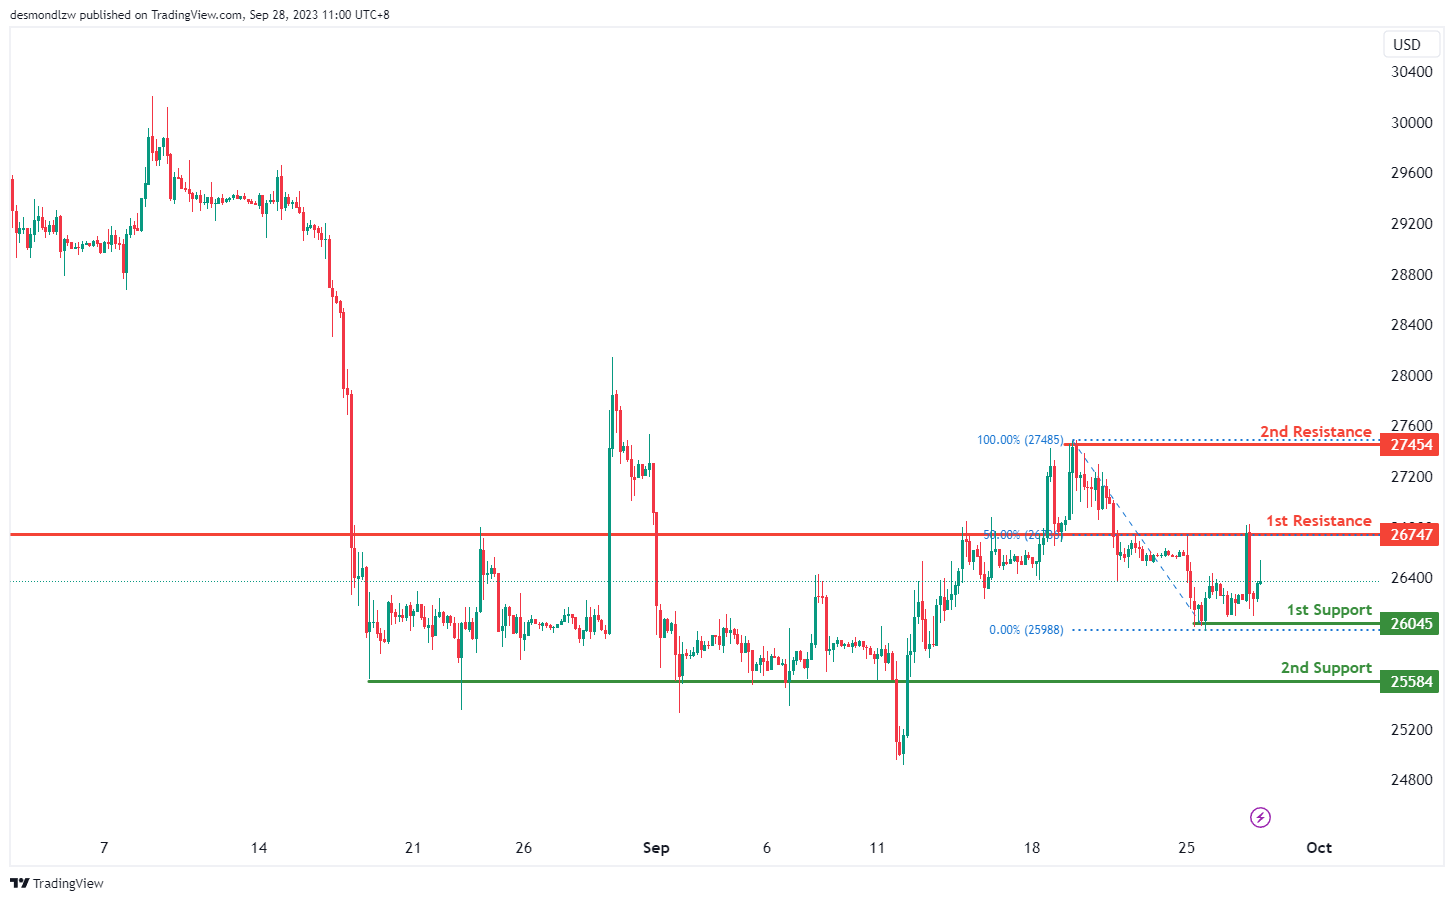
BTC/USD:
The instrument BTC/USD currently exhibits a neutral overall momentum on the chart, with factors contributing to this neutrality.
There’s a potential scenario where the price could fluctuate between the 1st resistance and 1st support levels.
The 1st support at 26045 is considered strong because it functions as a multi-swing low support, suggesting it has held up as a reliable support level in the past.
The 2nd support at 25584 is also noteworthy as it acts as a pullback support, indicating a level where buyers may step in.
On the resistance side, we have the 1st resistance at 26747, which is significant because it represents an overlap resistance and coincides with the 50% Fibonacci Retracement level. This makes it a formidable resistance level.
Furthermore, the 2nd resistance at 27454 is notable as it represents a swing high resistance.
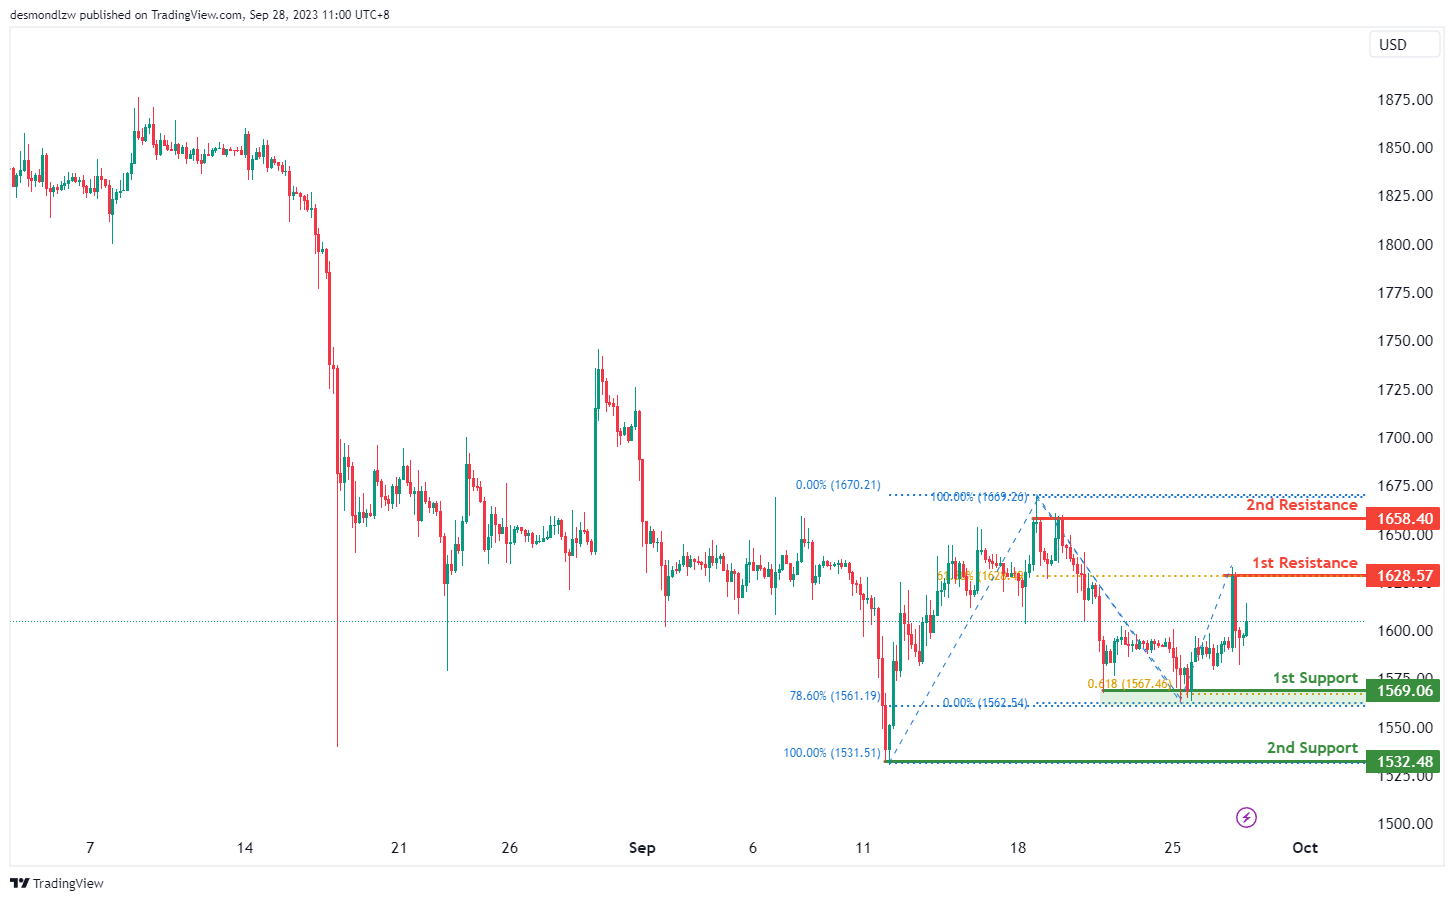
ETH/USD:
For the instrument ETH/USD, the overall momentum of the chart currently stands at a neutral position. This is supported by various factors contributing to this sense of neutrality.
In the foreseeable future, there is a potential scenario where the price of ETH/USD may exhibit a fluctuation pattern, primarily oscillating between the 1st resistance and the 1st support levels.
The 1st support level, quantified at 1569.06, holds significance due to several compelling reasons. Firstly, it functions as a multi-swing low support, signifying its historical importance as a level where buying interest has emerged. Moreover, this support level aligns with both the 61.80% Fibonacci Projection and the 78.60% Fibonacci Retracement levels, showcasing a robust Fibonacci confluence.
The 2nd support, situated at 1532.48, is noteworthy as well, being a swing low support. This implies that it has served as a substantial level of support in past price movements.
Conversely, on the resistance side, we have the 1st resistance marked at 1628.57. This resistance is substantiated by its role as a swing high resistance, historically capping further upward price movements.
Furthermore, the 2nd resistance positioned at 1658.40 carries significance as it represents a multi-swing high resistance.
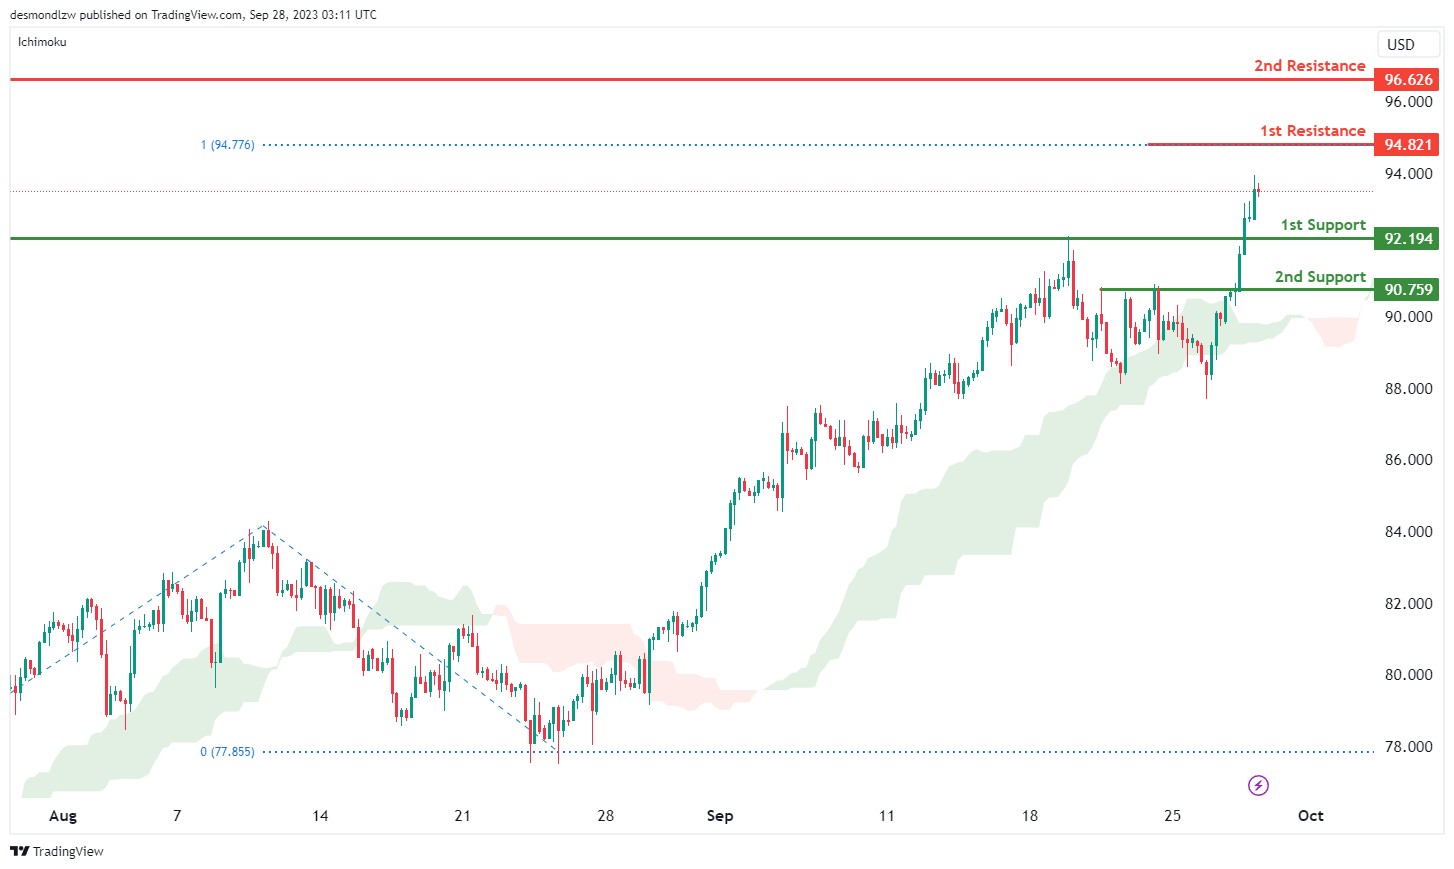
WTI/USD:
The WTI (West Texas Intermediate) chart currently exhibits a bullish momentum with price trading above the bullish Ichimouku cloud. There is a potential for price to make a bullish continuation towards the 1st resistance level.
The 1st resistance level at 94.82 is identified as a resistance level that aligns with the 100.00% Fibonacci projection level while the 2nd resistance level at 96.63 is noted as a swing-high resistance where price could run into a significant barrier.
To the downside, the 1st support level at 92.19 is identified as a pullback support while the 2nd support level at 90.76 is also marked as a pullback support, suggesting a potential strong support level in the past.
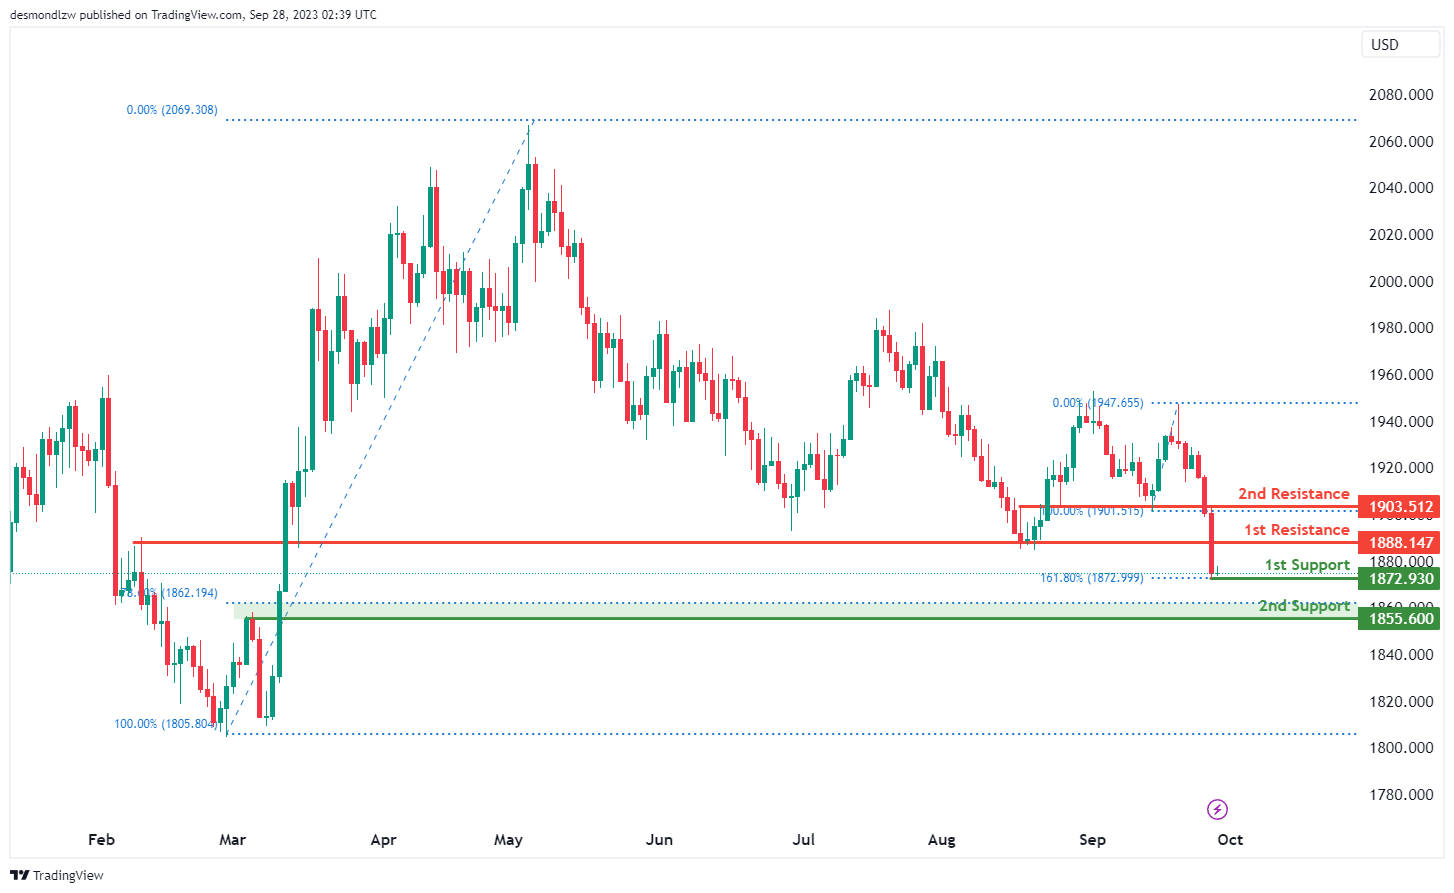
XAU/USD (GOLD):
The XAUUSD chart currently has a weak bullish momentum with low confidence. A potential scenario is a bullish bounce off the 1st support at 1872.93, heading towards the 1st resistance at 1888.14. The 1st support is significant, aligning with the 161.80% Fibonacci Extension, making it a crucial level for potential upward movements. Additionally, the 2nd support at 1855.60 acts as a pullback support, with the 78.60% Fibonacci Retracement enhancing its role as a key support level.
On the resistance side, the 1st resistance at 1888.14 and the 2nd resistance at 1903.51 are both identified as pullback resistances, providing potential barriers to price increases.


