
DXY:
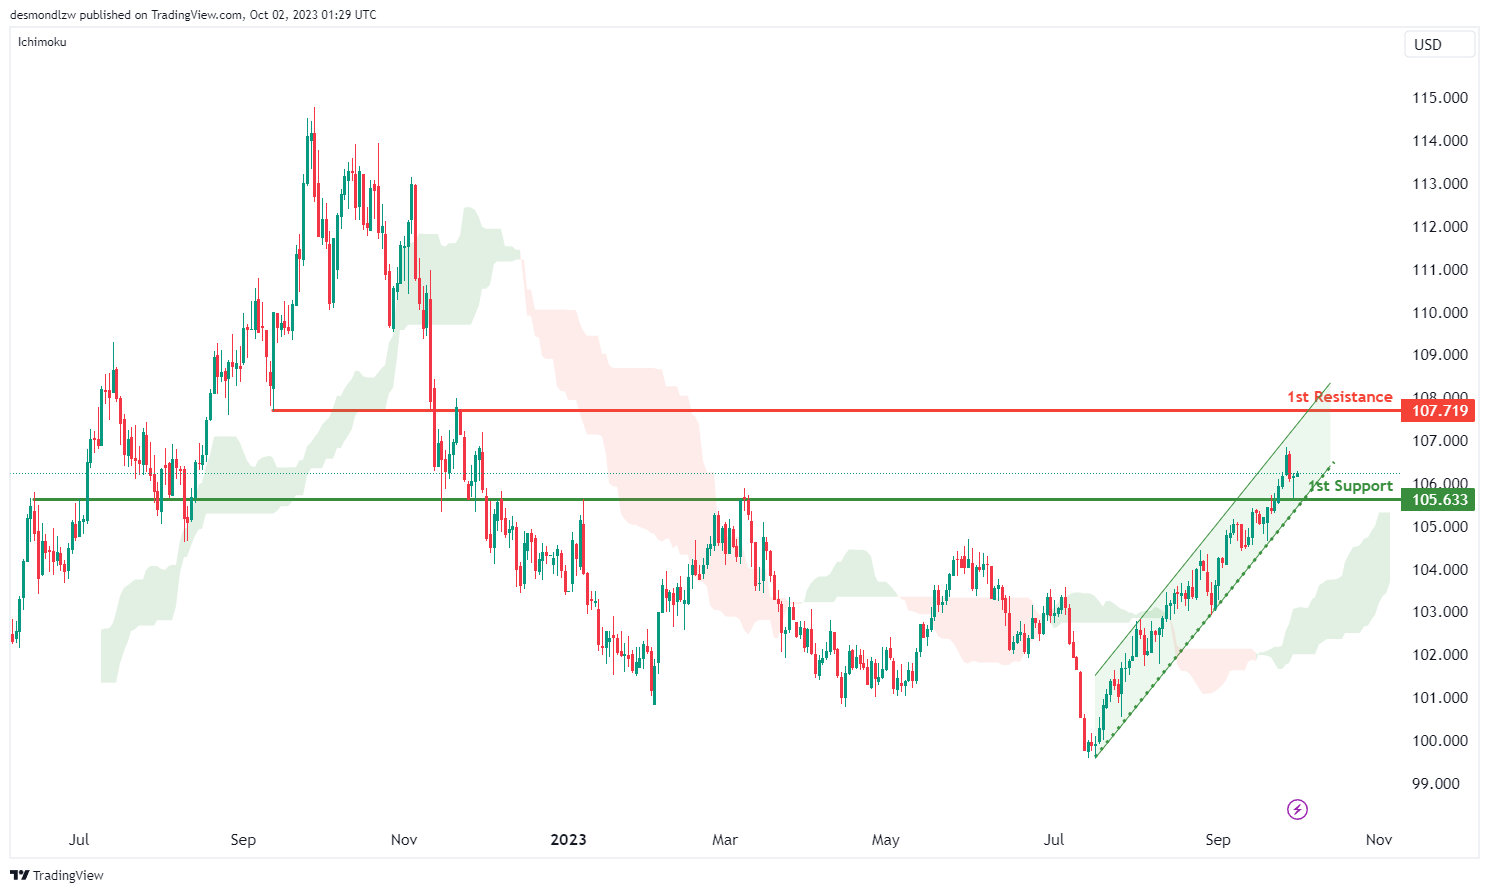
The DXY (US Dollar Index) chart is currently experiencing bullish momentum, with several factors contributing to this trend. These factors include the price being above the bullish Ichimoku cloud and within a bullish ascending channel, both of which support the bullish outlook.
In this context, there is a potential scenario where the price could continue its bullish movement towards the 1st resistance level at 107.71. This level is identified as an overlap resistance, signifying its significance as a potential barrier to further upward movements.
On the downside, the 1st support at 105.63 is recognized as an overlap support, suggesting it may act as a strong support zone if the price retraces.
EUR/USD:
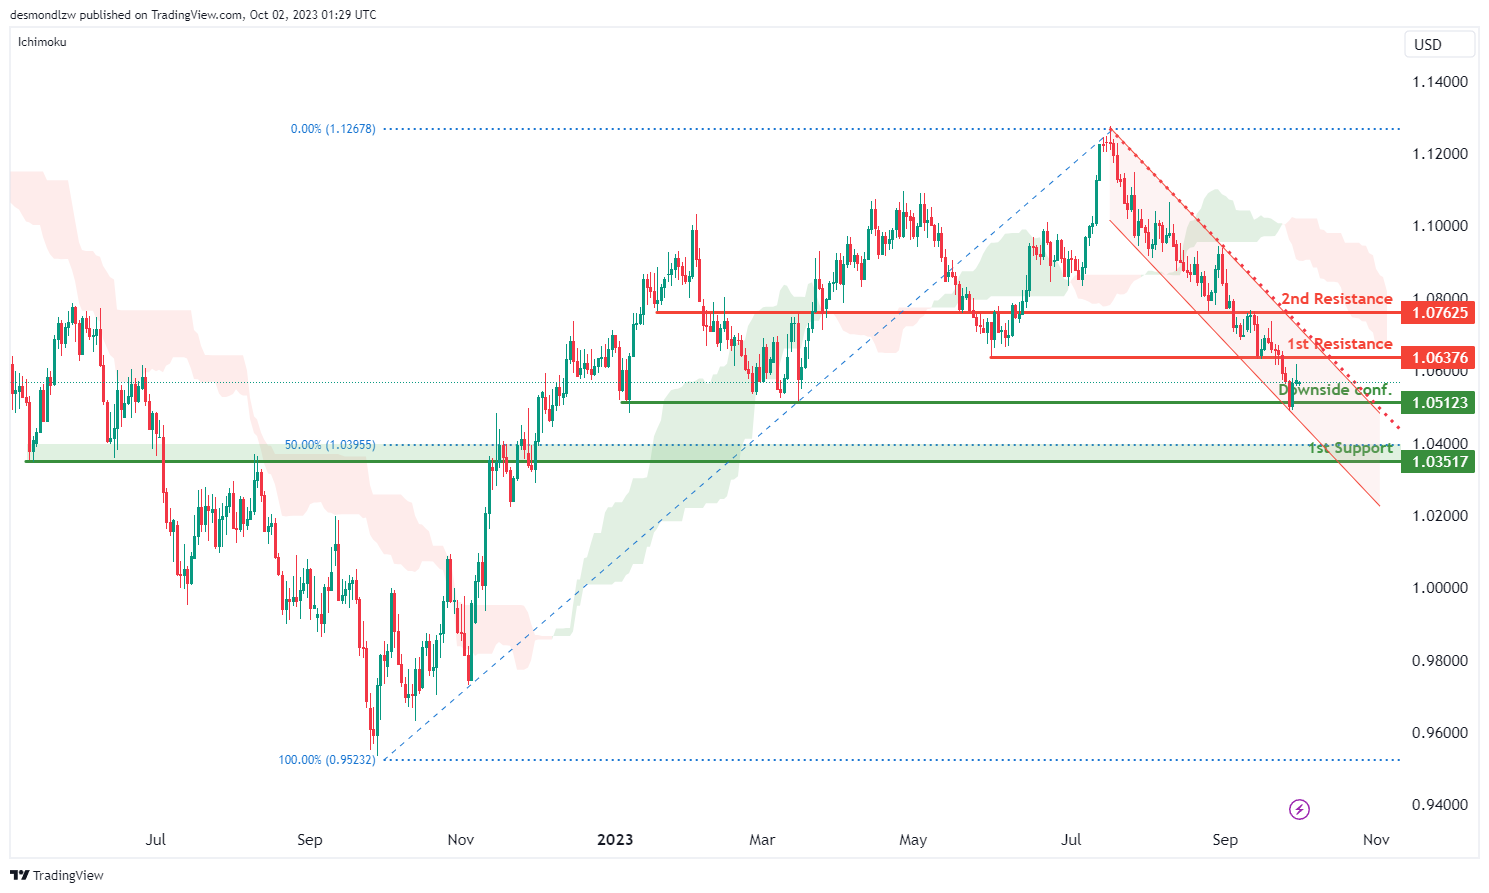
The EUR/USD chart currently exhibits a bearish overall momentum, primarily due to the following factors: it is trading below the bearish Ichimoku cloud and within a bearish channel, indicating a prevailing bearish trend.
In this context, there is a potential scenario where the price could continue its bearish movement towards the “waiting for downside confirmation” level at 1.0351. This level is significant as it is identified as an overlap support and aligns with the 50% Fibonacci Retracement, highlighting its potential importance as a support zone.
The 1st support at 1.0512 is another noteworthy level, characterized as a multi-swing low support, reinforcing its role as a potential support area.
On the resistance side, the 1st resistance level at 1.0637 is identified as an overlap resistance, which may act as a barrier to any potential upward movements. Beyond this, the 2nd resistance at 1.0762 is marked as a swing high resistance
EUR/JPY:
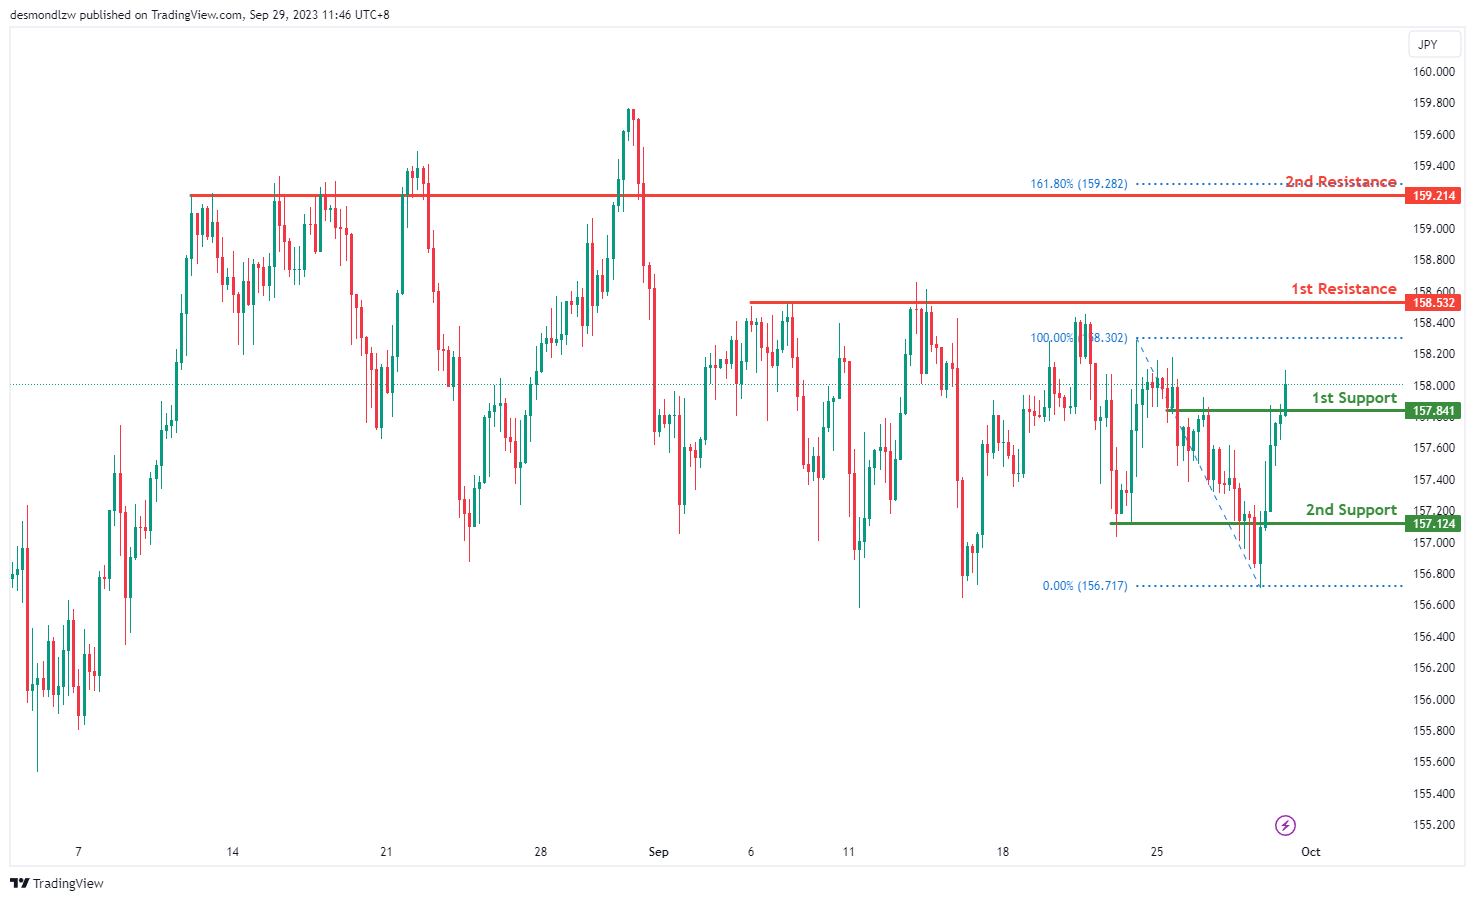
The EUR/JPY chart currently exhibits a bullish overall momentum, indicating a positive sentiment in the market. There’s potential for a bullish continuation in the price movement towards its first resistance.
The first support level at 157.84 is considered a good level of support due to its characteristics as a pullback support, which suggests that it may act as a foundation for any potential bullish movement. Additionally, the second support at 157.12, also identified as a pullback support, provides further reinforcement for the bullish case, indicating potential stability in this price range.
Looking ahead, the chart faces its first resistance at 158.53, which is characterized as a multi-swing high resistance. This level represents a key obstacle that, if breached, could signify a strong bullish move. Beyond this, there is a second resistance at 159.21, identified as a pullback resistance, which may serve as an additional target for bullish price action.
In summary, the bullish momentum in the EUR/JPY chart, supported by pullback supports, suggests the potential for a bullish continuation towards the first and second resistance levels, indicating opportunities for further price appreciation.
EUR/GBP:
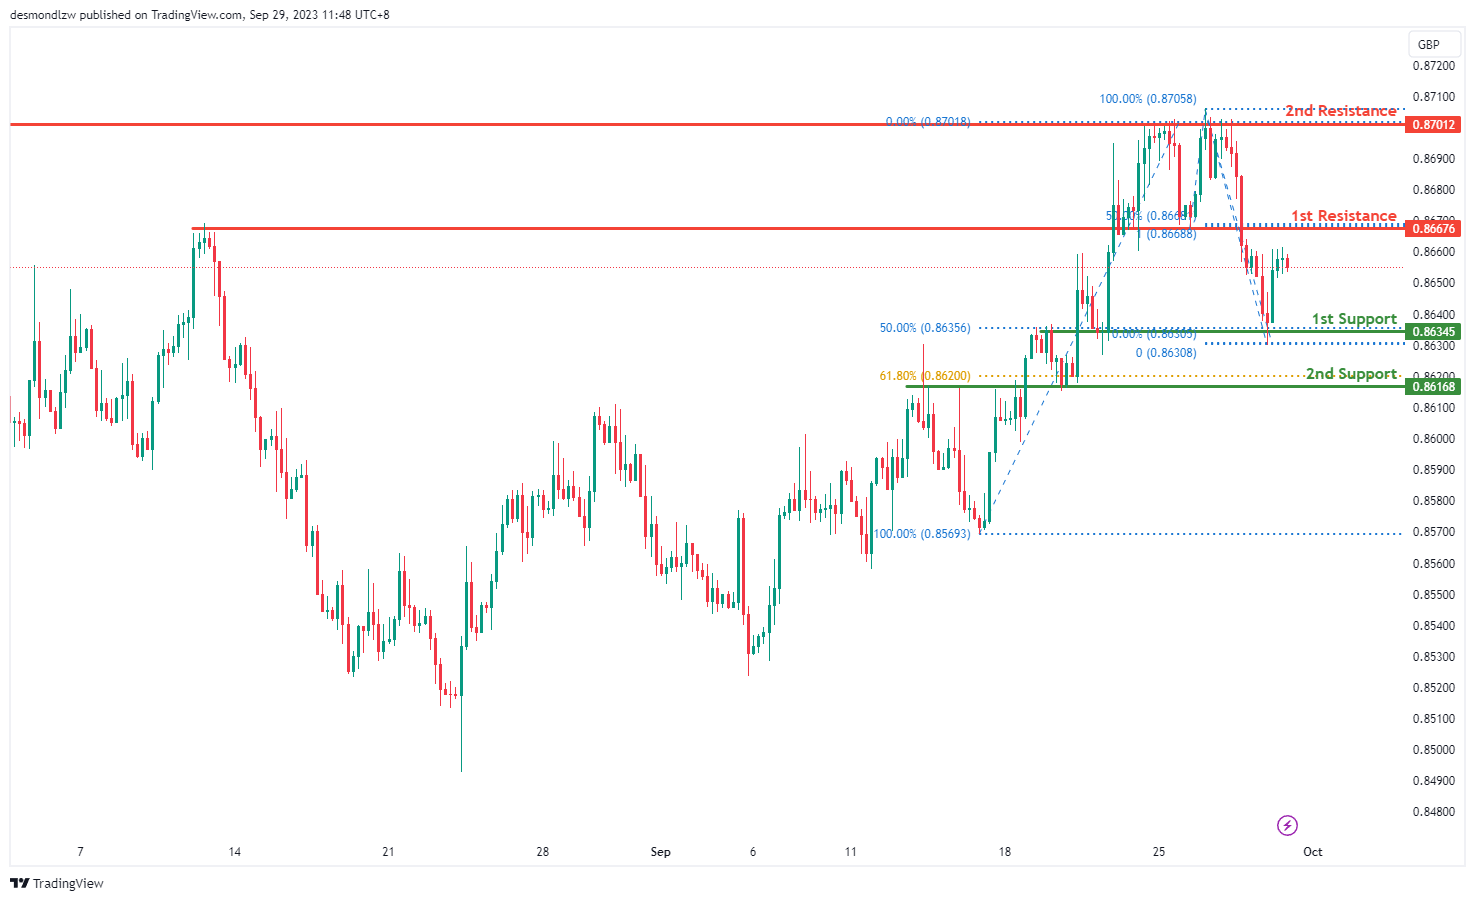
The EUR/GBP chart currently exhibits a bearish overall momentum, suggesting a prevailing downtrend in the market. However, there is a potential short-term price movement anticipated, which could involve a rise towards the first resistance before reversing and declining towards the first support level.
The first support level at 0.8634 is considered a significant support zone as it represents an overlap support and coincides with the 50% Fibonacci Retracement level. This level may act as a foundation for potential price reversals or as a target for bearish movements. Additionally, the second support at 0.8616, identified as an overlap support and aligned with the 61.80% Fibonacci Retracement, provides further support for potential price rebounds.
In the short term, the chart is expected to face its first resistance at 0.8667. This level is characterized as a pullback resistance and coincides with the 50% Fibonacci Retracement, making it a pivotal point where a reversal may occur. Beyond this, there is a second resistance at 0.8701, which is identified as a multi-swing high resistance, signifying a formidable barrier for bullish advances.
In summary, while the overall momentum of the EUR/GBP chart remains bearish, there is a short-term scenario in which the price may rise towards the first resistance before encountering potential selling pressure, leading to a subsequent drop towards the first and second support levels.
GBP/USD:
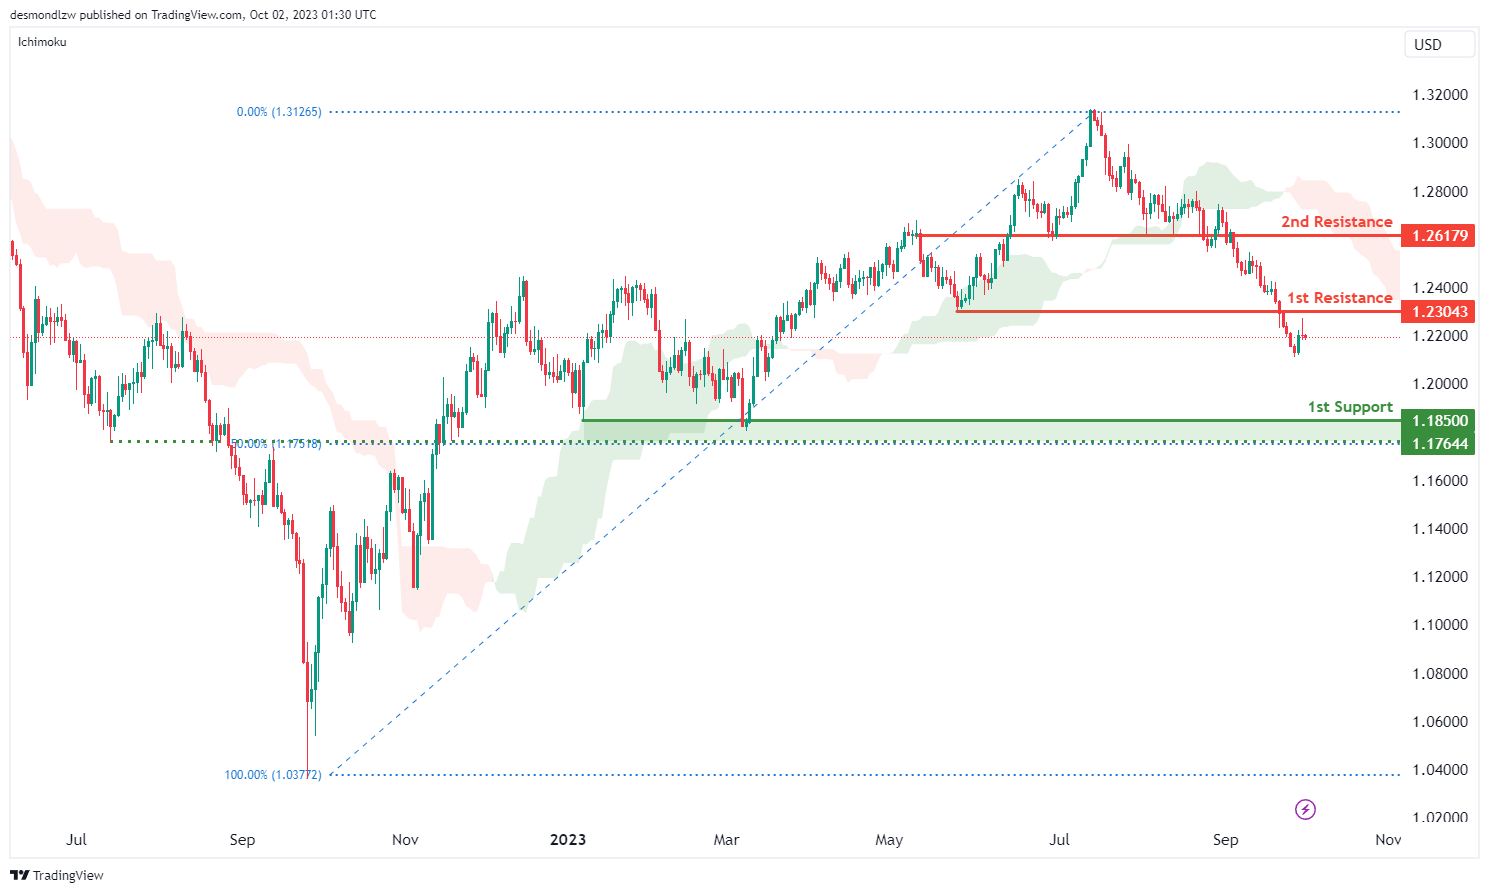
The GBP/USD chart currently reflects a bearish overall momentum, primarily attributed to the fact that the price is trading below the bearish Ichimoku cloud.
In this context, there is a potential scenario where the price could continue its bearish movement towards the 1st support at 1.185. This level is significant as it is identified as a swing low support.
Additionally, there is an intermediate support level at 1.1764, which holds importance as it is characterized by an overlap support and aligns with the 50% Fibonacci Retracement, further highlighting its potential as a support zone.
On the resistance side, the 1st resistance level at 1.2304 is noteworthy, marked as a pullback resistance, suggesting its significance as a potential barrier to upward movements. Beyond this, the 2nd resistance at 1.2617 also serves as a pullback resistance,
GBP/JPY:
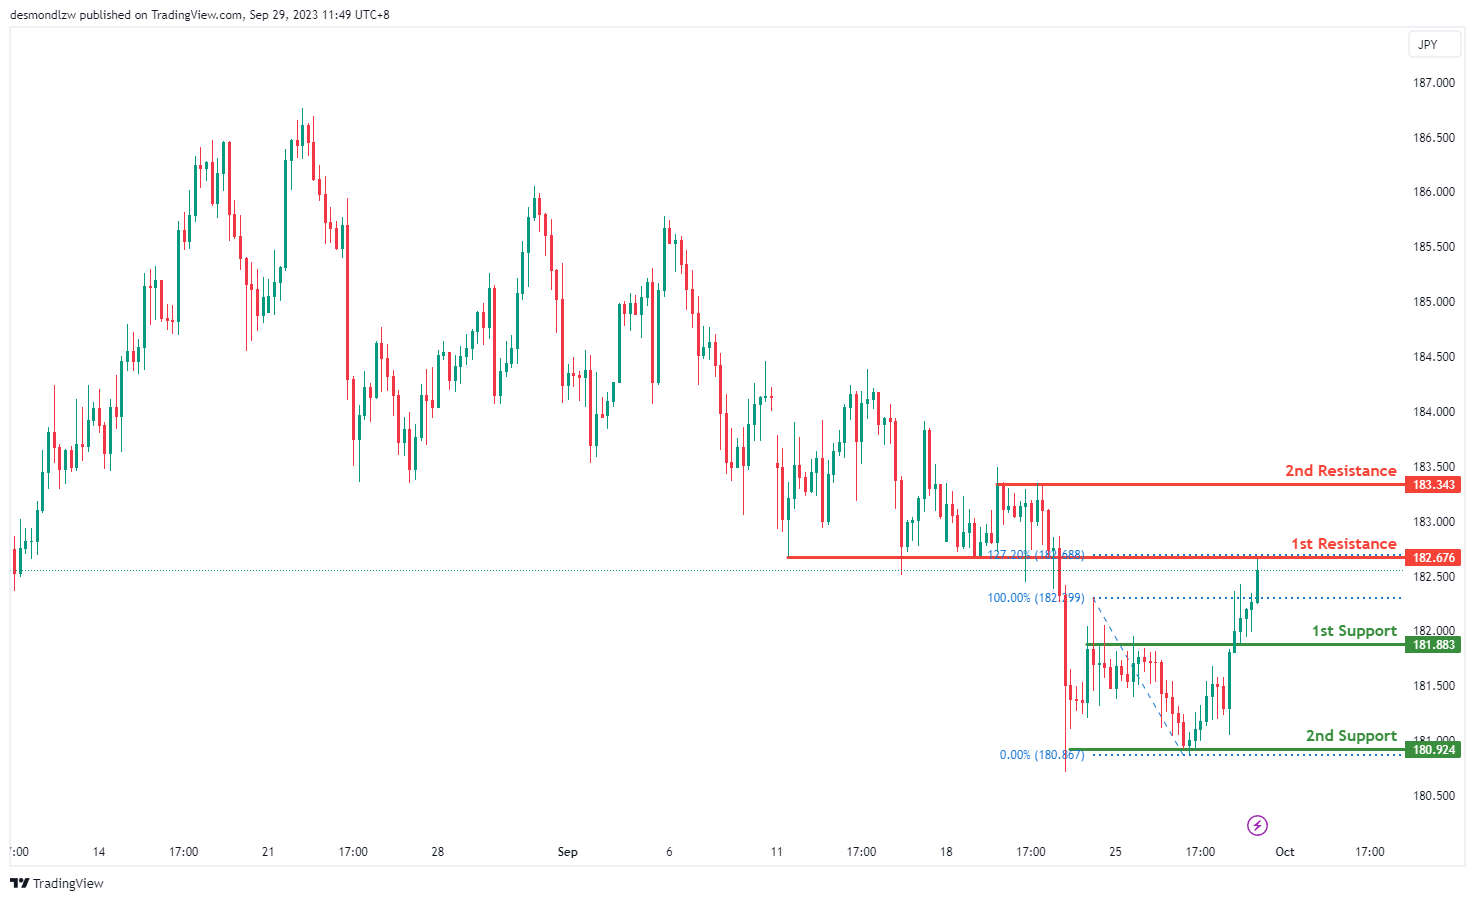
The GBP/JPY chart currently exhibits a bearish overall momentum, indicating a prevailing downtrend in the market. It is anticipated that the price may experience a bearish reaction off the first resistance level, potentially leading to a decline towards the first support.
The first support level at 181.88 is considered a significant support zone, characterized as an overlap support. This level holds historical significance and may act as a strong foundation for potential price rebounds or as a target for bearish movements. Additionally, the second support at 180.92 is identified as a multi-swing low support, reinforcing its significance as a potential level where buyers could step in.
In terms of resistance, the chart is expected to encounter its first resistance at 182.67. This level is defined as a pullback resistance and is further strengthened by the presence of the 127.20% Fibonacci Extension, making it a critical zone for potential reversals or bearish reactions. Beyond this, there is a second resistance at 183.34, identified as a multi-swing high resistance, indicating a substantial barrier for bullish advances.
In summary, while the overall momentum of the GBP/JPY chart remains bearish, there is a scenario in which the price could react bearishly off the first resistance and decline towards the first and second support levels.
USD/CHF:
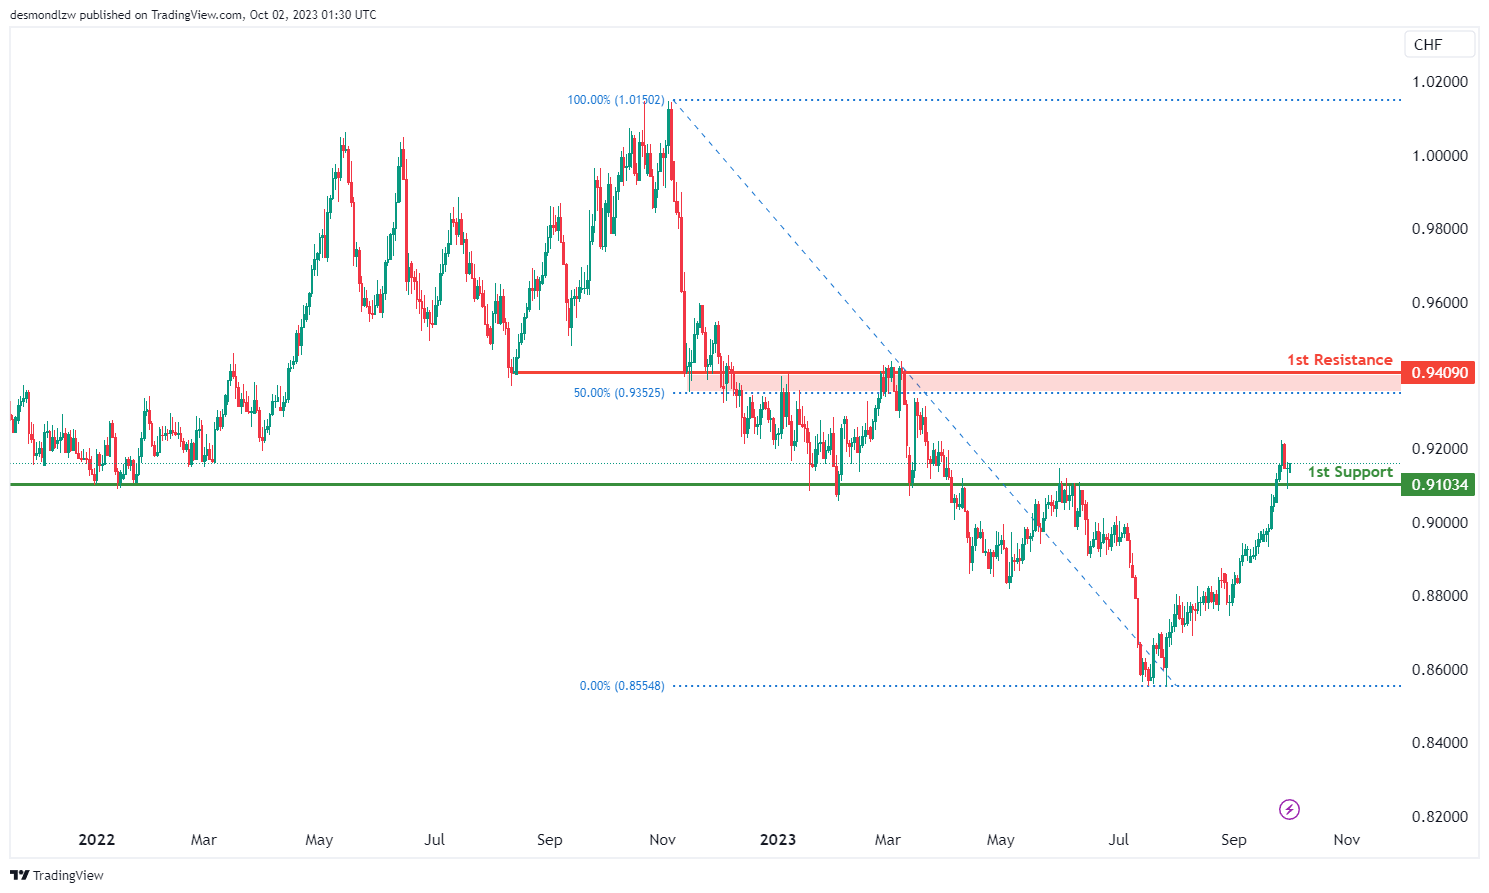
The USD/CHF chart currently exhibits a bullish overall momentum.
In this context, there is a potential scenario where the price might experience a bullish bounce off the 1st support at 0.9103, which is identified as an overlap support.
On the resistance side, the 1st resistance level at 0.9409 is significant, marked as an overlap resistance and aligning with the 50% level.
USD/JPY:
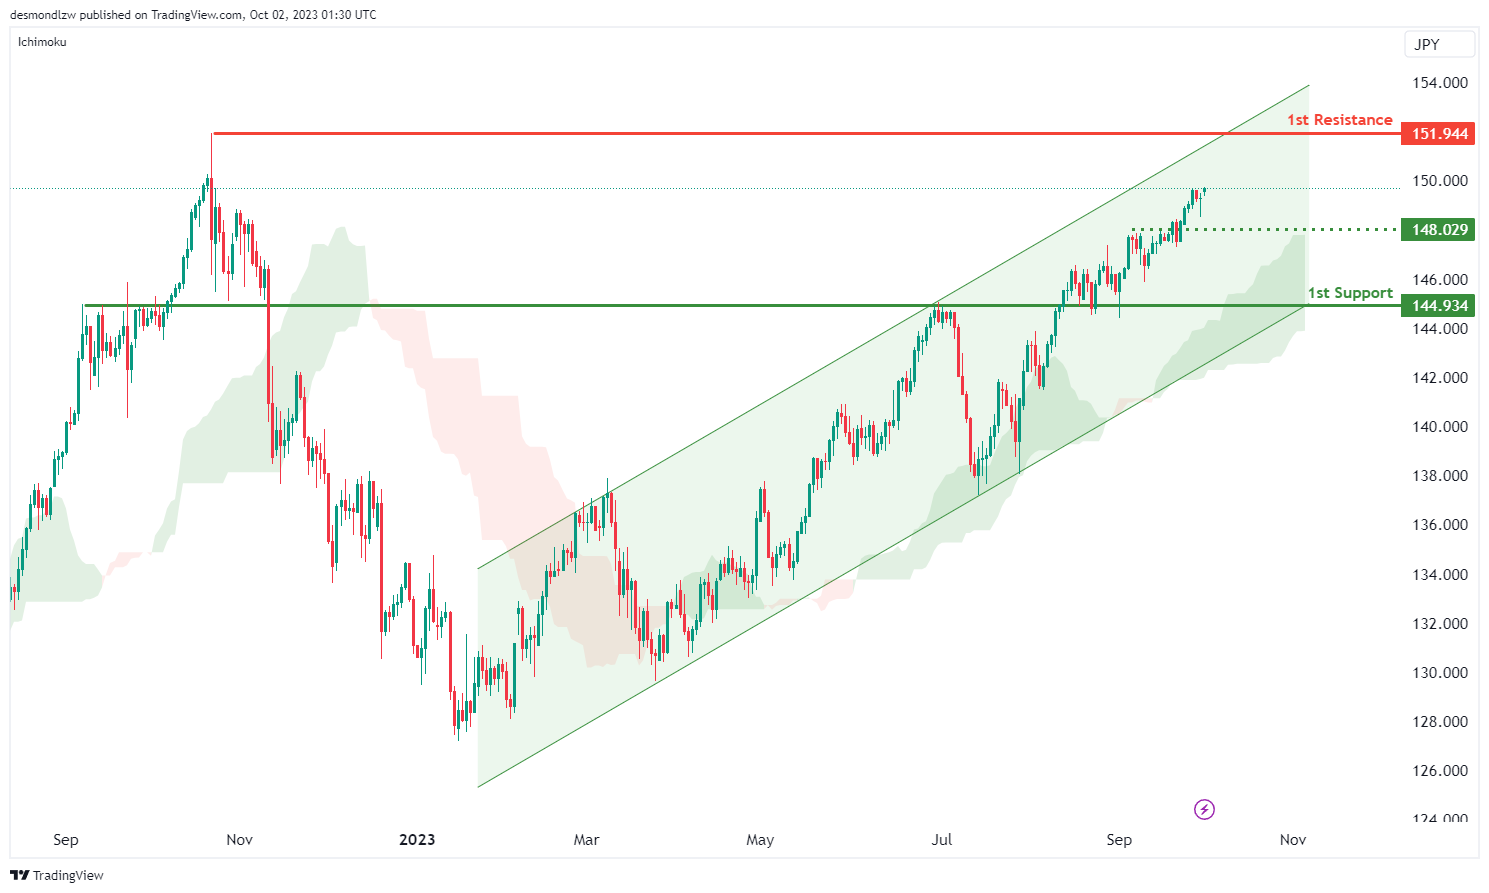
The instrument in question is USD/JPY, and the overall chart momentum currently leans bullish. This bullish sentiment is substantiated by two key factors: the price is positioned above the bullish Ichimoku cloud, and it is also within a bullish ascending channel. These factors suggest that the price might continue its upward trajectory due to its bullish momentum.
In terms of support and resistance levels, the first support is identified at 144.93, characterized as an overlap support. An intermediate support level is situated at 148.02, serving as a pullback support. On the resistance side, the first resistance level is at 151.94, marked as a swing high resistance.
USD/CAD:
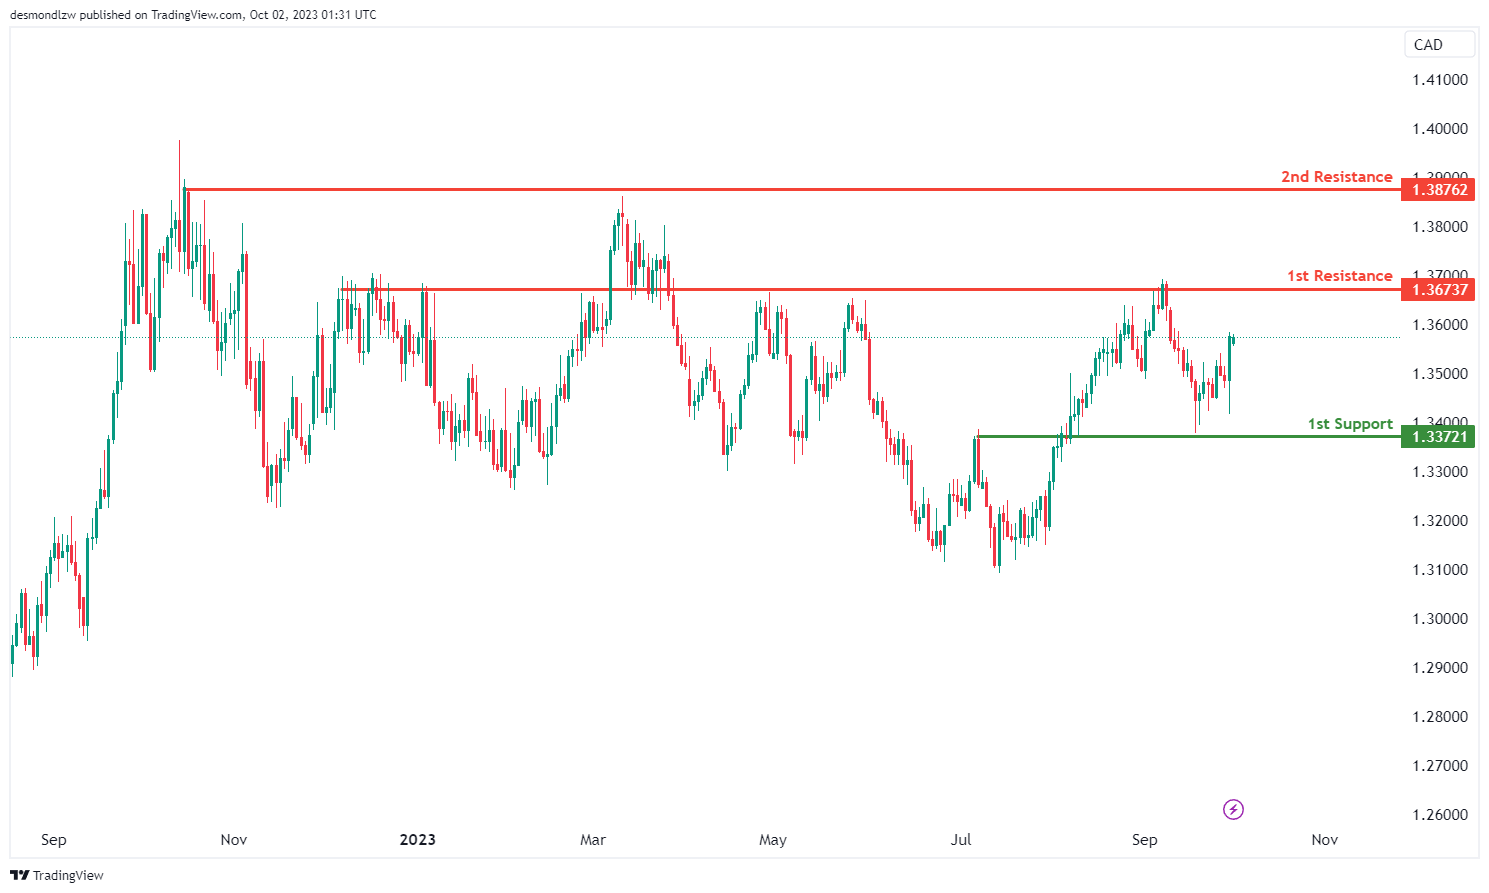
The USD/CAD chart currently exhibits a bullish momentum, indicating a potential bullish continuation towards the 1st resistance level.
On the support side, the 1st support at 1.3372 is identified as an overlap support, which might provide a level of price stability.
Conversely, the 1st resistance at 1.3673 is considered an overlap resistance, while the 2nd resistance at 1.3876 is recognized as a swing high resistance
AUD/USD:
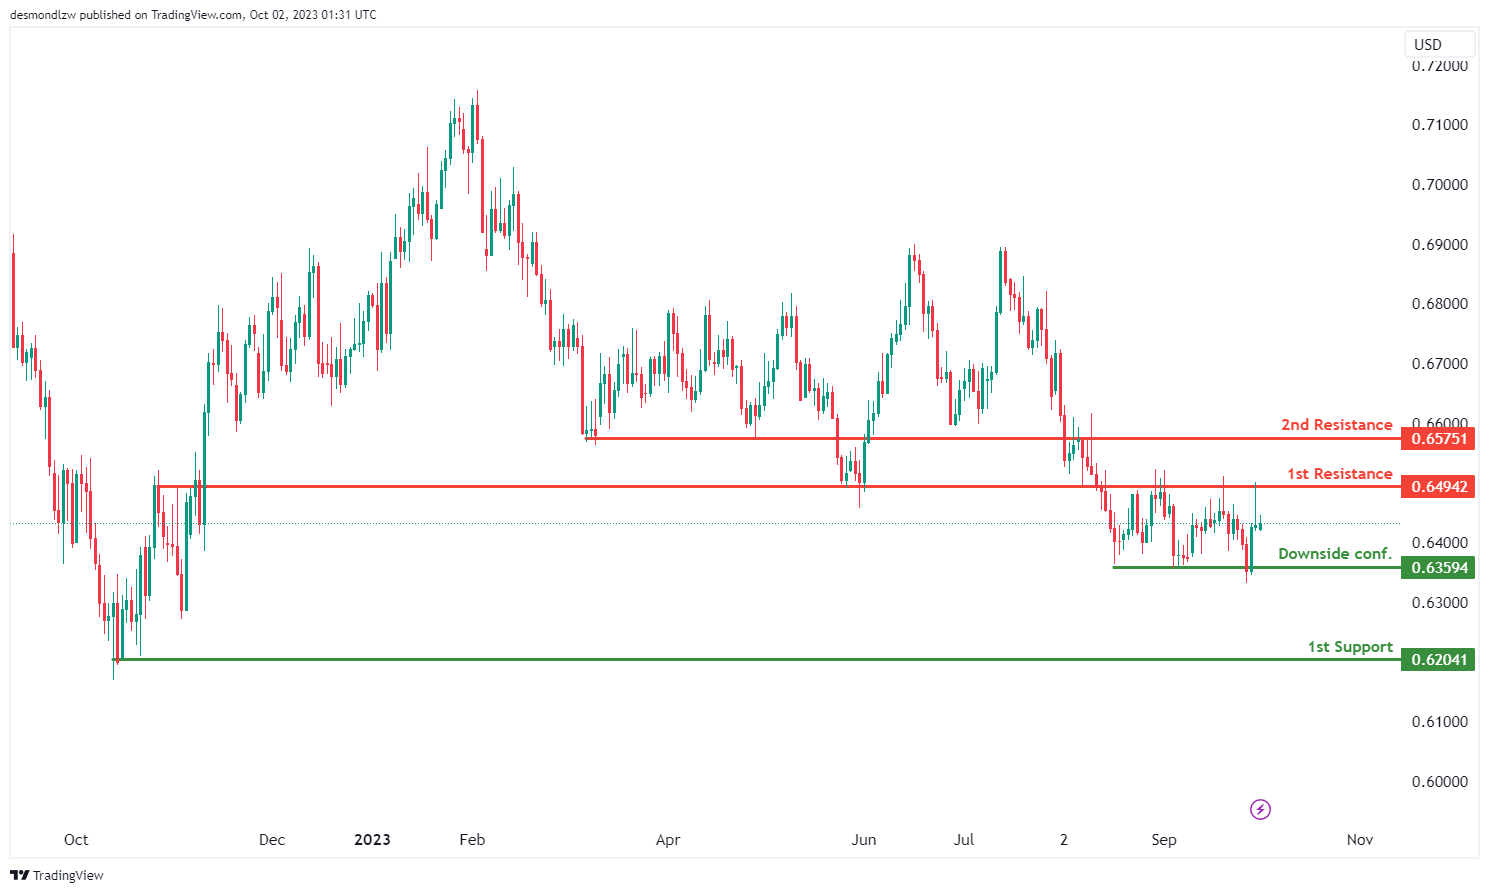
The AUD/USD chart is currently experiencing a neutral momentum, suggesting that price could potentially fluctuate between the 1st support at 0.6204 and the 1st resistance at 0.6494.
Additionally, there is a waiting phase for downside confirmation, with a level at 0.6359 considered as a multi-swing low support, which might provide insights into the future price direction.
On the resistance side, the 1st resistance at 0.6494 is identified as an overlap resistance, and beyond that, the 2nd resistance at 0.6575 also holds significance as an overlap resistance
NZD/USD
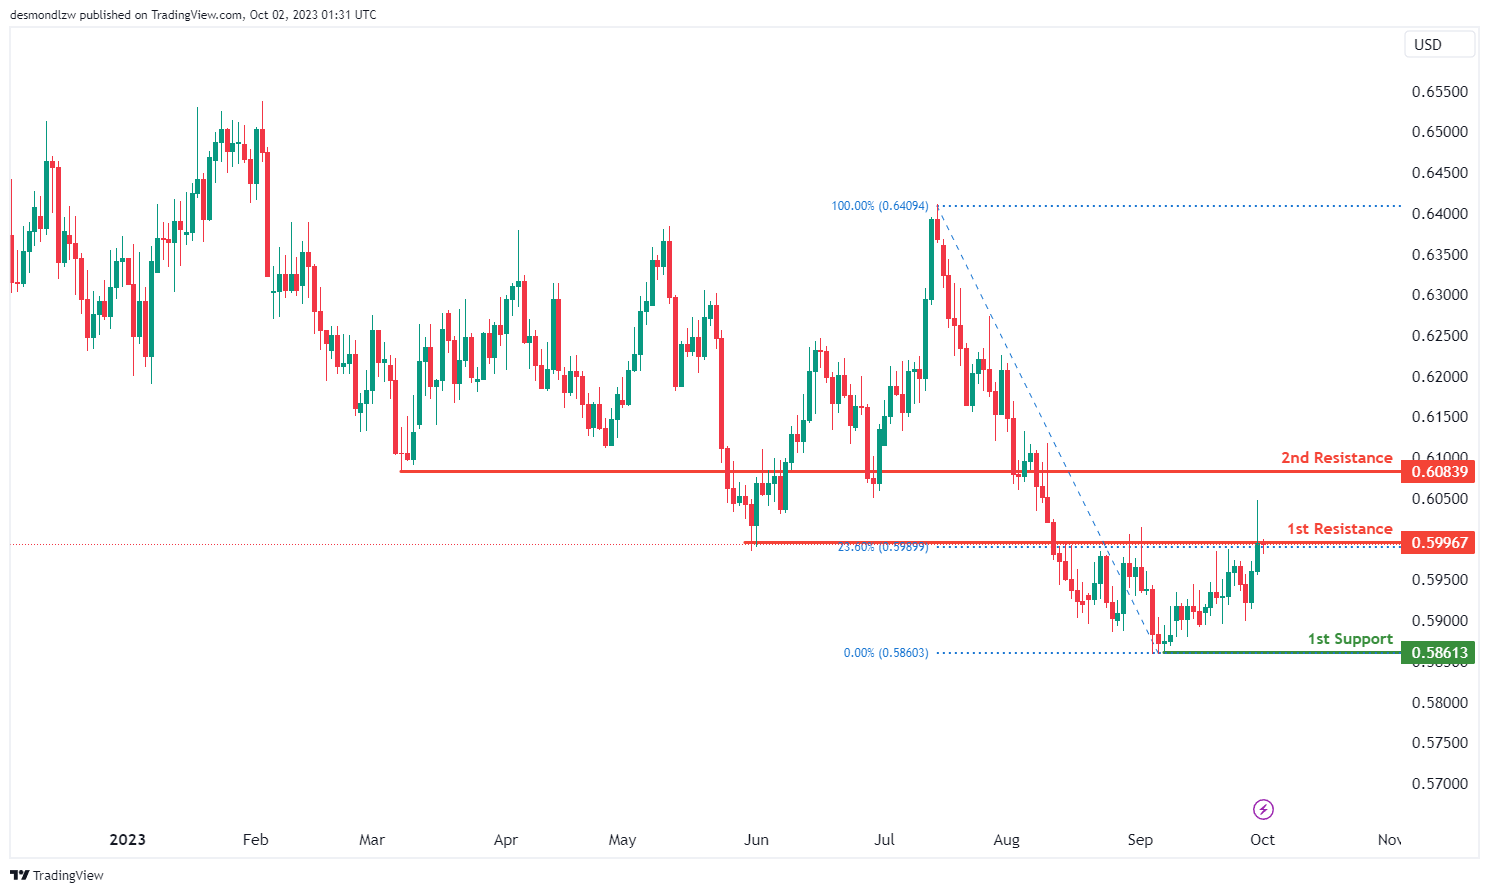
The NZD/USD chart currently indicates bearish momentum, suggesting the possibility of a bearish reaction off the 1st resistance level at 0.5996, followed by a potential drop to the 1st support level at 0.5861. The 1st support level is significant as it is identified as a swing low support.
On the resistance side, the 1st resistance at 0.5996 is notable, characterized as an overlap resistance with the added feature of aligning with the 23.60% Fibonacci Retracement. Additionally, the 2nd resistance at 0.6083 is also identified as an overlap resistance
DJ30:
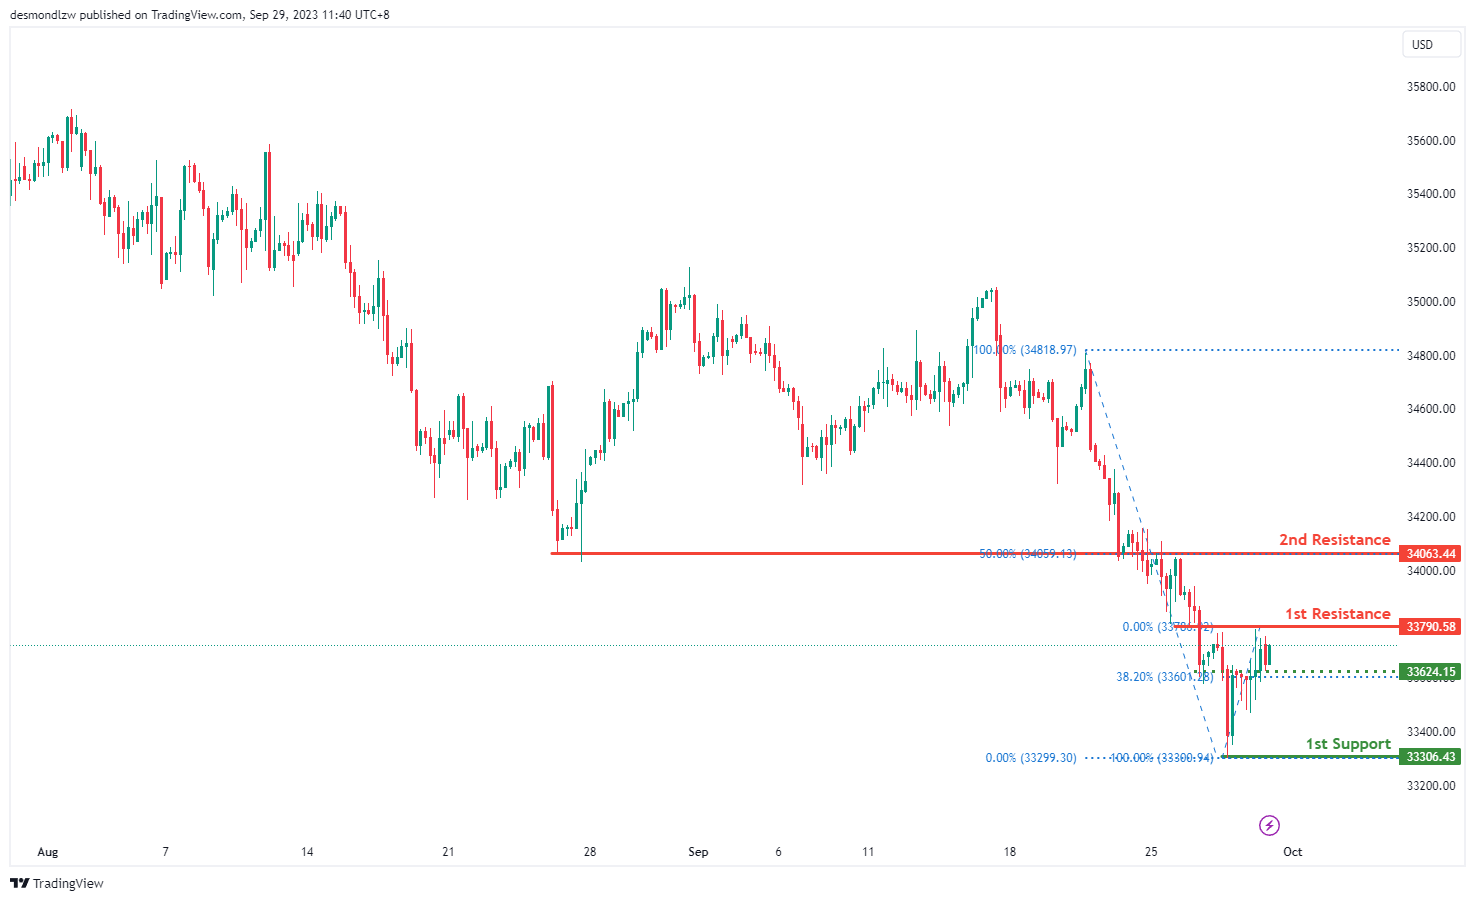
The DJ30 (Dow Jones Industrial Average) chart currently shows a bearish overall momentum, and there is a potential scenario where the price could react bearishly from the 1st resistance and decline towards the 1st support.
The 1st support level at 33,306.43 is considered a significant level because it corresponds to a swing low support. Swing lows represent historical price levels where buying interest has previously emerged, making this level a strong candidate for providing support in a bearish scenario.
There is an intermediate support level at 33,624.15, which is identified as an overlap support. This level coincides with the 38.20% Fibonacci Retracement, adding to its significance. Fibonacci retracement levels are frequently watched by traders for potential reversals or areas of support and resistance.
On the resistance side, the 1st resistance level at 33,790.58 is recognized as an overlap resistance. Overlap resistances often act as barriers to further price increases, as traders may use these levels to take profits or establish short positions.
Above the 1st resistance, the 2nd resistance level at 34,063.44 is noted as an overlap resistance and is also positioned at the 50% Fibonacci Retracement level.
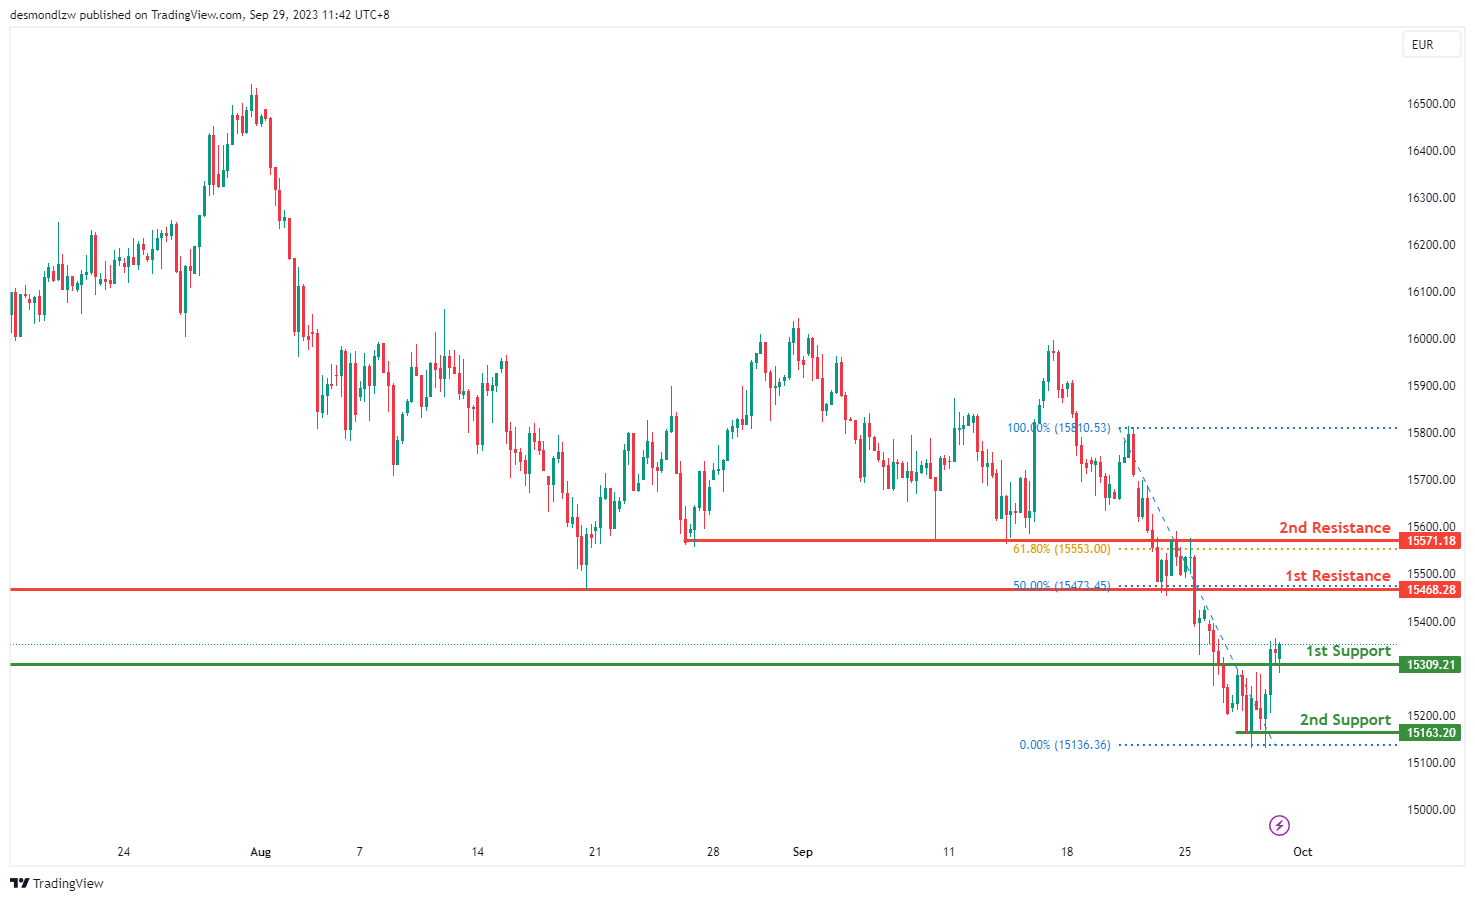
GER30:
The GER30 (Germany 30) chart currently displays a bullish overall momentum, suggesting a positive sentiment in the market. There is a potential scenario in which the price could experience a bullish bounce off the 1st support and subsequently move towards the 1st resistance.
The 1st support level at 15,309.21 is considered a strong support zone as it corresponds to an overlap support. Overlap supports often indicate areas where the price has previously found support and may attract buying interest again.
The 2nd support level at 15,163.20 is another notable support level, identified as a multi-swing low support. This level reinforces the potential for support in the event of a price pullback.
On the resistance side, the 1st resistance level at 15,468.28 is identified as a pullback resistance. This level coincides with the 50% Fibonacci Retracement, a key technical level used by traders to identify potential reversals or areas of resistance.
Above the 1st resistance, the 2nd resistance level at 15,571.18 is marked as an overlap resistance and is also positioned at the 61.80% Fibonacci Retracement.
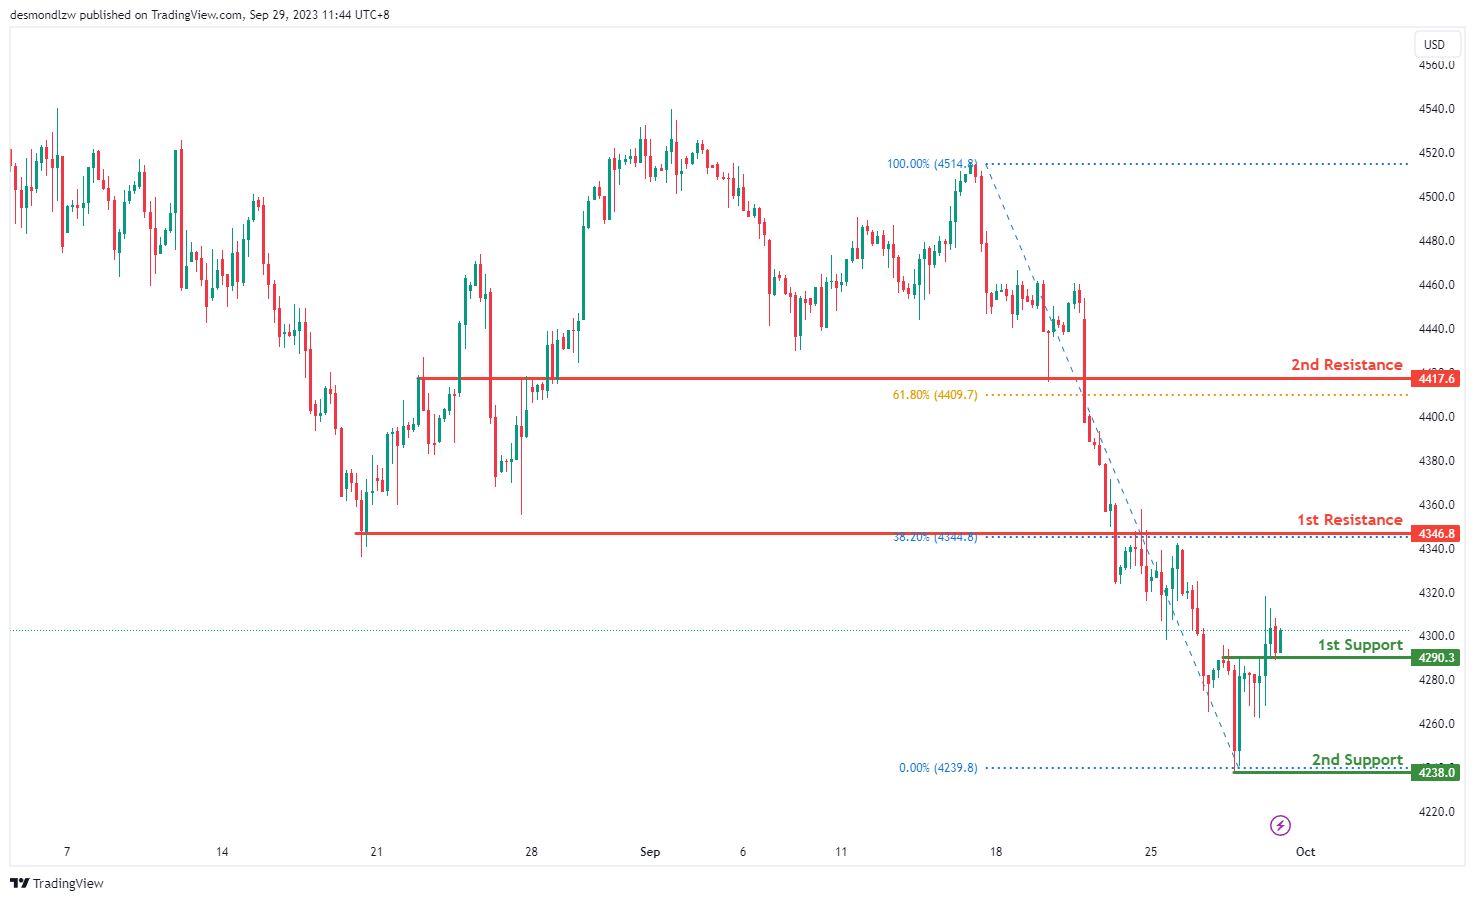
US500
The US500 chart currently exhibits a bullish overall momentum, with several factors contributing to this positive sentiment. Notably, the price has the potential to experience a bullish bounce off its first support level at 4290.3, which is identified as an overlap support. Additionally, the presence of a swing low support at 4238.0 further strengthens the case for a bullish move.
Looking ahead, the chart faces its first resistance at 4346.8, which is characterized by both an overlap resistance and a 38.20% Fibonacci Retracement level. This level represents a significant obstacle that, if overcome, could propel the price higher. Beyond this, there is a second resistance at 4417.6, which serves as a pullback resistance and aligns with a 61.80% Fibonacci Retracement, offering another potential target for bullish movement.
In summary, the US500 chart’s bullish momentum, supported by overlap and swing low supports, suggests the possibility of a bullish bounce at the first support level and a subsequent move towards the first and second resistance levels, which present opportunities for further price appreciation.
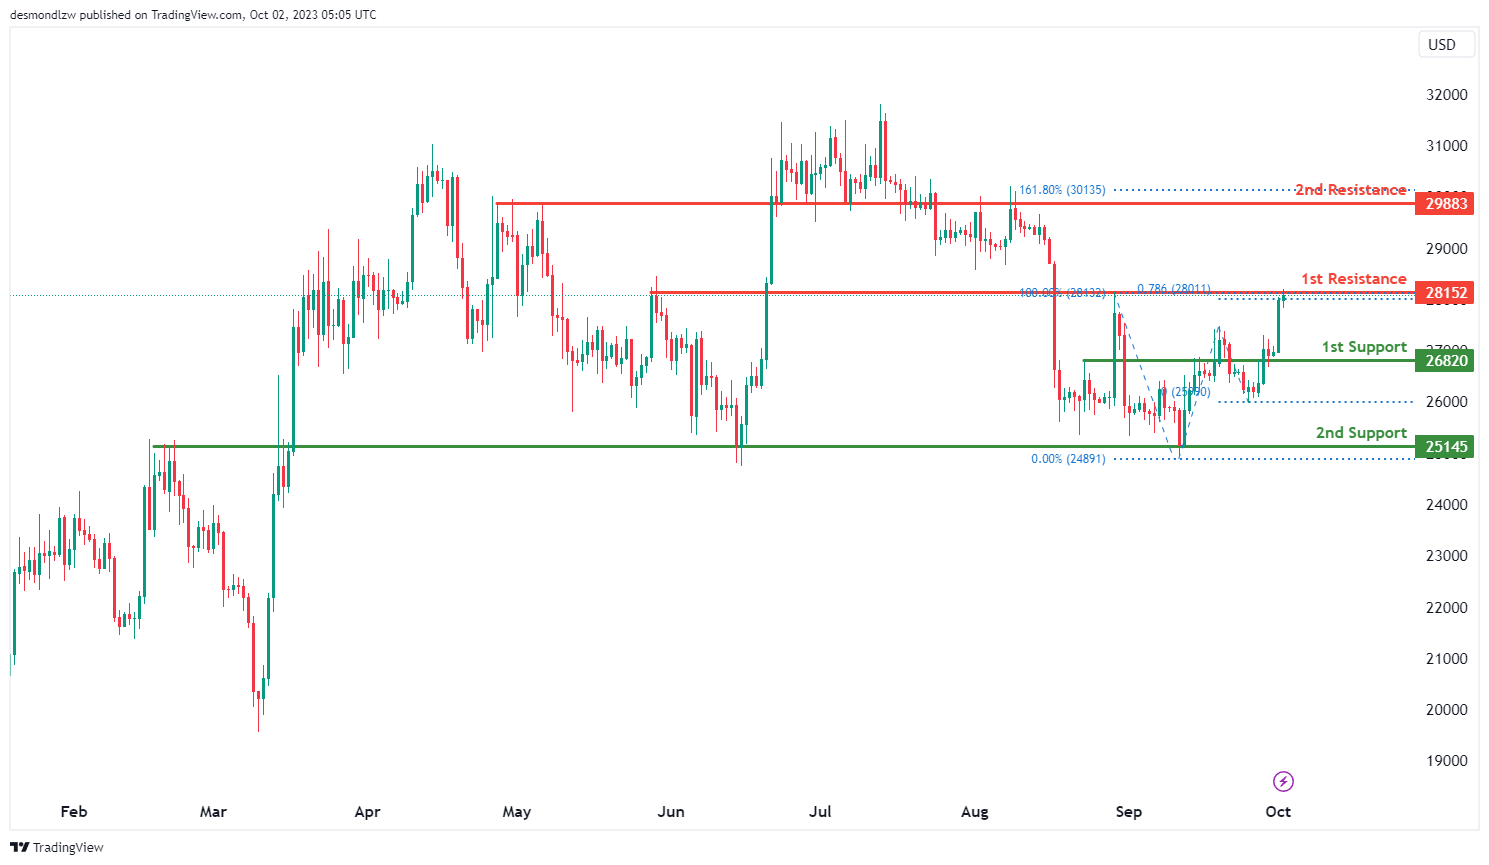
BTC/USD:
The BTC/USD chart is currently characterized by a bearish overall momentum, indicating a prevailing downtrend in the market. Several factors contribute to this bearish sentiment.
Price is anticipated to potentially experience a bearish reaction off the first resistance level at 28,152. This level is considered significant as it represents an overlap resistance, suggesting a historical point where selling pressure may emerge. Additionally, the presence of the 78.60% Fibonacci Projection adds further confluence to the resistance, making it a critical level to watch for potential reversals or bearish movements.
In contrast, the chart has two support levels that could potentially come into play. The first support at 26,820 is identified as a pullback support, signifying a level where buyers might step in or where price retracements could find support. Further strengthening the support is the second support at 25,145, which is characterized as an overlap support. This level has historical significance and could act as a substantial foundation for potential price rebounds.
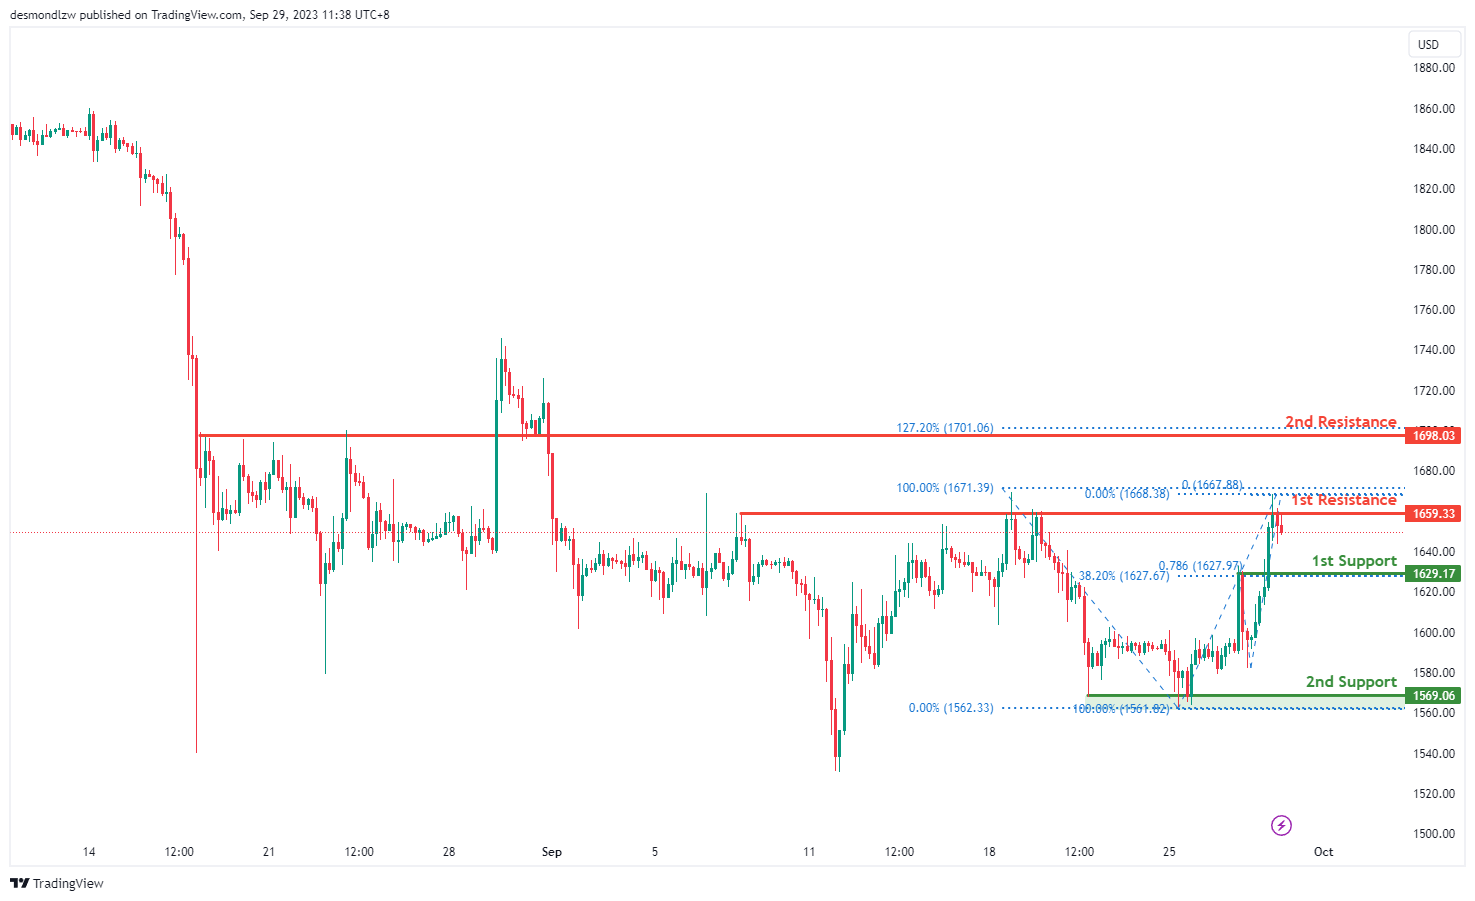
ETH/USD:
The ETH/USD chart currently exhibits a bullish overall momentum, but there is a potential short-term bearish scenario to consider, followed by a subsequent bullish move.
The 1st support level at 1,629.17 is identified as a pullback support. This level holds significance as it aligns with the 38.20% Fibonacci Retracement and the 78.60% Fibonacci Retracement, indicating a strong Fibonacci confluence. Traders often look at such confluence areas as potential reversal zones where buying interest may surge, leading to a bounce in prices.
The 2nd support level at 1,532.48 corresponds to a swing low support. Swing lows are historical price levels where buying interest has emerged, making this level a strong candidate for providing support in a bearish scenario.
In the short term, the price could potentially drop further to test the 1st support level. This move may be driven by profit-taking or short-term bearish sentiment.
However, the chart’s overall bullish momentum suggests that after reaching the 1st support, there is a possibility of a bounce. Traders may see this as an opportunity to enter bullish positions.
On the resistance side, the 1st resistance level at 1,659.33 is identified as a multi-swing high resistance. This level could potentially act as a barrier to further price advancement, as traders who missed earlier opportunities to sell may enter the market at this point.
Above that, the 2nd resistance level at 1,698.03 is noted as a pullback resistance. This level presents an additional hurdle for bullish price movements.
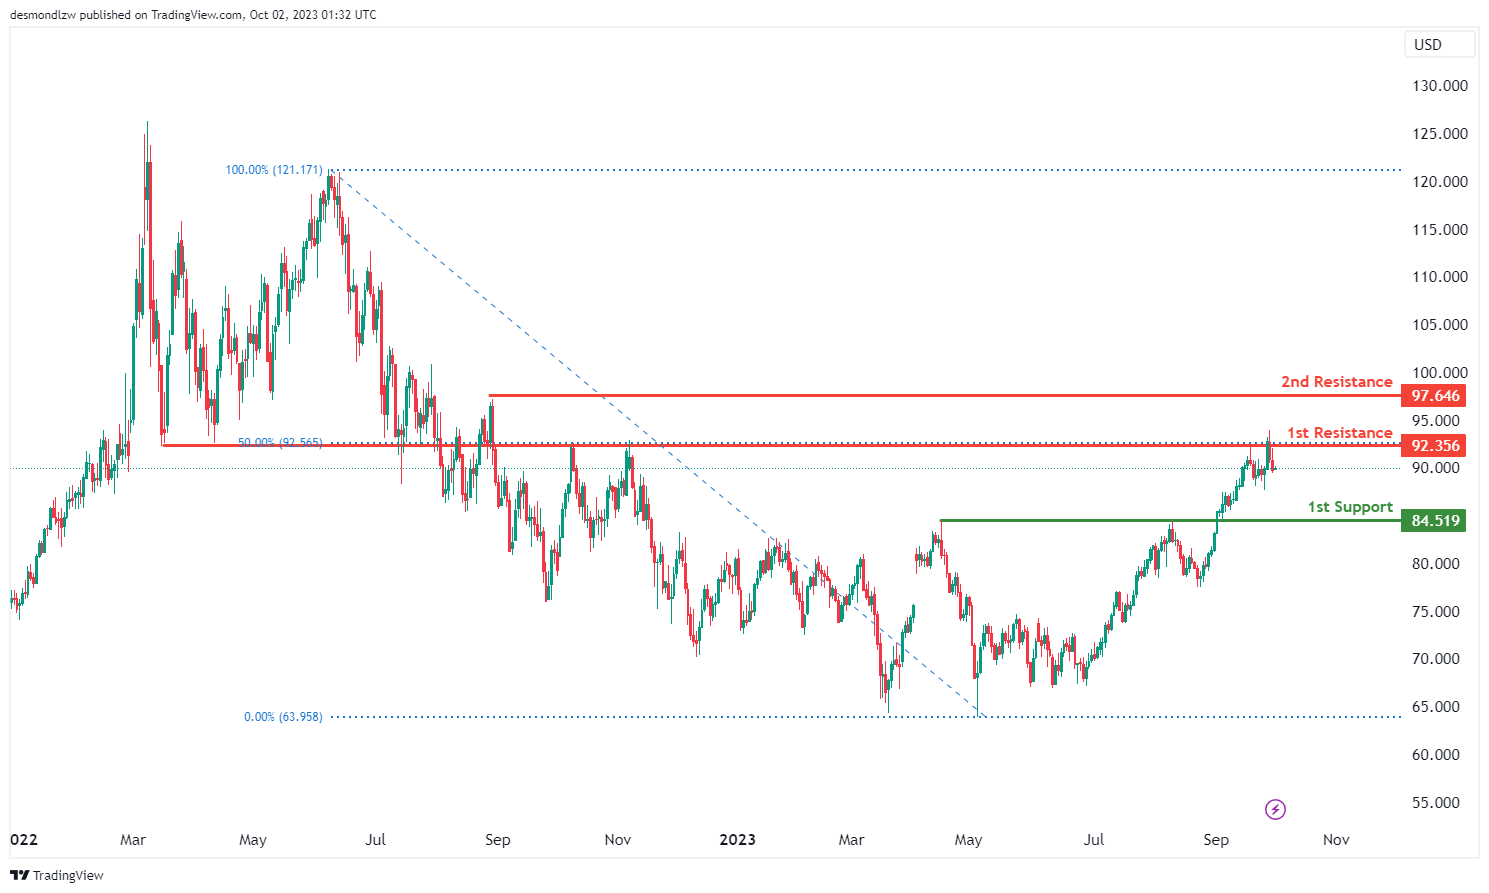
WTI/USD:
The WTI chart currently exhibits a bearish overall momentum, indicating the possibility of a bearish continuation towards the 1st support level at 84.51. This support level is significant as it is identified as an overlap support.
On the resistance side, the 1st resistance at 92.35 is noteworthy and characterized as an overlap resistance with the additional feature of aligning with the 50% Fibonacci Retracement. Beyond this, the 2nd resistance at 97.64 serves as a swing high resistance
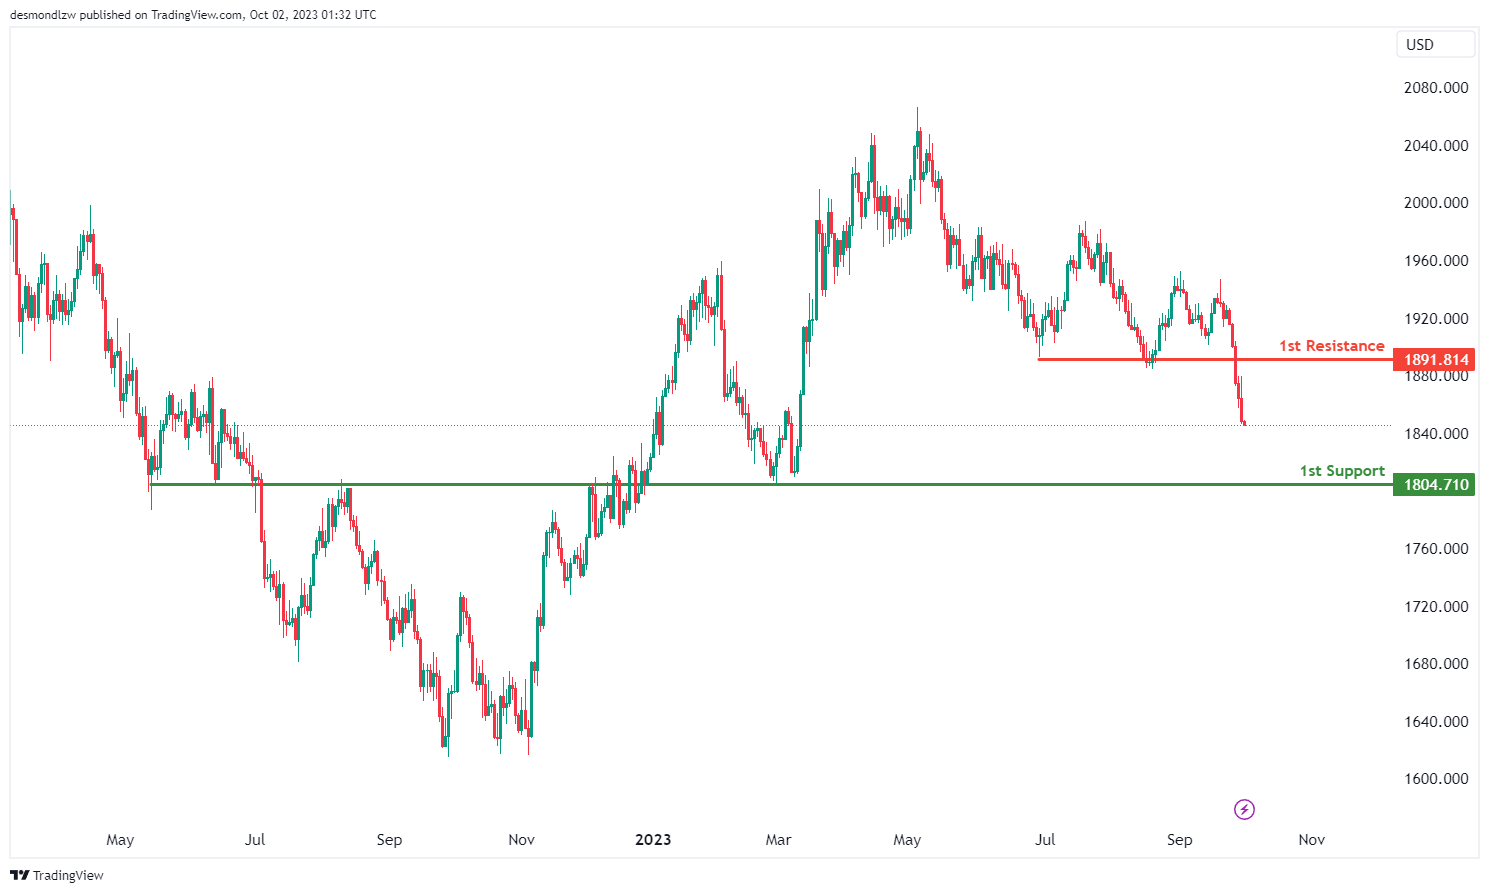
XAU/USD (GOLD):
The XAU/USD chart presently reflects a bearish overall momentum, suggesting a potential bearish continuation towards the 1st support level at 1804.71. This level is considered significant as it’s identified as an overlap support.
On the resistance side, the 1st resistance at 1891.81 is noteworthy, characterized as a pullback resistance. This resistance level may pose a barrier to further price increases.


