
DXY:
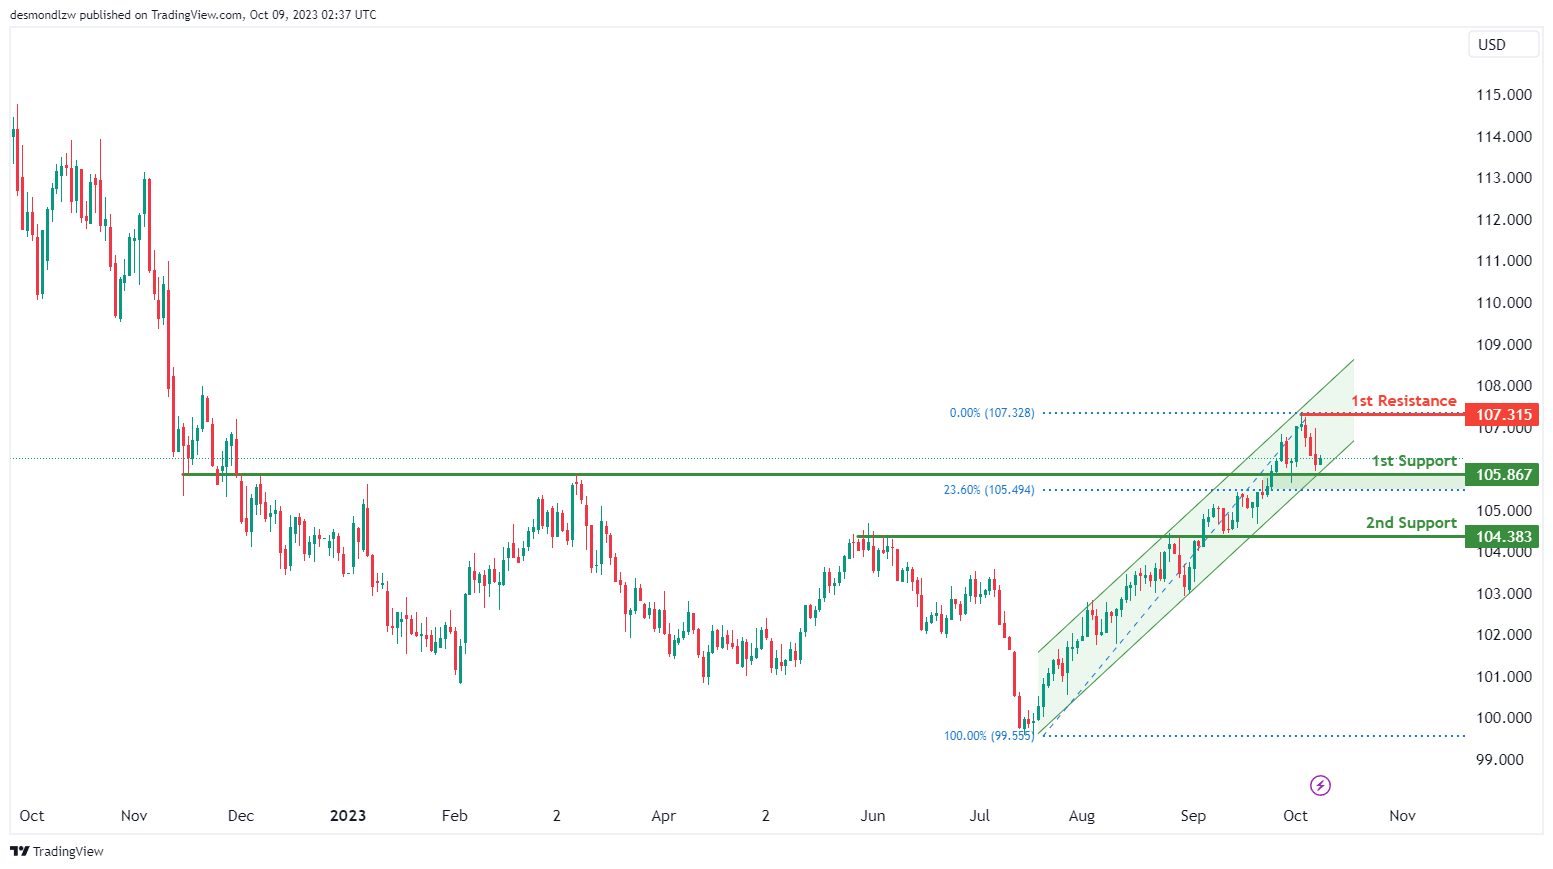
The DXY (US Dollar Index) chart currently maintains an overall bullish momentum with a potential for price to bounce off the 1st support level and the lower channel line of the bullish ascending channel to make a bullish continuation towards the 1st resistance level.
The 1st resistance level at 107.13 is identified as a multi-swing high resistance, indicating its potential role as a barrier to upward movements.
To the downside, the 1st support level at 105.87 is identified as an overlap support that aligns with the 23.60% Fibonacci retracement level. Additionally, the 2nd support level at 104.38 is also noted as an overlap support, further reinforcing its significance as a potential area where price could find support.
EUR/USD:
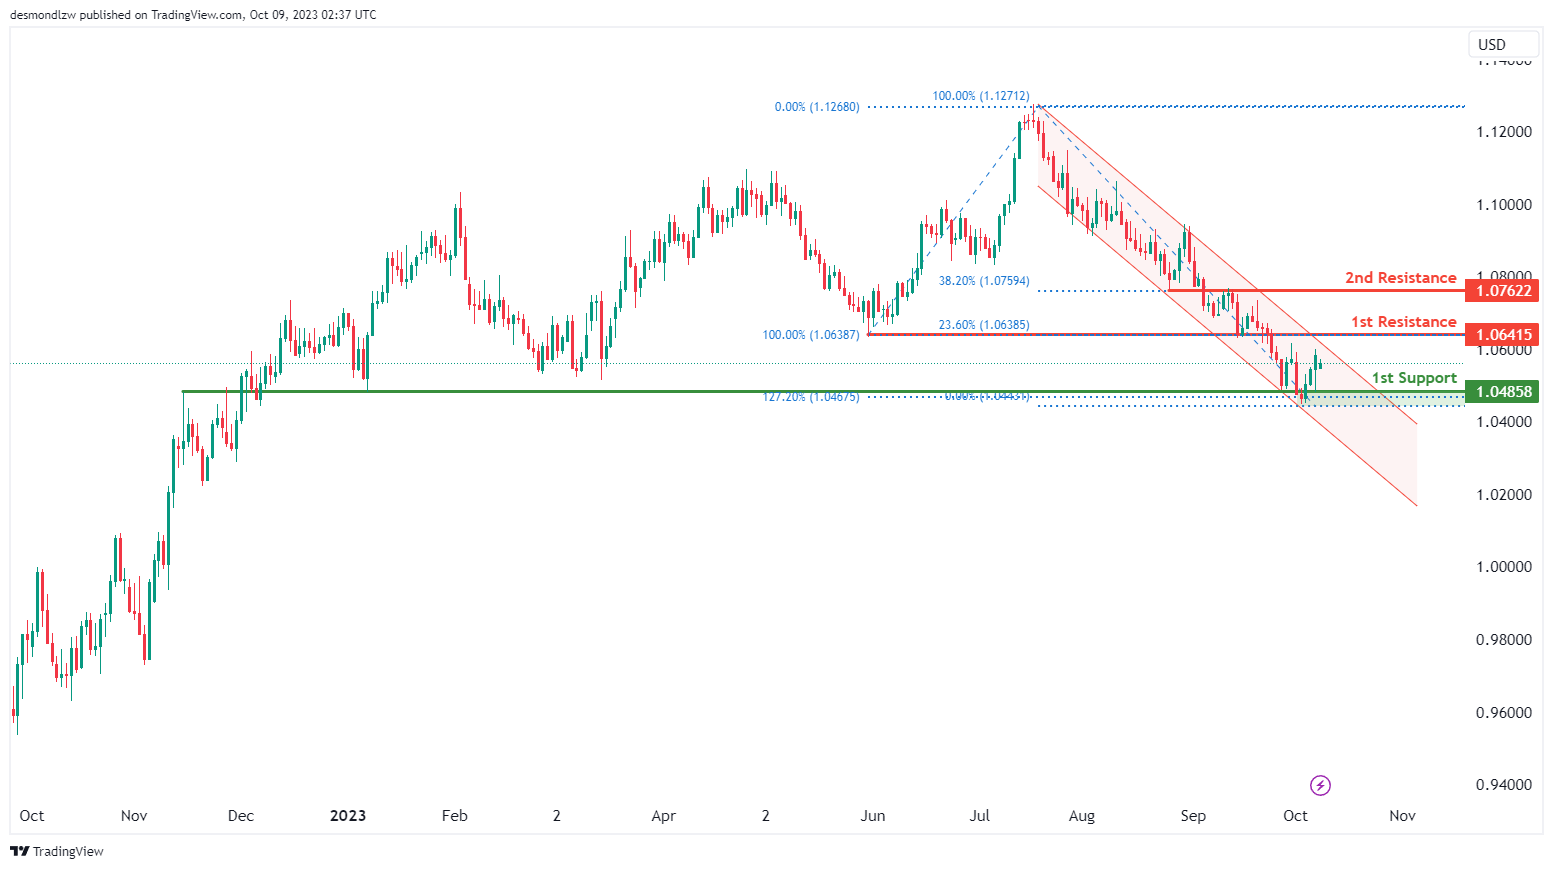
The EUR/USD chart currently maintains an overall bearish momentum with a potential for price to make a bearish continuation towards the 1st support level.
The 1st support level at 1.0486 is identified as an overlap support that aligns with the 127.20% Fibonacci extension level, making it an important level for potential price support.
To the upside, the 1st resistance level at 1.0642 is identified as a pullback resistance that aligns with the 23.60% Fibonacci retracement level. Additionally, the 2nd resistance level at 1.0762 is noted as an overlap resistance that aligns with the 38.20% Fibonacci retracement level, suggesting it may act as a barrier to upward movements.
EUR/JPY:
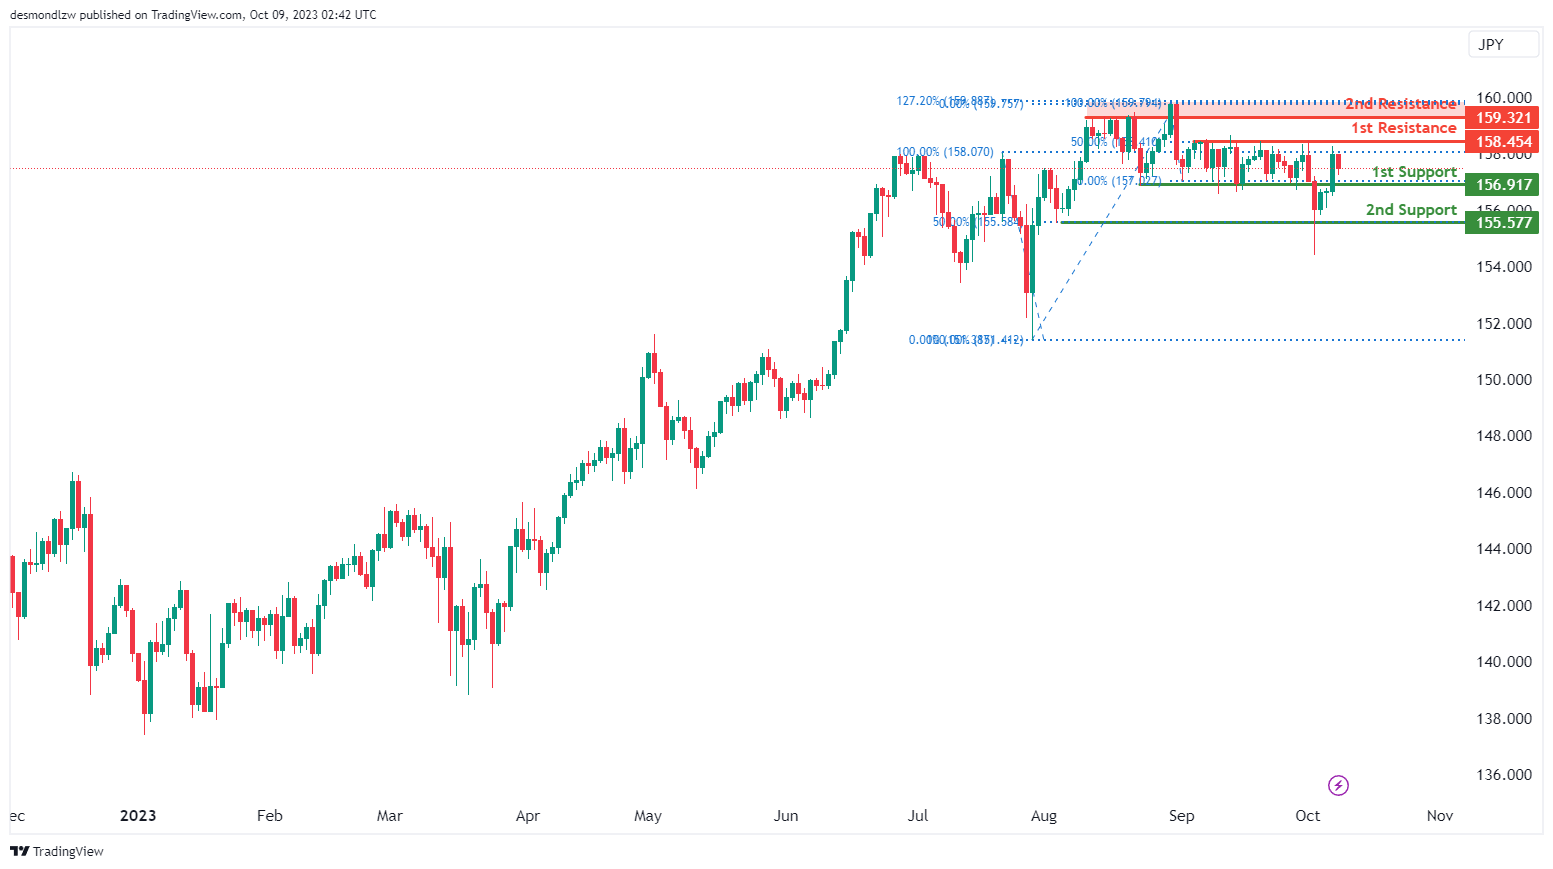
The EUR/JPY chart currently exhibits a neutral momentum, suggesting the potential scenario for price to fluctuate between the 1st resistance level and the 1st support level.
The 1st support level at 156.92 is identified as a pullback support. Additionally, the 2nd support level at 155.58 is also noted as a pullback support that aligns with the 50.00% Fibonacci retracement level, further reinforcing its importance as a potential level for price rebounds.
To the upside, the 1st resistance level at 158.45 is identified as a pullback resistance that aligns with the 50.00% Fibonacci retracement level. Beyond this, the 2nd resistance level at 159.32 is noted as a pullback resistance that aligns close to the 127.20% Fibonacci extension level, adding to its significance as a potential area where selling pressure may emerge.
EUR/GBP:
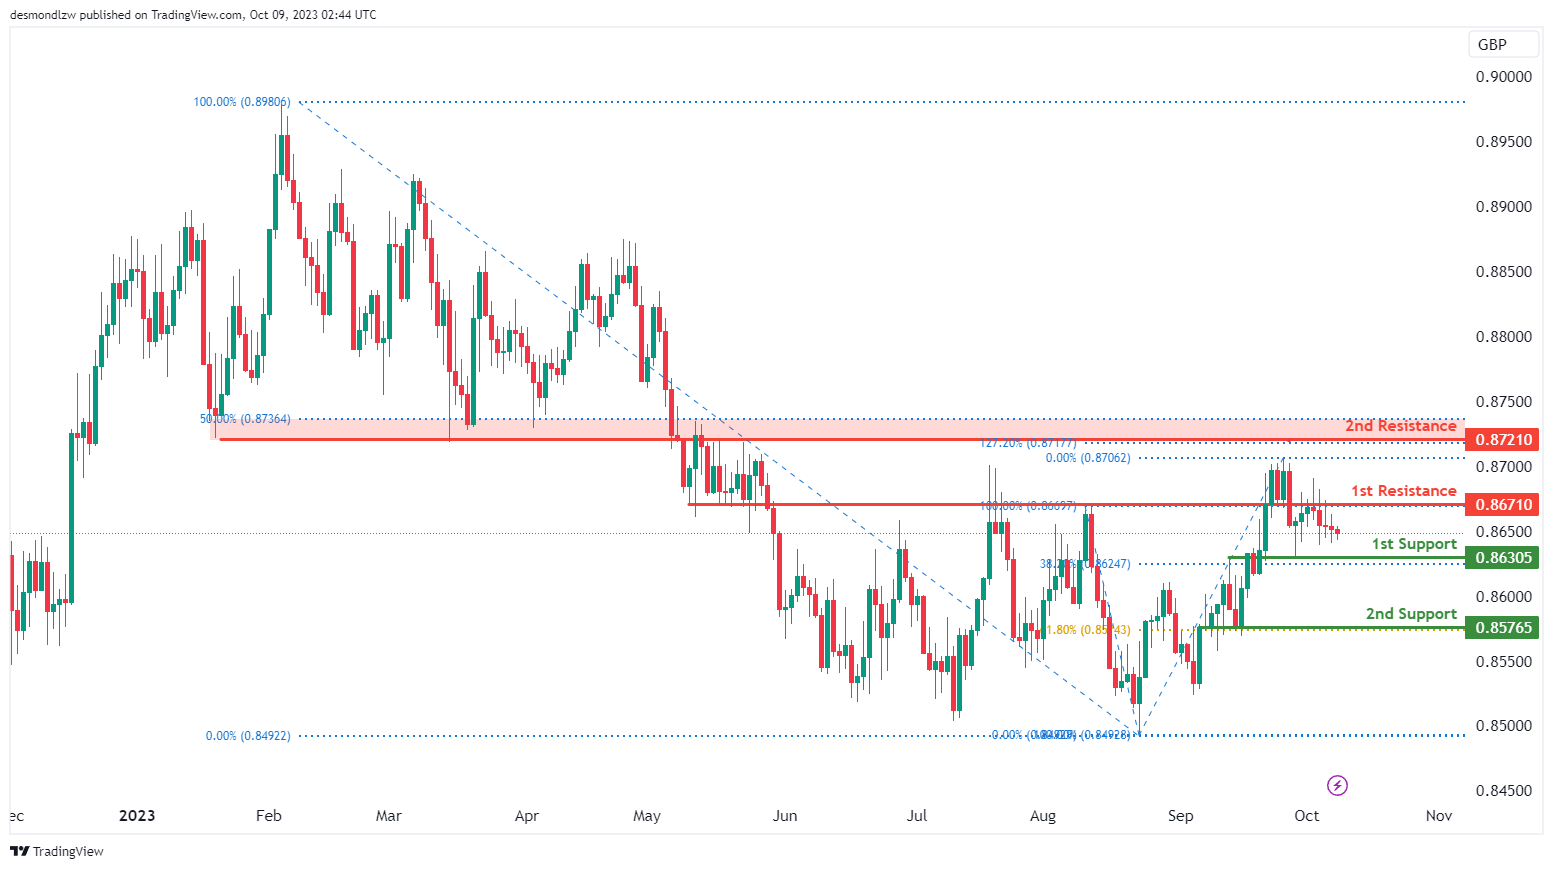
The EUR/GBP chart currently displays a neutral momentum, suggesting the potential scenario for price to fluctuate between the 1st resistance level and the 1st support level.
The 1st support level at 0.8631 is identified as an overlap support that aligns with the 38.20% Fibonacci retracement level. Additionally, the 2nd support level at 0.8577 is noted as a pullback support that aligns with the 61.80% Fibonacci retracement level.
To the upside, the 1st resistance level at 0.8671 is identified as an overlap resistance. Beyond this, the 2nd resistance level at 0.8721 is also noted as an overlap resistance that aligns with the 127.20% Fibonacci extension level, suggesting it may act as a barrier to upward movements.
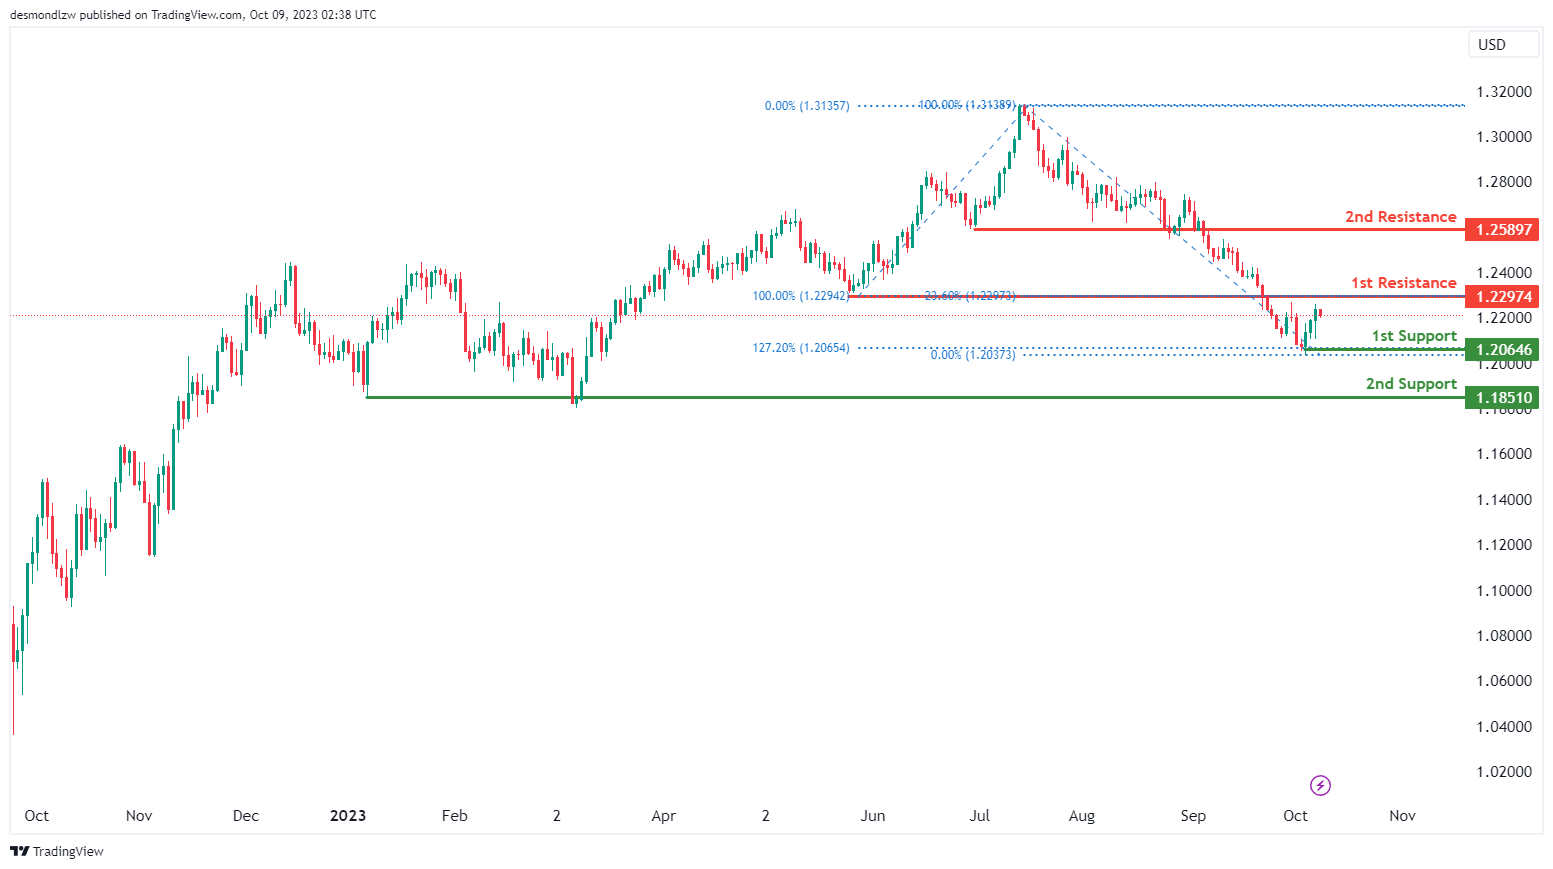
GBP/USD:
The GBP/USD chart currently exhibits an overall bearish momentum with a potential for price to make a bearish continuation towards the 1st support level.
The 1st support level at 1.2065 is identified as a swing-low support that aligns with the 127.20% Fibonacci extension level. Additionally, the 2nd support level at 1.1851 is noted as a pullback support, further reinforcing its significance as a potential area where price could find support.
To the upside, the 1st resistance level at 1.2297 is identified as a pullback resistance that aligns with the 23.60% Fibonacci retracement level. Beyond this, the 2nd resistance level at 1.2589 is also noted as a pullback resistance, suggesting it may act as a barrier to upward movements.
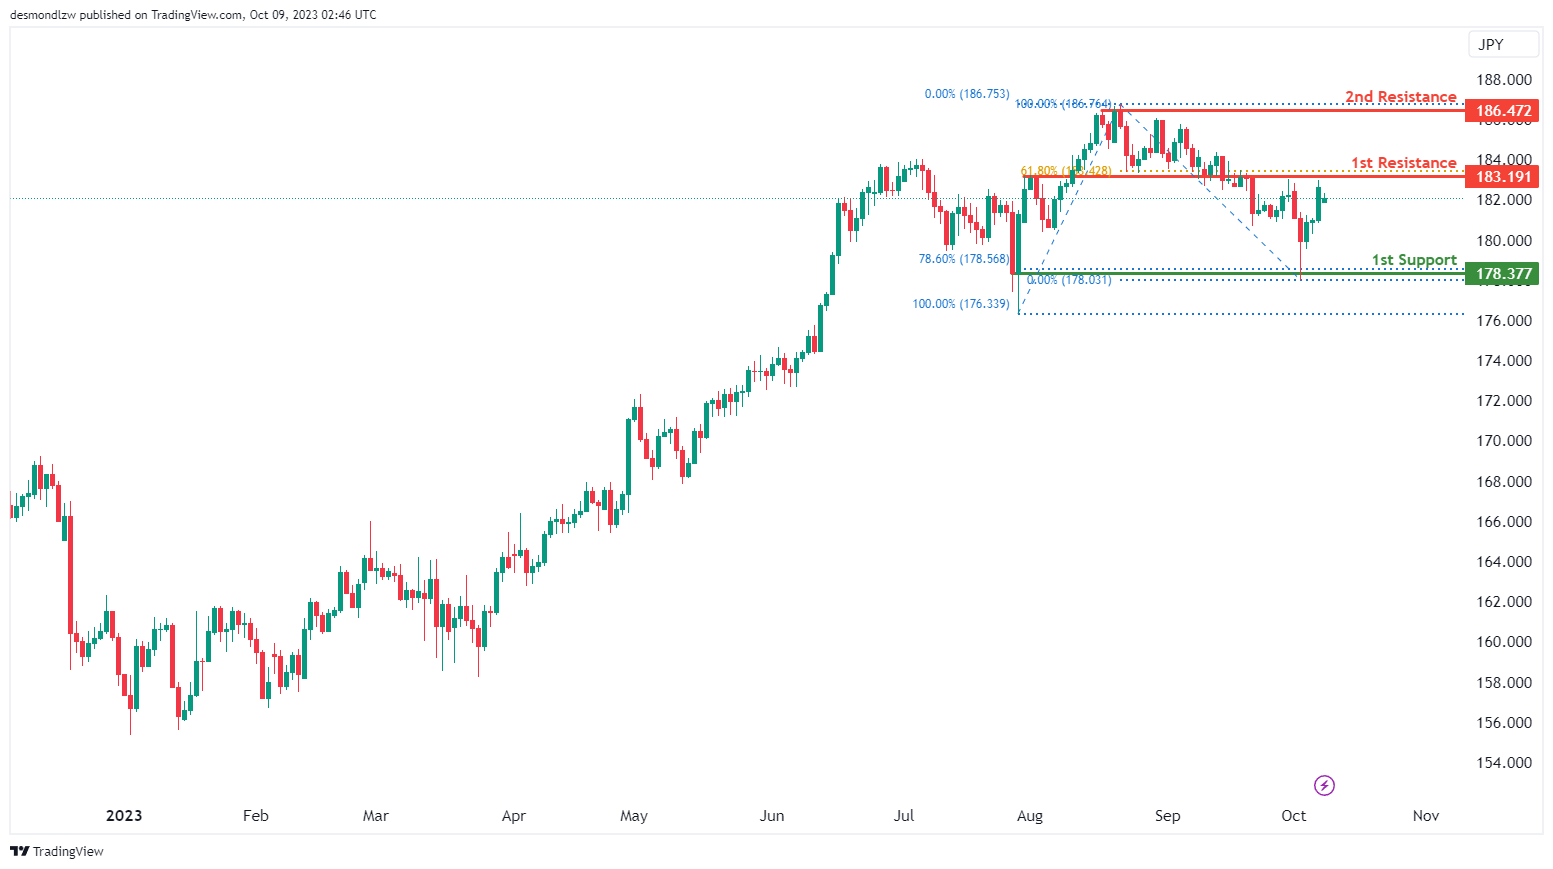
GBP/JPY:
The GBP/JPY chart currently exhibits a bearish overall momentum, suggesting the potential scenario of a bearish reaction off the 1st resistance level with a subsequent drop towards the 1st support.
The 1st support level at 178.38 is identified as a pullback support that aligns with the 78.60% Fibonacci retracement level.
To the upside, the 1st resistance level at 183.19 is identified as an overlap resistance that aligns with the 61.80% Fibonacci retracement level. Beyond this, the 2nd resistance level at 186.47 is noted as a pullback resistance, indicating a potential area where price might encounter selling pressure.
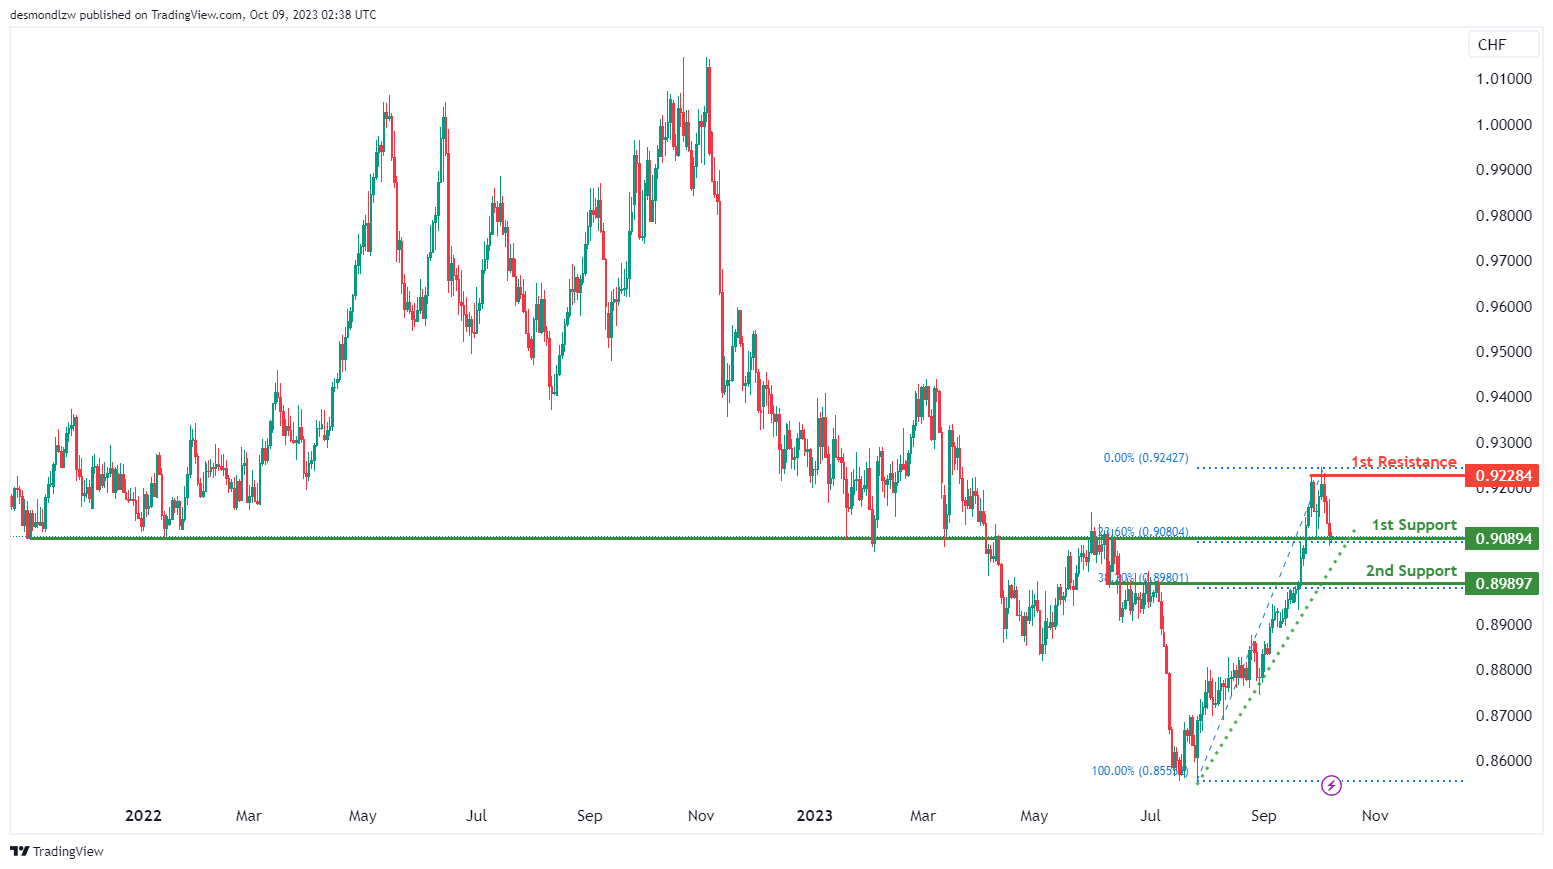
USD/CHF:
The USD/CHF chart currently maintains an overall bullish momentum with a potential for price to bounce off the 1st support level to make a bullish continuation towards the 1st resistance level.
The 1st resistance level at 0.9228 is identified as a multi-swing-high resistance, acting as a potential barrier to further price increases.
The 1st support level at 0.9089 is identified as an overlap support that aligns with the 23.60% Fibonacci retracement level. Additionally, the 2nd support level at 0.8989 is also noted as an overlap support that aligns with the 38.20% Fibonacci retracement level, further reinforcing its significance as an area where the price may find support.
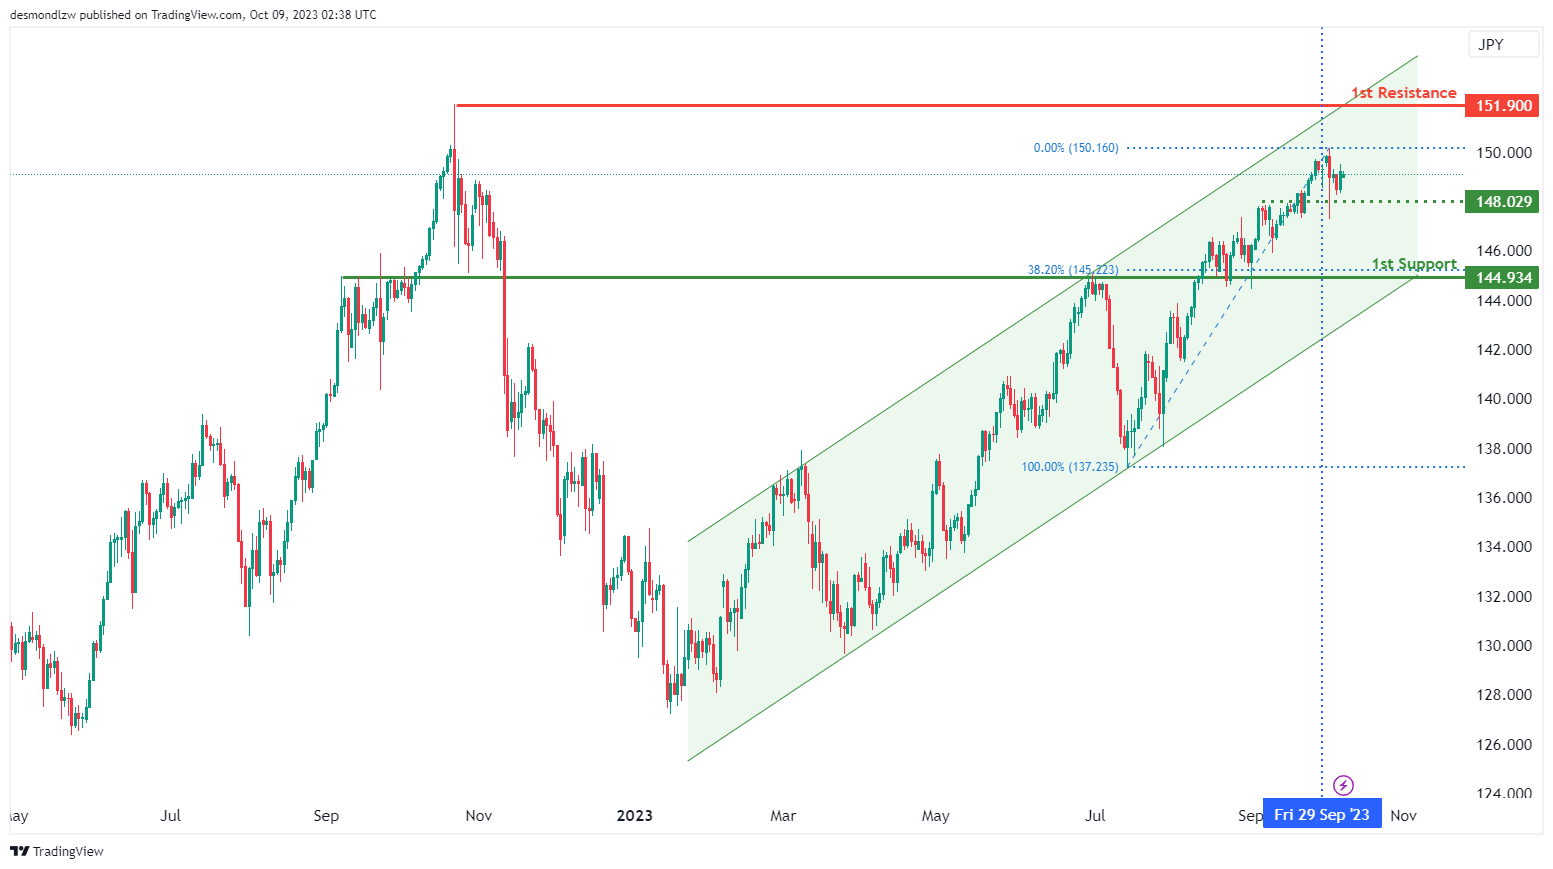
USD/JPY:
The USD/JPY chart currently exhibits an overall bullish momentum with a potential for price to make a bullish continuation towards the 1st resistance level.
The 1st resistance level at 151.90 is identified as a swing-high resistance, acting as a potential barrier to further price increases.
To the downside, the intermediate support level at 148.03 is identified as an overlap support while the 1st support level at 144.93 is also noted as an overlap support that aligns with the 38.20% Fibonacci retracement level, further reinforcing its significance as an area where the price may find support.
USD/CAD:
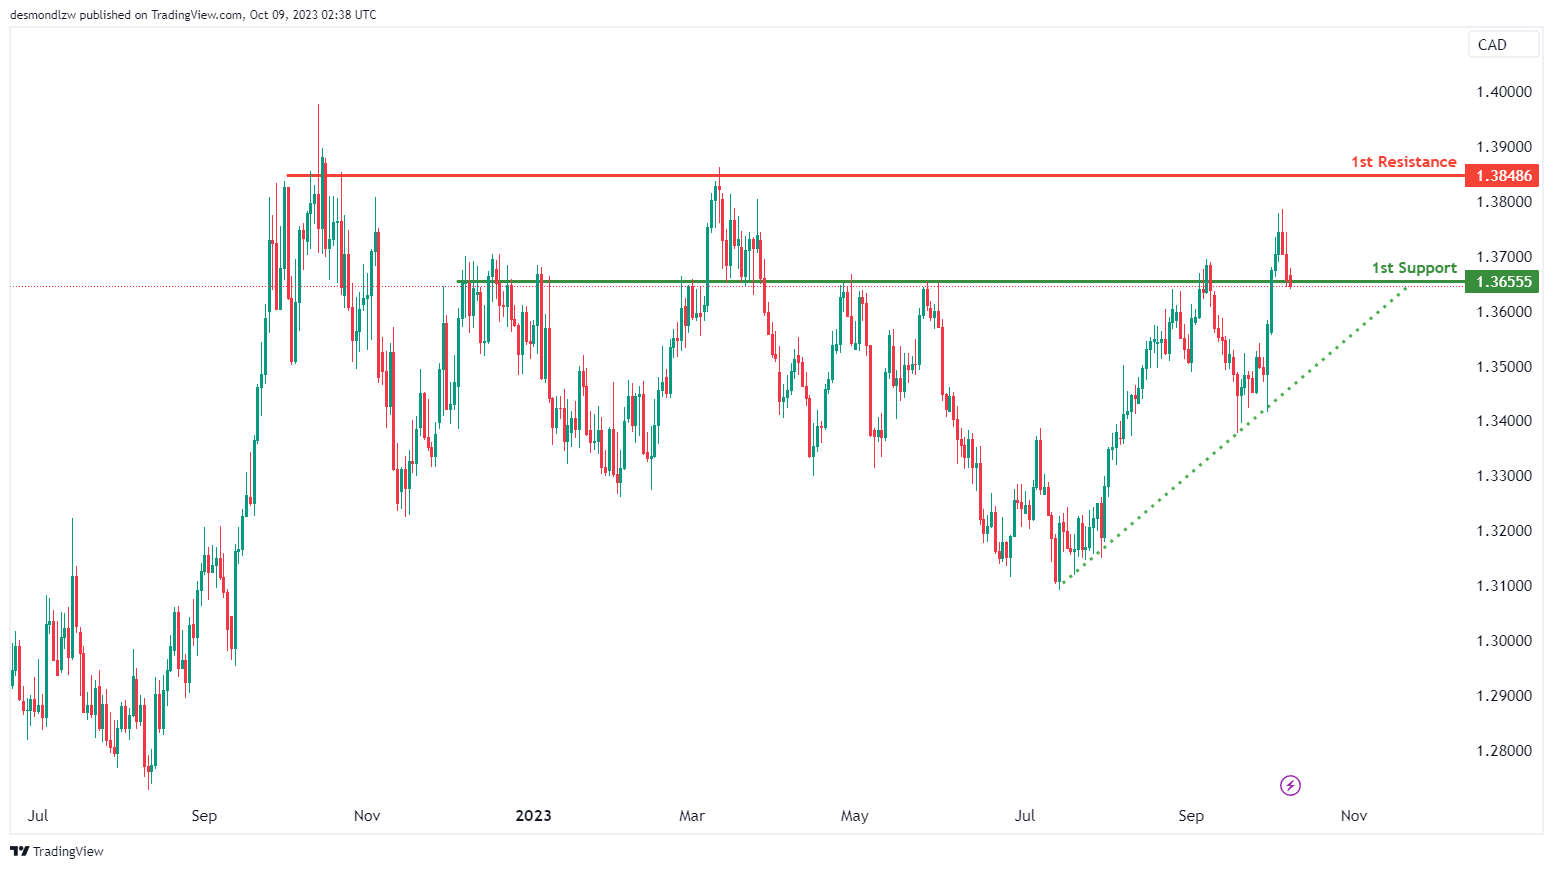
The USD/CAD chart is currently showing an overall bearish momentum suggesting the possibility of a bearish continuation towards the 1st support level.
The 1st support level at 1.3656 is identified as an overlap support. Should price break below the 1st support, it could potentially trigger a move towards the ascending trendline.
To the upside, the 1st resistance level at 1.3849 is identified as a pullback resistance, further emphasizing its significance as a barrier for future price increases.
AUD/USD:
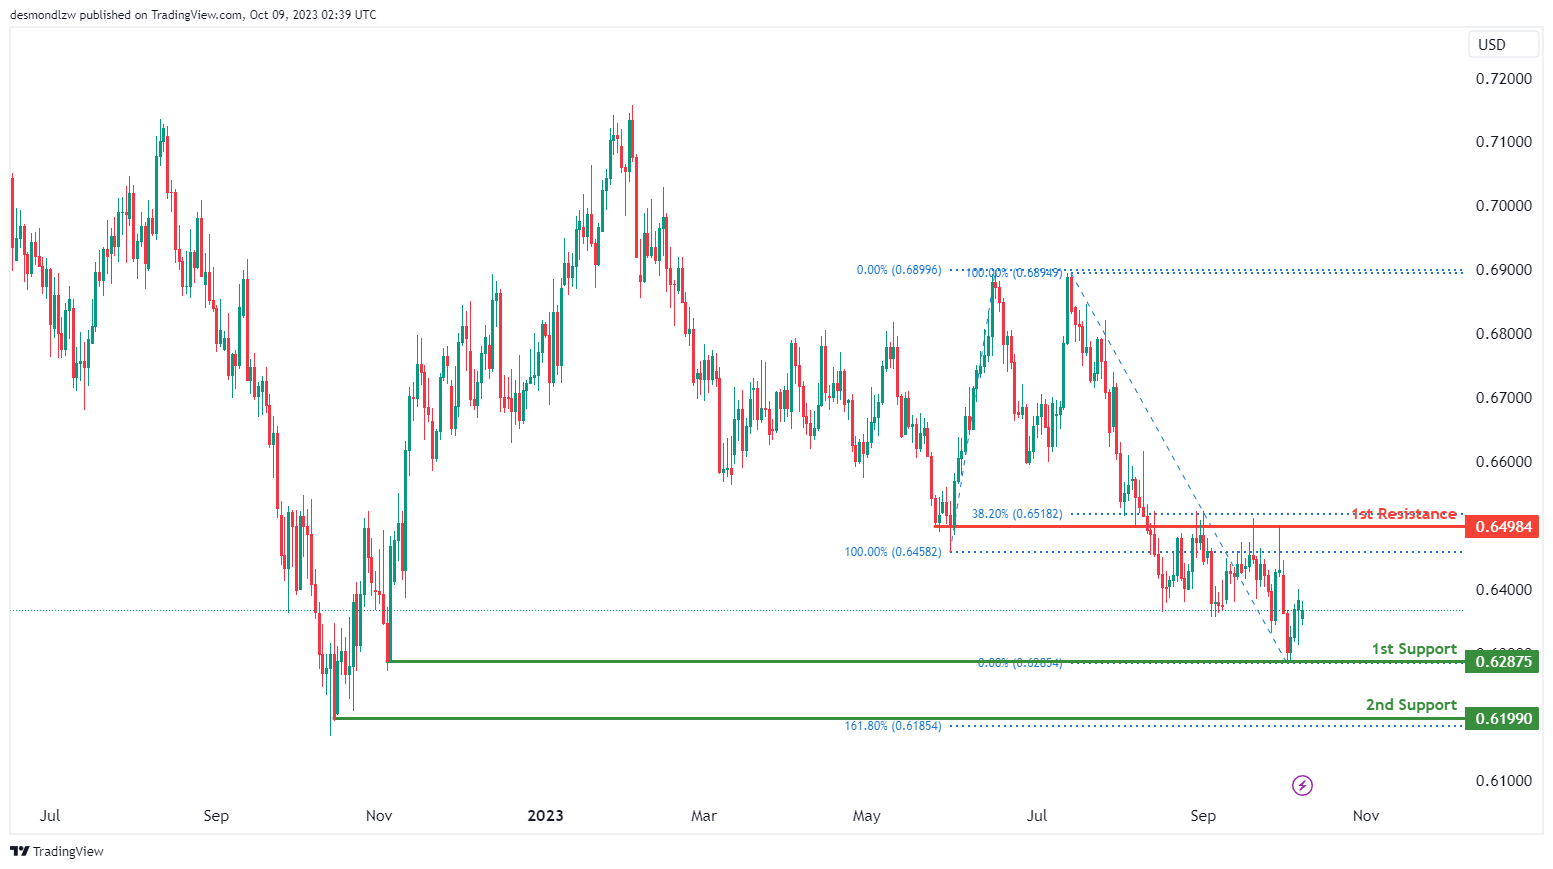
The AUD/USD chart currently exhibits an overall bearish momentum with a potential scenario for price to make a bearish continuation towards the 1st support level.
The 1st support level at 0.6288 is identified as a pullback support while the 2nd support level at 0.6199 is marked as a swing-low support that aligns with the 161.80% Fibonacci extension level, reinforcing its importance as a potential support level.
To the upside, the 1st resistance level at 0.6498 is identified as an overlap resistance that aligns close to the 38.20% Fibonacci retracement level, further emphasizing its significance as a barrier for future price increases.
NZD/USD
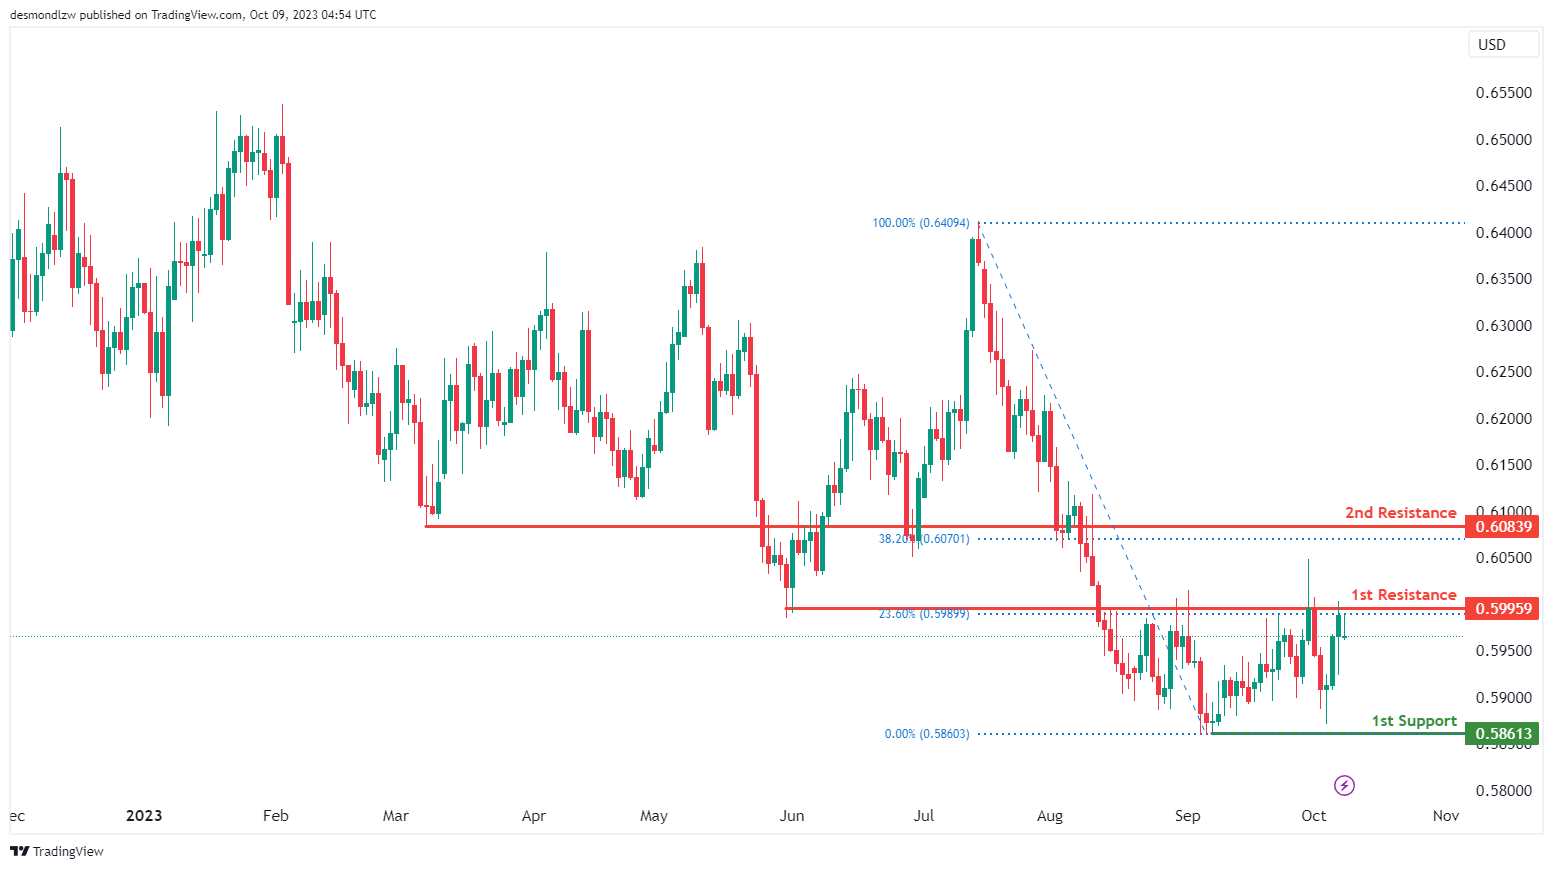
The NZD/USD chart currently exhibits an overall bearish momentum with a potential scenario for price to make a bearish reaction off the 1st resistance and drop towards the 1st support level.
The 1st resistance level at 0.5996 is identified as an overlap resistance that aligns with the 23.60% Fibonacci retracement level. Additionally, the 2nd resistance level at 0.6084 is also marked as an overlap resistance that aligns with the 38.20% Fibonacci retracement level, further emphasizing its significance as a barrier for future price increases.
To the downside, the 1st support level at 0.5861 is identified as a pullback support, further reinforcing its significance as an area where price may find support.
DJ30:
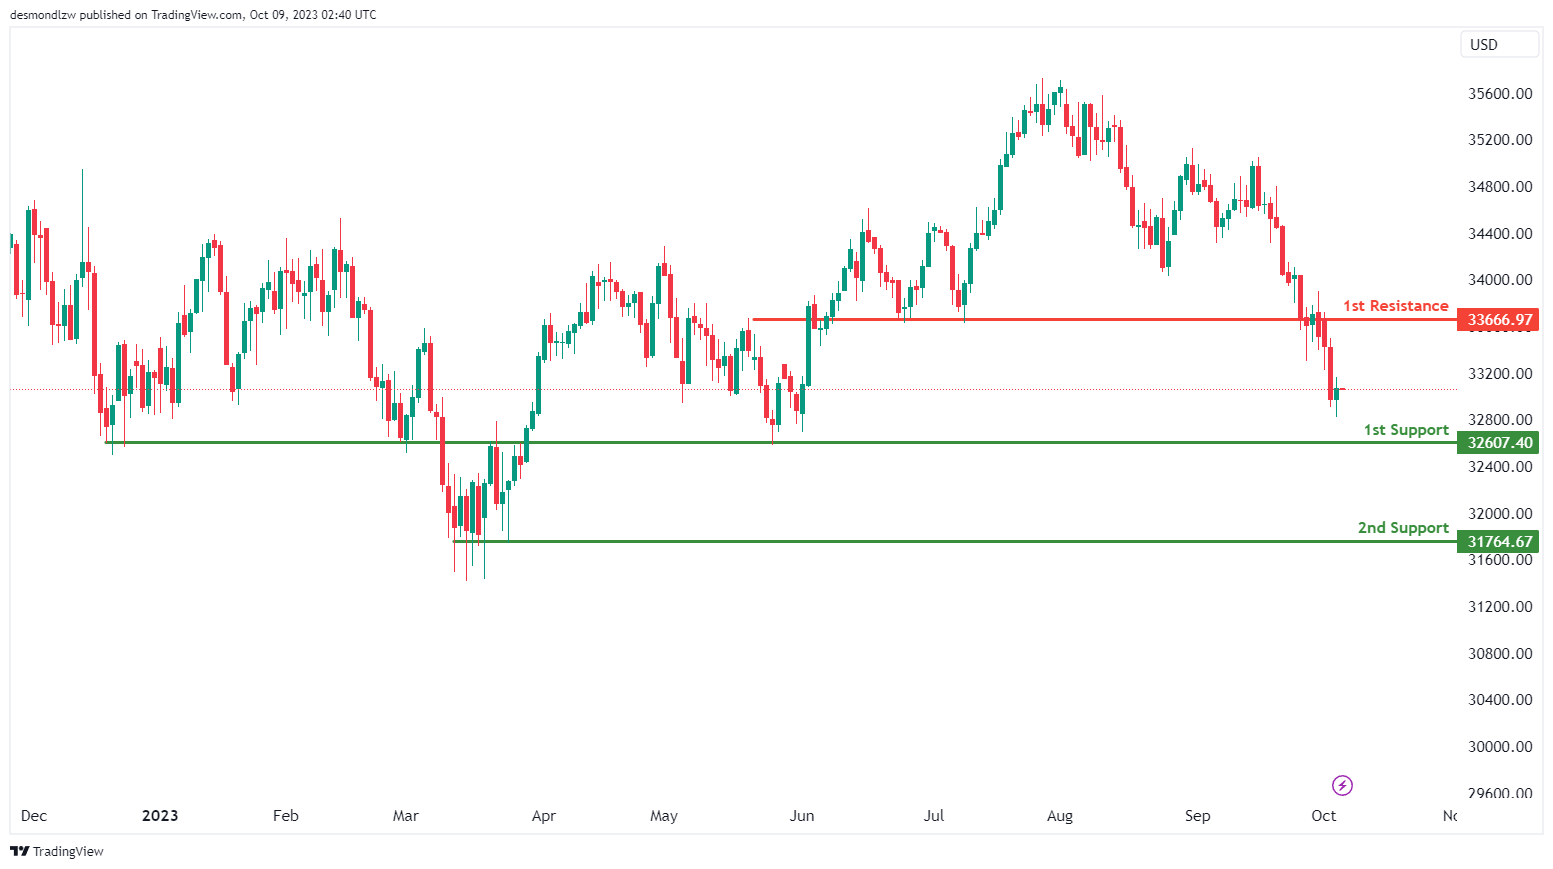
The DJ30 (Dow Jones 30) chart is currently displaying a neutral overall momentum, indicating the potential scenario of price fluctuating between the 1st resistance and the 1st support levels.
The 1st support level at 32,607.40 is identified as an overlap support. Additionally, the 2nd support level at 31,764.67 is marked as a pullback support, providing another important level to watch.
To the upside, the 1st resistance level at 33,666.97 is identified as an overlap resistance, potentially acting as a barrier to further upward movement.
GER40:
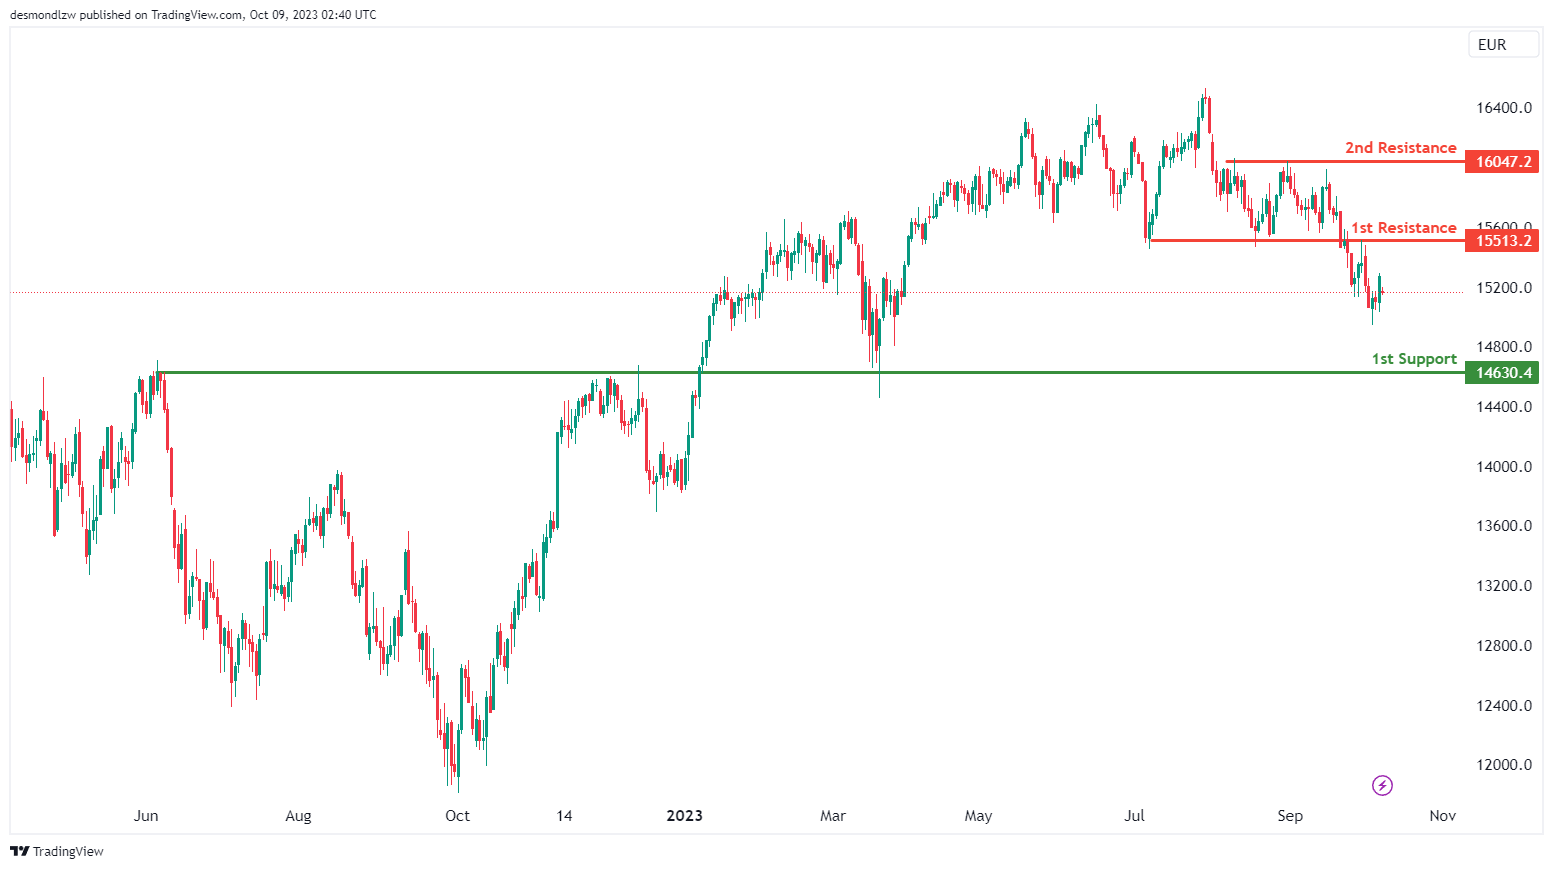
The GER40 chart currently exhibits a neutral momentum, suggesting a potential scenario of price fluctuation between the 1st resistance and the 1st support levels.
The 1st support level at 14,630.40 is identified as an overlap support, a potential level where price might find buying interest.
To the upside, the 1st resistance level at 15,513.20 is noted as an overlap resistance. Beyond this, the 2nd resistance level at 16,047.20 represents a pullback resistance, potentially acting as a barrier to further upward movement.
US500
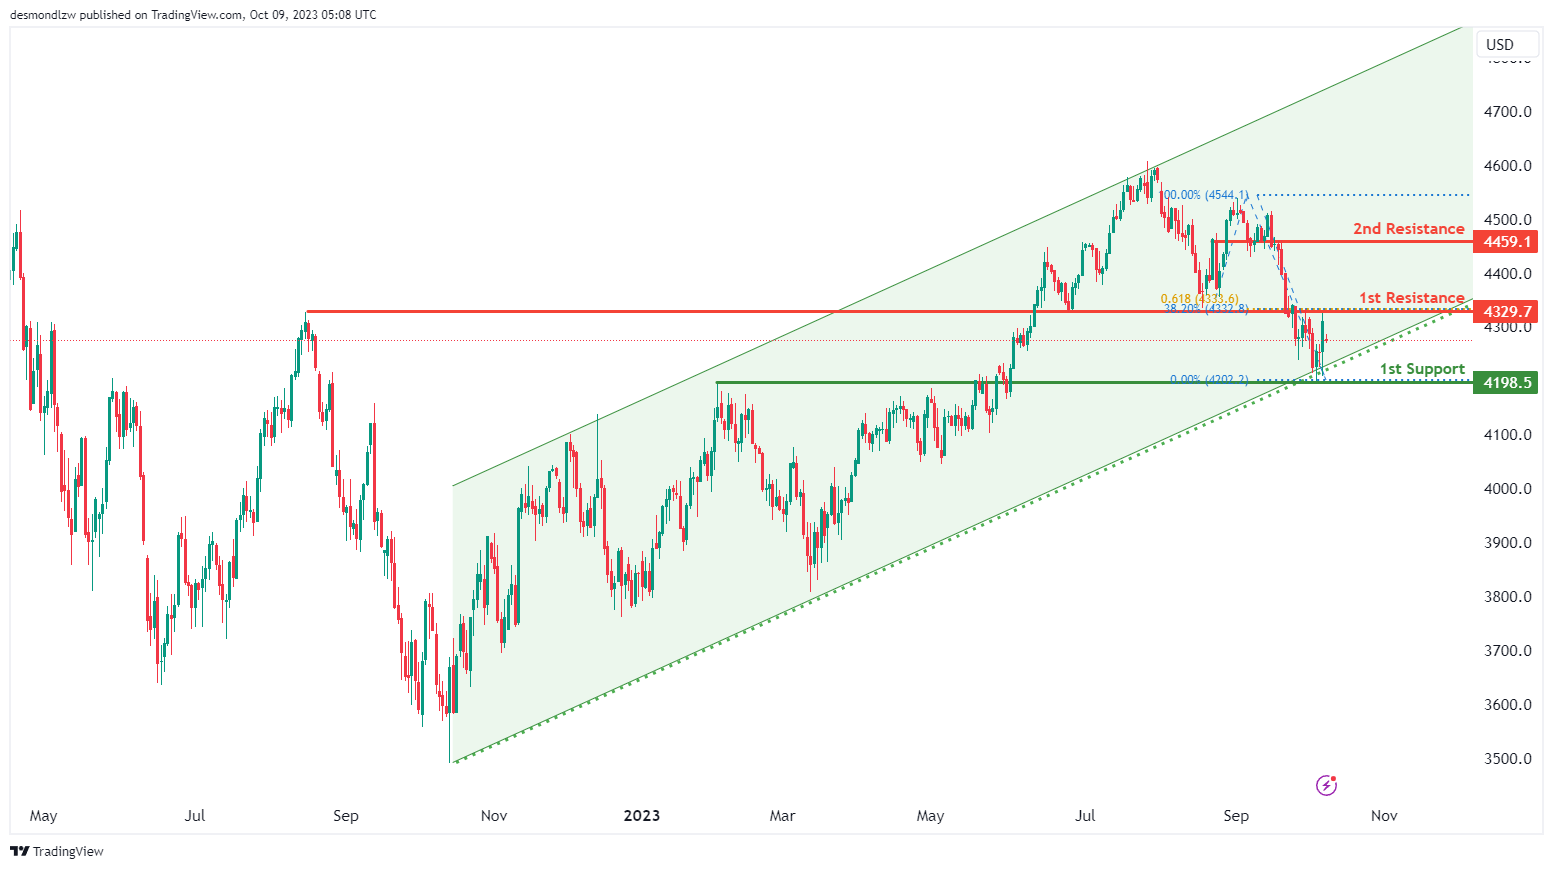
The US500 chart currently exhibits a neutral momentum, suggesting a potential scenario of price fluctuation between the 1st resistance and the 1st support levels.
The 1st support level at 4,198.50 is identified as an overlap support, reinforced by the presence of the ascending trendline.
To the upside, the 1st resistance level at 4,329.70 is noted as an overlap resistance that coincides with a confluence of Fibonacci levels i.e. the 38.20% retracement and the 61.80% projection levels. Beyond this, the 2nd resistance level at 4,459.10 also represents an overlap resistance, potentially acting as a barrier to further upward movement.
BTC/USD:
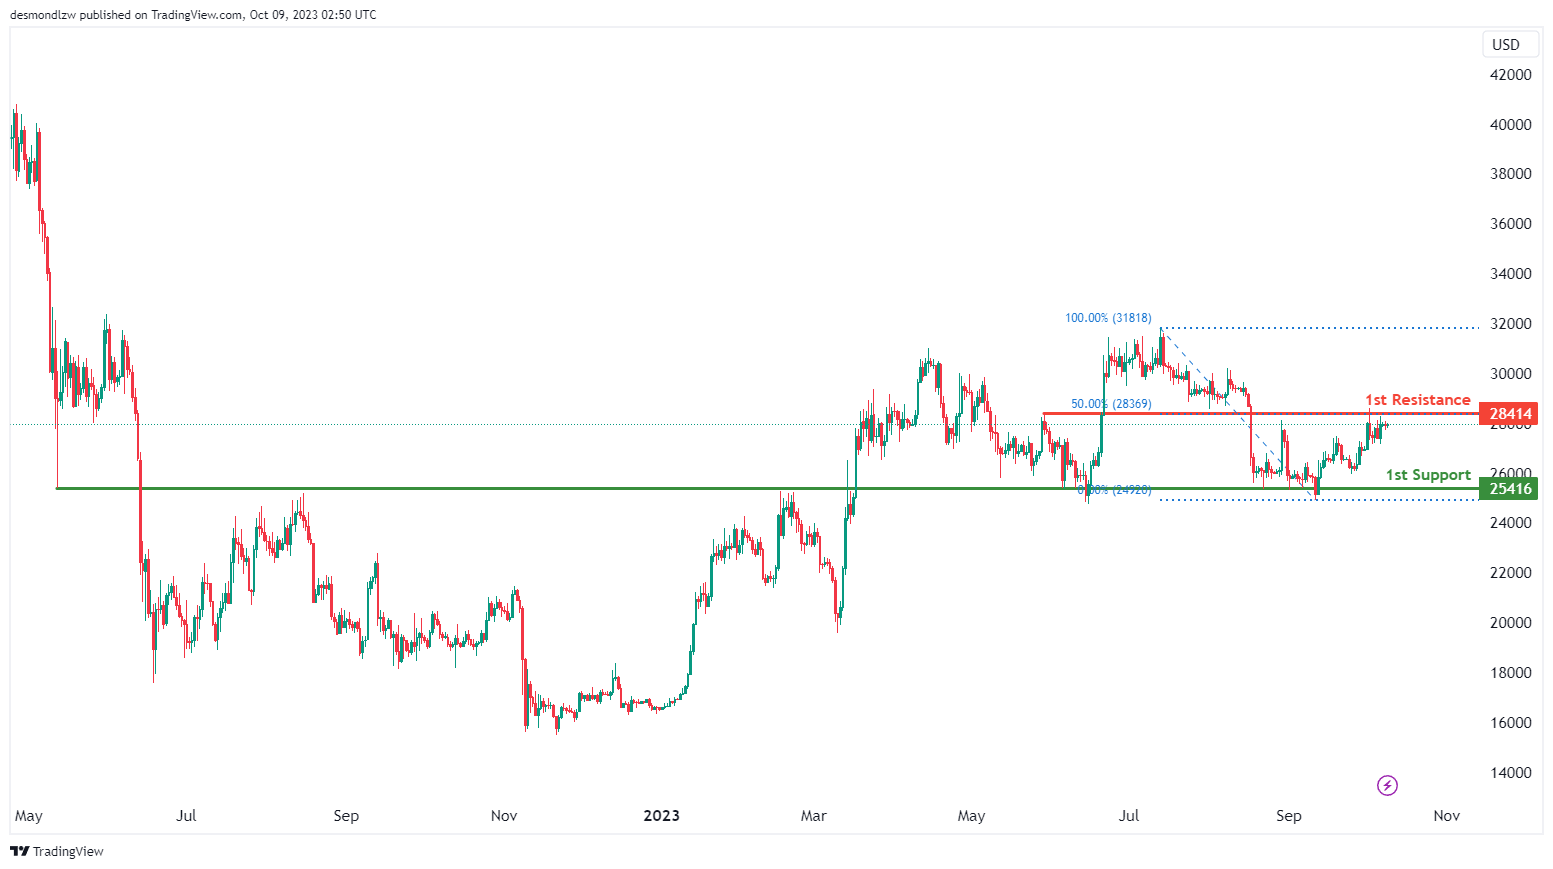
The BTC/USD chart currently has a neutral momentum, suggesting a potential scenario of price fluctuation between the 1st resistance and the 1st support levels.
The 1st support at 25,416 is identified as an overlap support, a potential level where price might find buying interest.
To the upside, the 1st resistance level at 28,414 is noted as an overlap resistance that aligns with the 50.00% Fibonacci retracement level, potentially acting as a barrier to further upward movement.
ETH/USD:
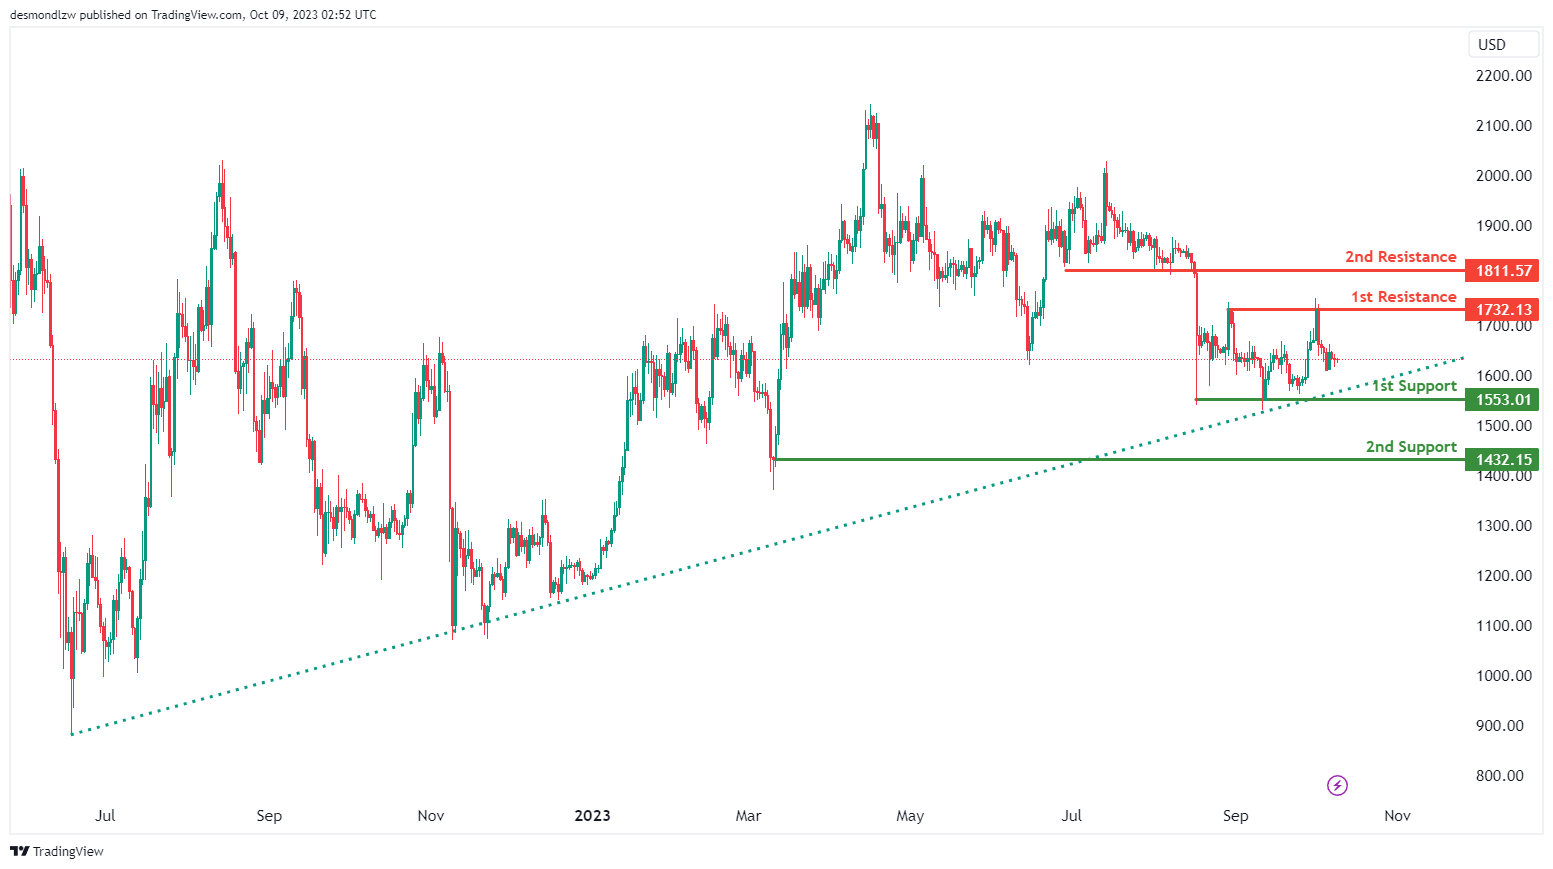
The ETH/USD chart currently exhibits a neutral momentum, suggesting a potential scenario of price fluctuation between the 1st resistance and the 1st support levels.
The 1st support level at 1,553.01 is identified as a pullback support. Additionally, the 2nd support at 1,432.15 is noted as a swing-low support, suggesting it could provide additional support to price if it declines.
To the upside, the 1st resistance level at 1,732.13 is identified as a pullback resistance. Beyond the 1st resistance level, the 2nd resistance level at 1,811.57 is recognized as a pullback resistance, implying that it has previously held as a price barrier.
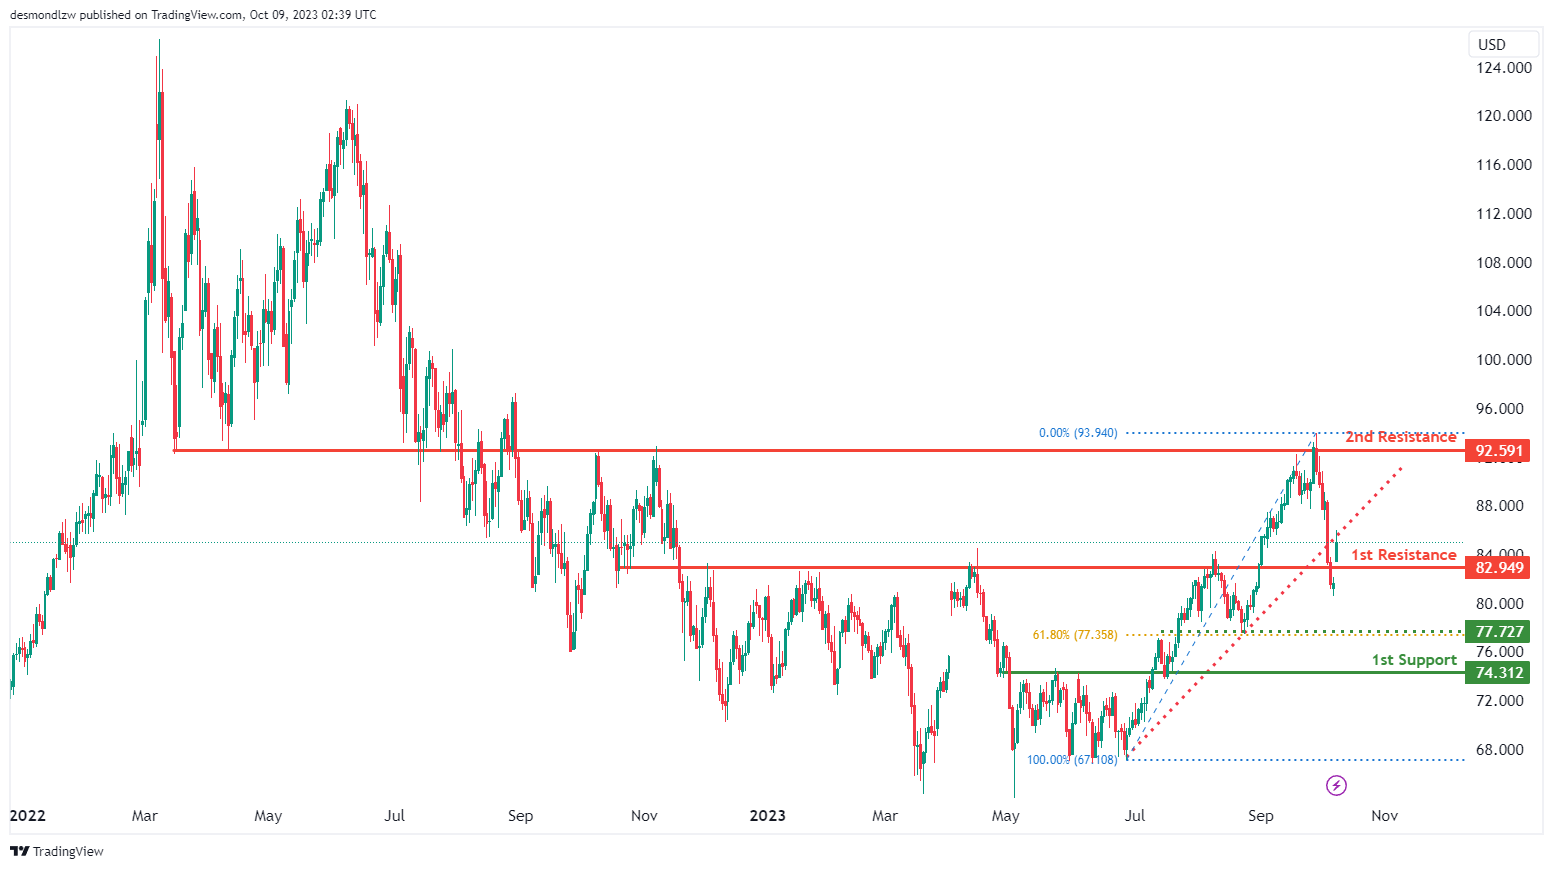
WTI/USD:
The WTI chart currently shows a bullish momentum with price breaking above the 1st resistance level this morning and is likely to remain above this level today.
The 1st resistance level at 82.95 is identified as an overlap resistance while the 2nd resistance level at 92.59 is also noted as an overlap resistance, potentially acting as a barrier to further upward movement.
To the downside, the intermediate support level at 77.73 is identified as an overlap support that aligns with the 61.80% Fibonacci retracement level while the 1st support level at 74.31 is also noted as an overlap support, further reinforcing its significance as an area where price may find support.
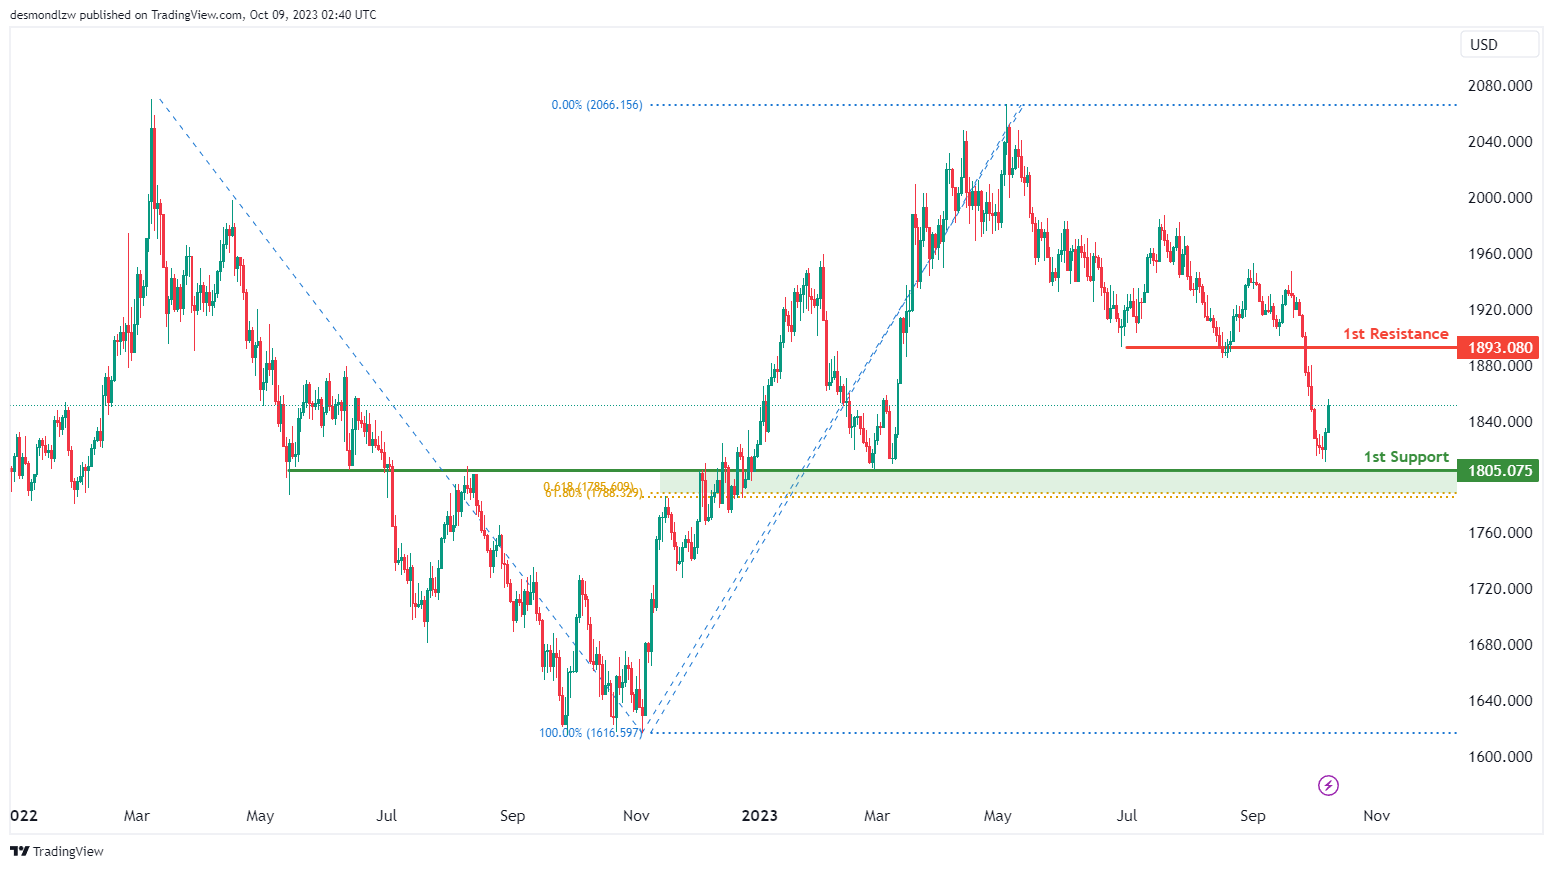
XAU/USD (GOLD):
The XAU/USD chart currently exhibits bullish momentum, with a potential scenario of a bullish continuation towards the 1st resistance level.
The 1st resistance level at 1893.08 is identified as a pullback resistance, potentially acting as a barrier to further upward movement.
To the downside, the 1st support level at 1805.08 is noted as an overlap support that coincides with a confluence of Fibonacci levels i.e. the 61.80% retracement and the 61.80% projection levels, further reinforcing its significance as an area where price may find support.


