
DXY:
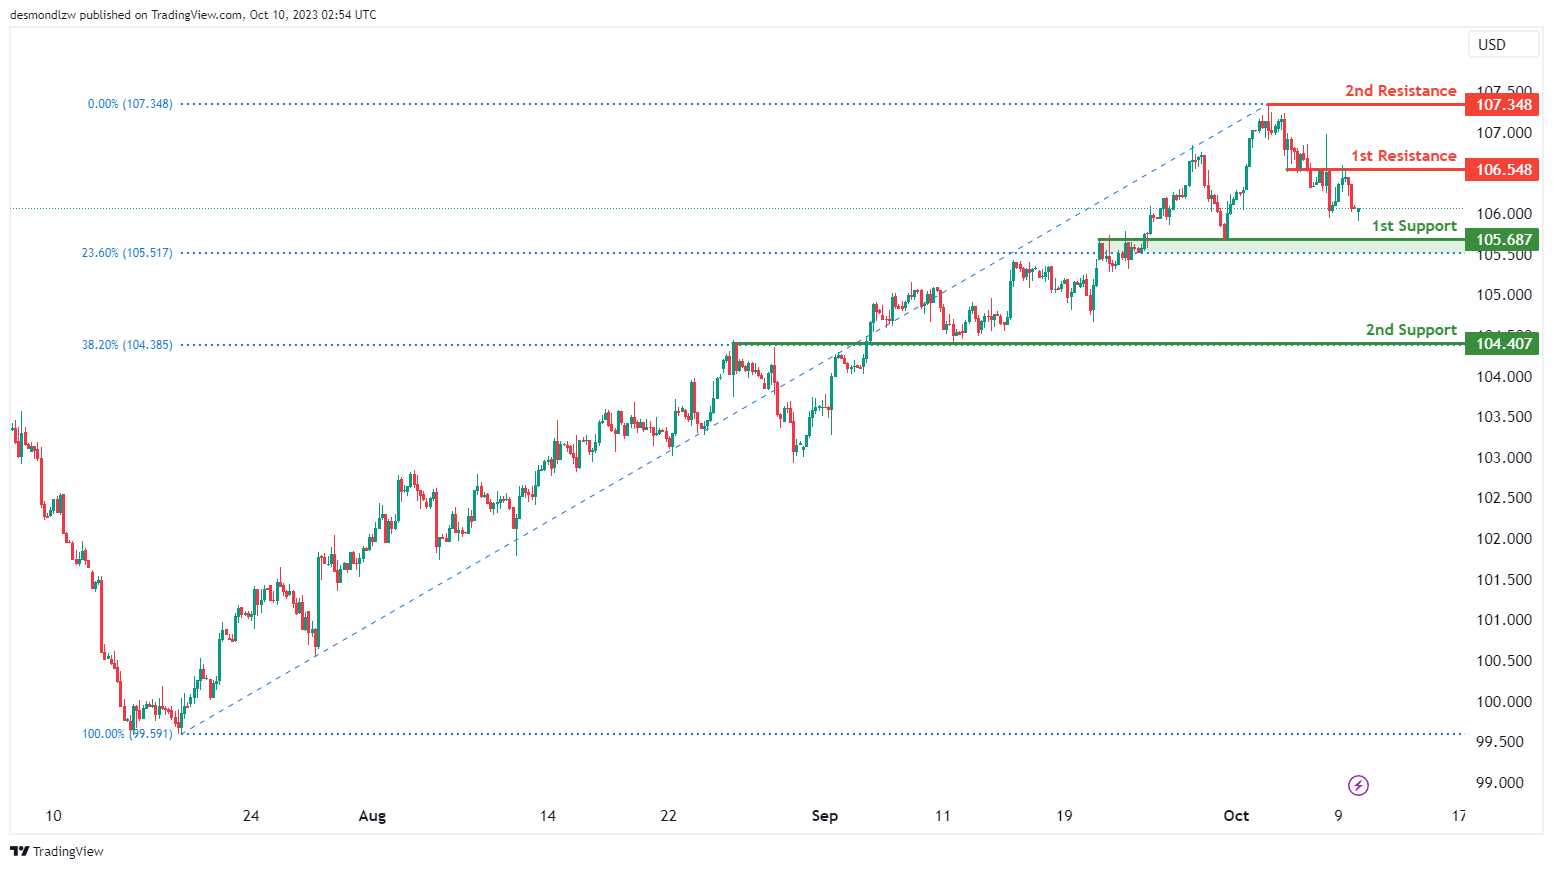
The DXY (US Dollar Index) chart currently exhibits an overall bearish momentum with a potential for price to make a bearish continuation towards the 1st support level.
The 1st support level at 105.69 is identified as an overlap support that aligns close to the 23.60% Fibonacci retracement level. Additionally, the 2nd support level at 104.41 is also noted as an overlap support that aligns with the 38.20% Fibonacci retracement level, further reinforcing its significance as a potential area where price could find support.
To the upside, the 1st resistance level at 106.55 is identified as an overlap resistance. Further up, the 2nd resistance level at 107.35 is noted as a swing-high resistance, indicating its potential role as a barrier to upward movements.
EUR/USD:
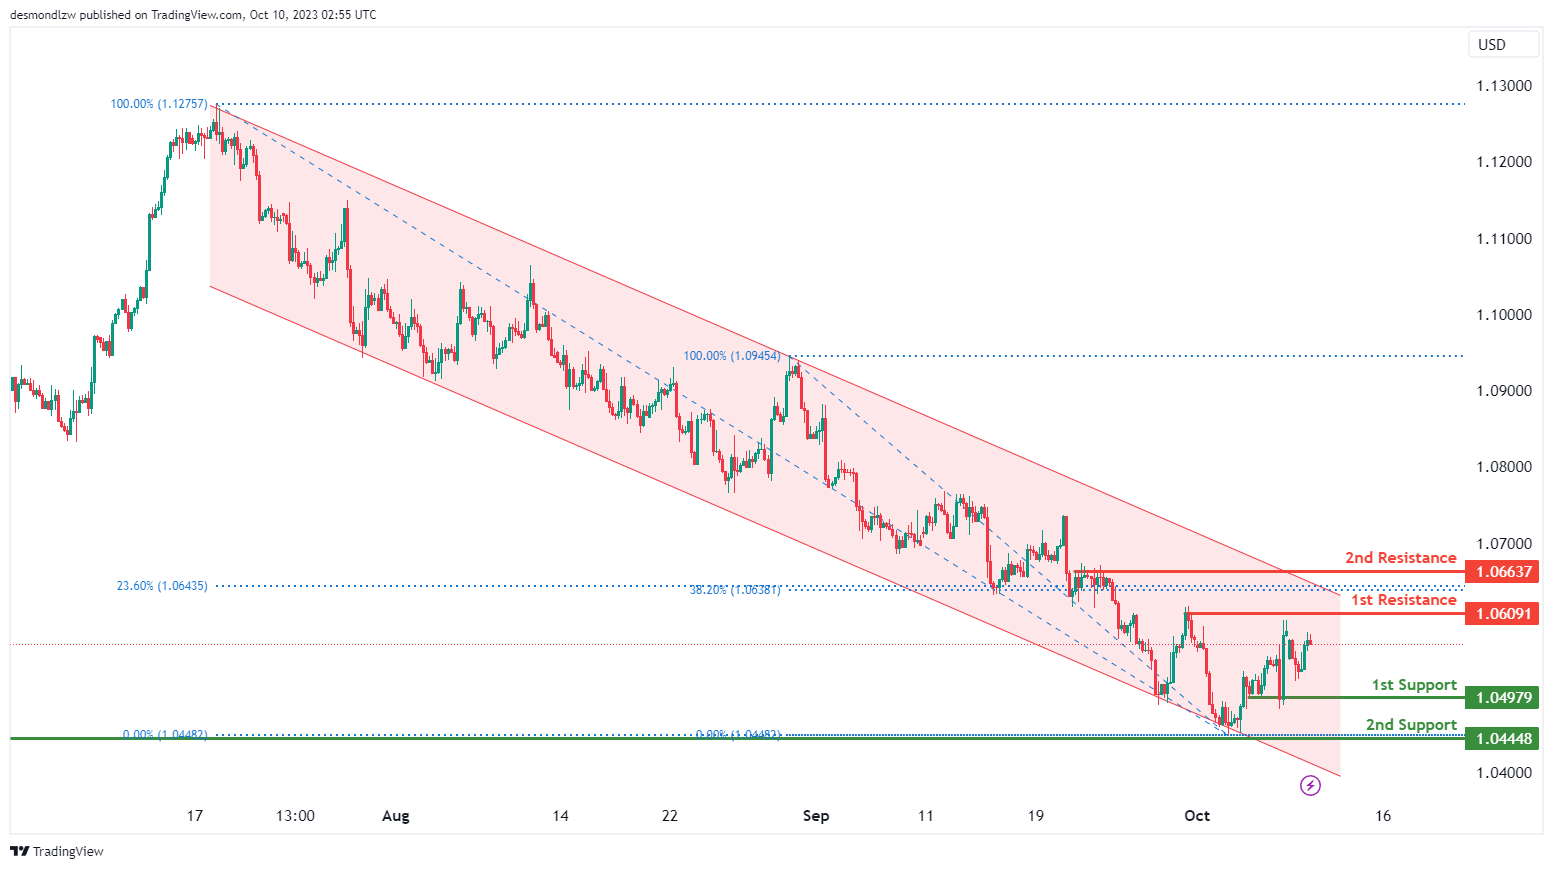
The EUR/USD chart currently exhibits an overall bearish momentum with price trading within the bearish descending channel. There is a potential for price to make a bearish reaction off the 1st resistance level and fall towards the 1st support level.
The 1st resistance level at 1.0609 is identified as a pullback resistance. Additionally, the 2nd resistance level at 1.0664 is also noted as a pullback resistance that aligns close to a confluence of Fibonacci levels i.e. the 23.60% retracement and the 38.20% retracement levels, suggesting that it may act as a barrier to upward movements.
To the downside, the 1st support level at 1.0498 is identified as a pullback support while the 2nd support at 1.0445 is also noted as a pullback support, making it an important level for potential price support.
EUR/JPY:
The instrument we are analyzing is EUR/JPY, and the overall momentum of the chart indicates a bullish trend.
There is a possibility that the price may continue in a bullish direction, potentially reaching the first resistance level.
The first support level is at 156.66, and it’s considered strong because it represents an overlap of support.
The second support level is at 155.81, and it’s also significant as it marks an overlap of support and aligns with a 61.80% Fibonacci Retracement.
On the resistance side, the first resistance level is at 158.01, and it’s noteworthy because it represents a swing high resistance.
The second resistance level is at 158.53, and it’s significant as well, as it represents a multi-swing high resistance.

EUR/GBP:
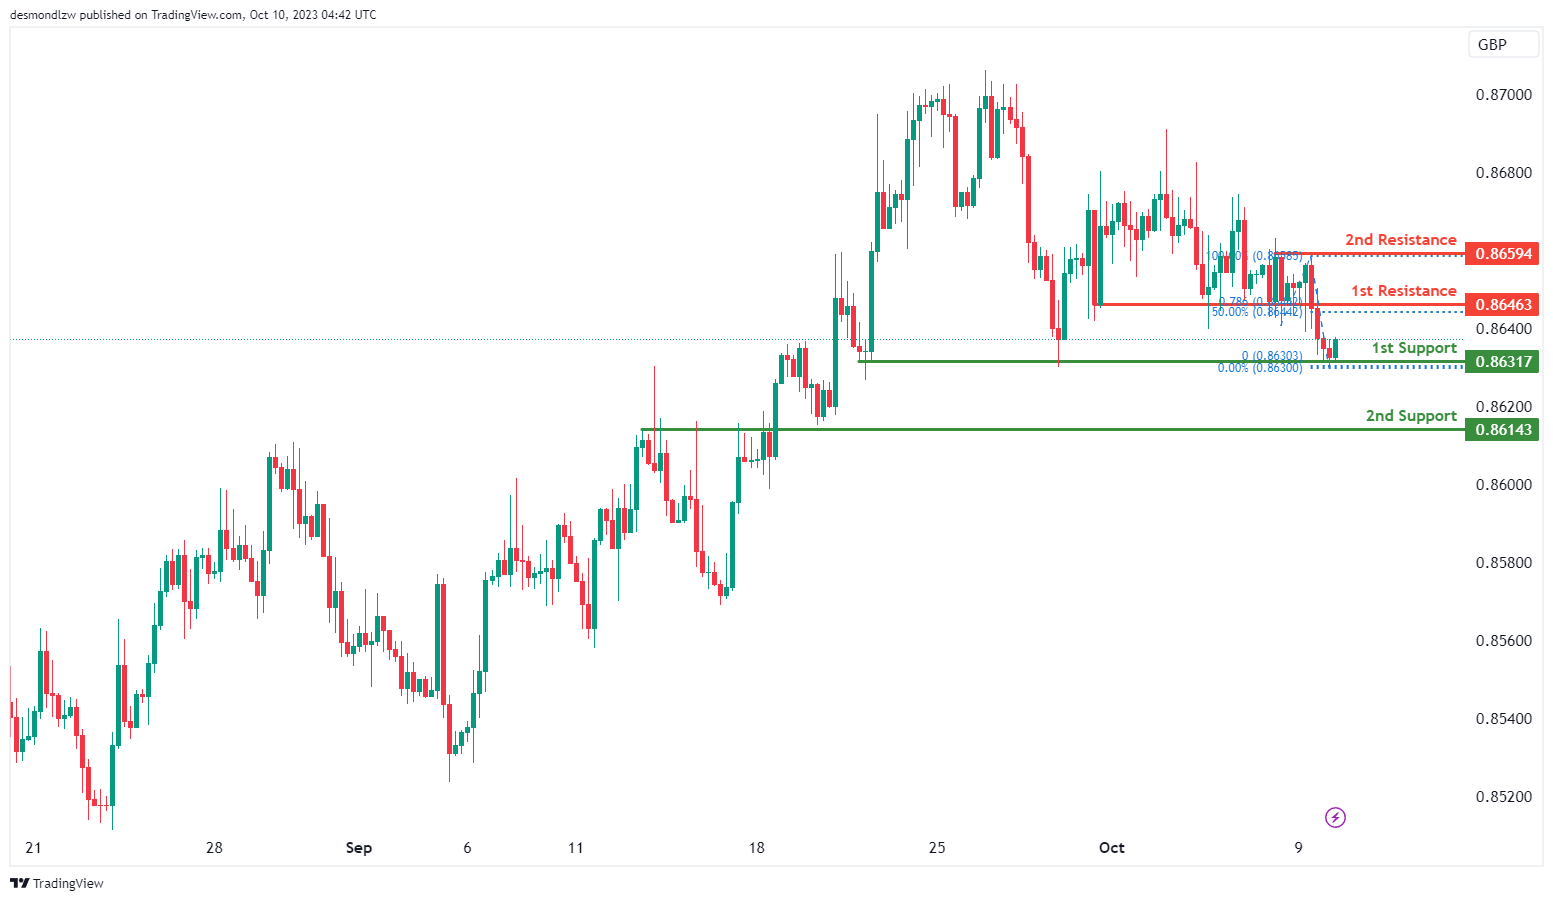
The instrument we are examining is EUR/GBP, and the overall momentum of the chart indicates a bullish trend.
There is a possibility that the price may continue in a bullish direction, potentially reaching the first resistance level.
The first support level is at 0.8631, and it’s considered strong because it represents a multi-swing low support.
The second support level is at 0.8614, and it’s also significant as it marks an overlap of support.
On the resistance side, the first resistance level is at 0.8646, and it’s noteworthy because it functions as a pullback resistance and aligns with a 50% Fibonacci Retracement and a 78.60% Fibonacci Projection, indicating a Fibonacci confluence.
The second resistance level is at 0.8659, and it’s significant as well, as it represents a multi-swing high resistance.
GBP/USD:
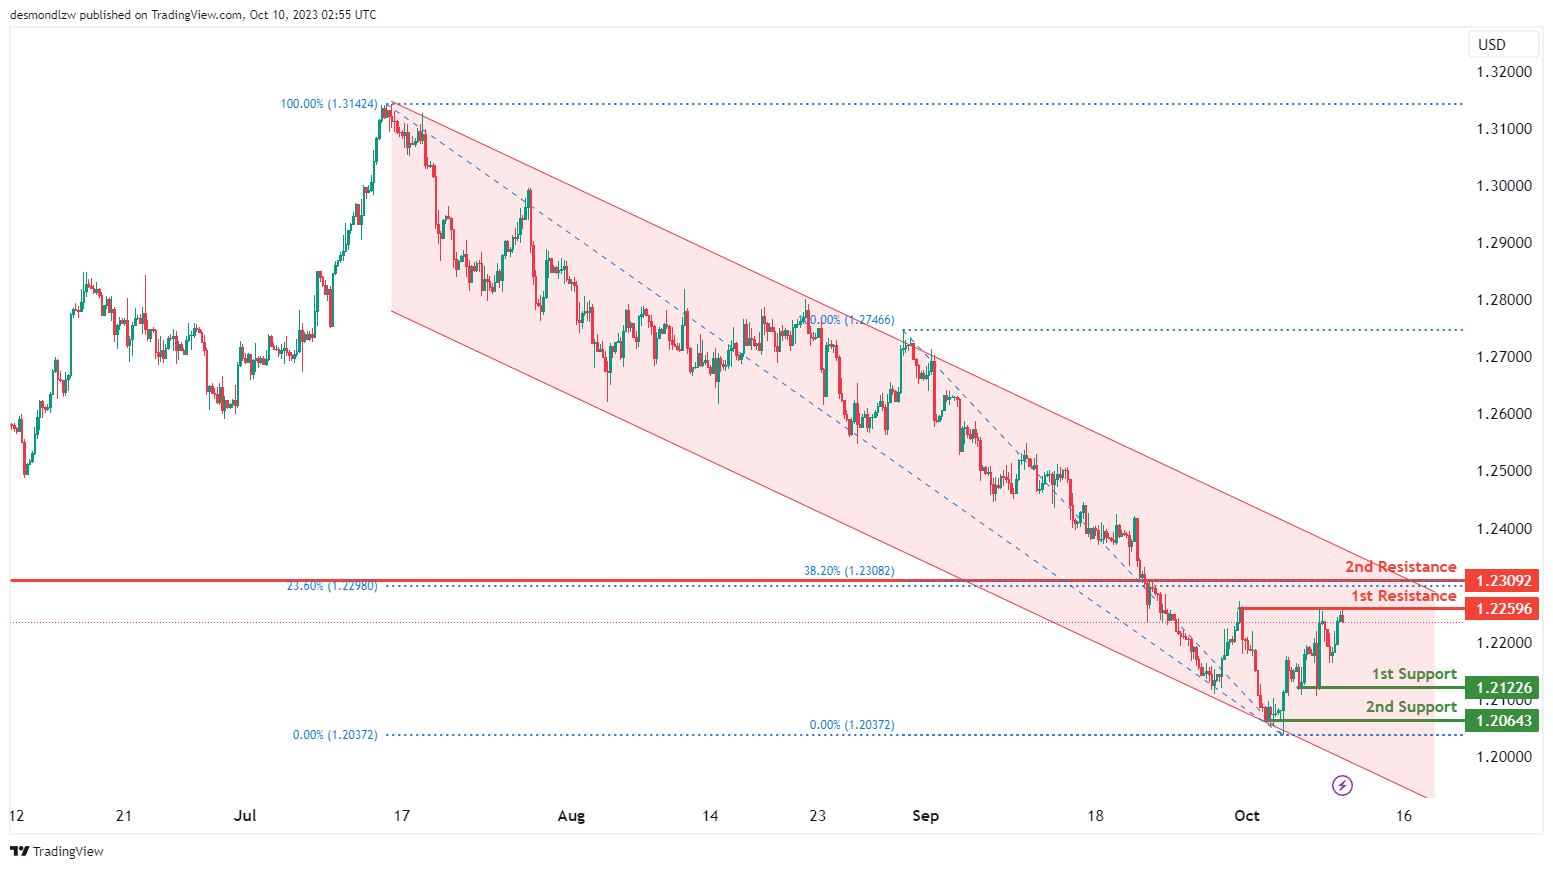
The GBP/USD chart currently exhibits an overall bearish momentum with price trading within the bearish descending channel. There is a potential for price to make a bearish reaction off the 1st resistance level and fall towards the 1st support level.
The 1st resistance level at 1.2259 is identified as a pullback resistance. Beyond this, the 2nd resistance level at 1.2309 is also noted as a pullback resistance that aligns with a confluence of Fibonacci levels i.e. the 23.60% retracement and the 38.20% retracement levels, suggesting it may act as a barrier to upward movements.
To the downside, the 1st support level at 1.2123 is identified as a pullback support. Additionally, the 2nd support level at 1.2064 is noted as a pullback support, further reinforcing its significance as a potential area where price could find support.
GBP/JPY:
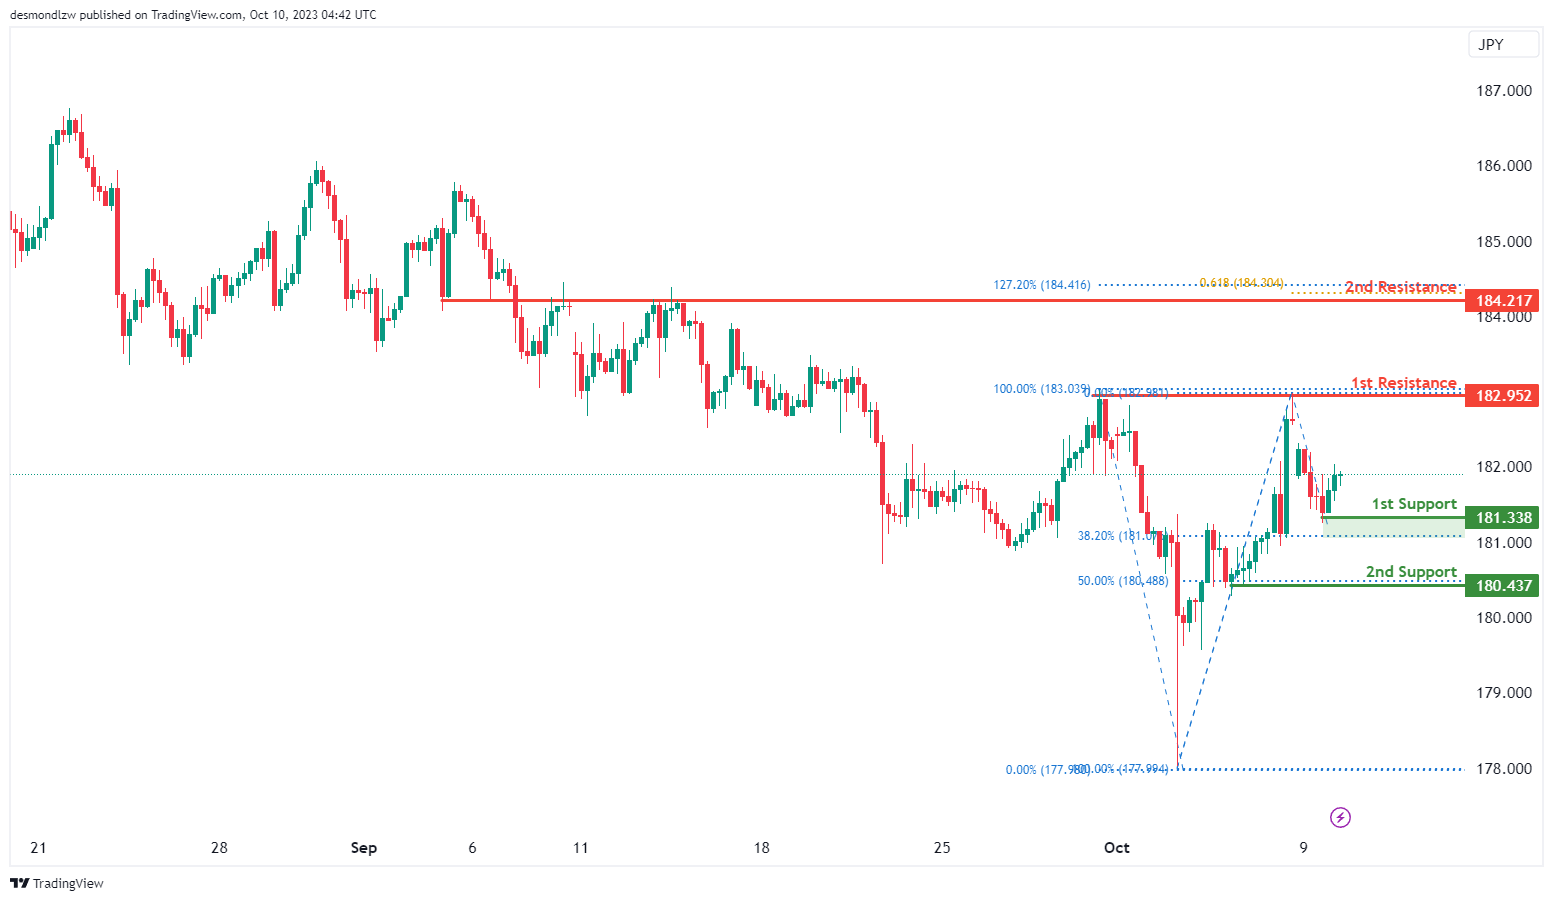
The instrument we are analyzing is GBP/JPY, and the overall momentum of the chart suggests a bullish trend.
There is a possibility that the price may continue in a bullish direction, potentially reaching the first resistance level.
The first support level is at 181.33, and it’s considered strong because it represents a swing low support and aligns with a 38.20% Fibonacci Retracement.
The second support level is at 180.43, and it’s also significant as it marks a swing low support and corresponds to a 50% Fibonacci Retracement.
On the resistance side, the first resistance level is at 182.95, and it’s noteworthy because it represents a multi-swing high resistance.
The second resistance level is at 184.21, and it’s significant as well, as it functions as an overlap resistance and aligns with a 127.20% Fibonacci Extension and a 61.80% Fibonacci Projection, indicating a Fibonacci confluence.
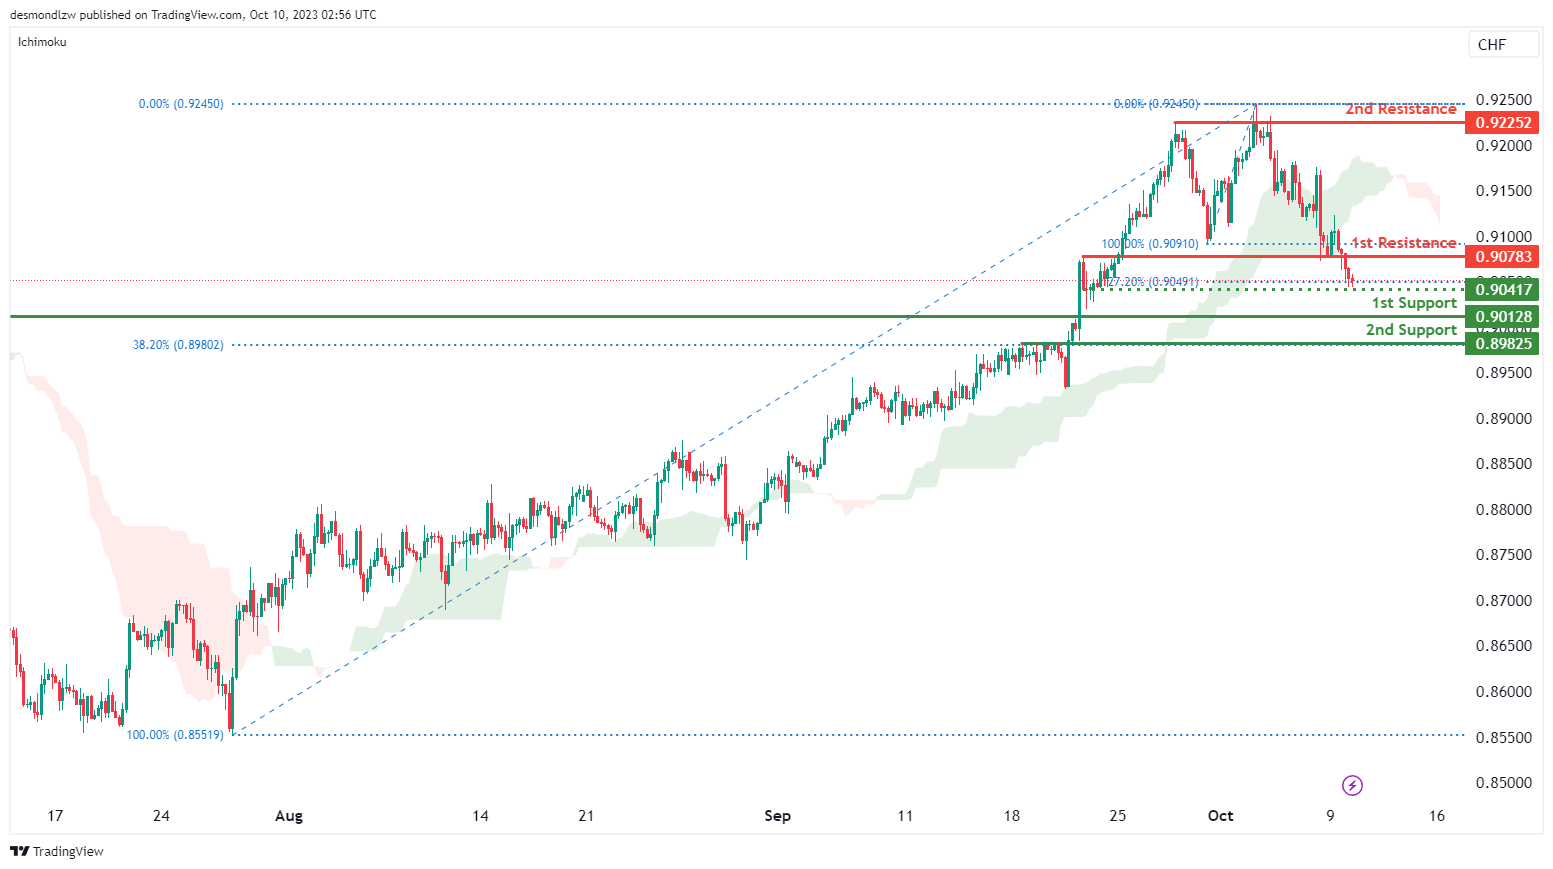
USD/CHF:
The USD/CHF chart currently exhibits an overall bearish momentum with price breaking under the bullish Ichimoku cloud. Should price break below the intermediate support level, there is a potential for price to make a bearish continuation towards the 1st support level.
The intermediate support level at 0.9042 is identified as a pullback support that aligns close to the 127.20% Fibonacci extension level while the 1st support level at 0.9013 is also noted as a pullback support. Additionally, the 2nd support level at 0.8983 is identified as a pullback support that aligns with the 38.20% Fibonacci retracement level, further reinforcing its significance as an area where the price may find support.
To the upside, the 1st resistance level at 0.9078 is identified as an overlap resistance. Higher up, the 2nd resistance level at 0.9225 is noted as a multi-swing-high resistance, acting as a potential barrier to further price increases.
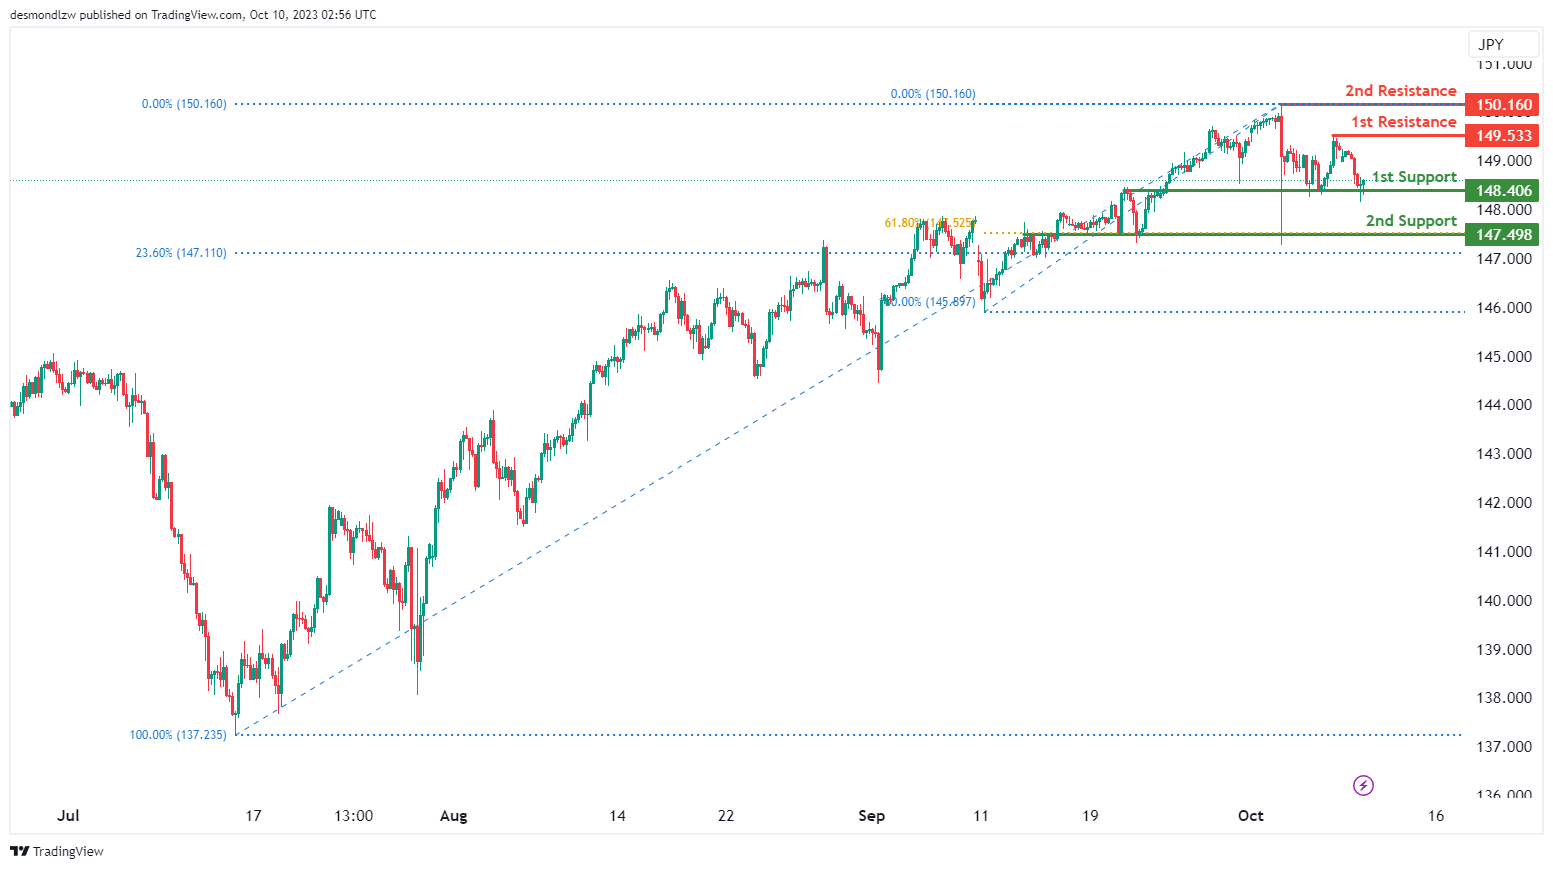
USD/JPY:
The USD/JPY chart currently exhibits a weak bullish momentum with a potential for price to make a bullish bounce off the 1st support level and rise towards the 1st resistance level.
The 1st support level at 148.41 is identified as an overlap support. Further below, the 2nd support at 147.49 is also noted as an overlap support that aligns with a confluence of Fibonacci levels i.e. the 23.60% retracement and the 61.80% retracement levels, further reinforcing its significance as an area where the price may find support.
To the upside, the 1st resistance level at 149.53 is identified as a pullback resistance. Higher up, the 2nd resistance level at 150.16 is noted as a swing-high resistance, acting as a potential barrier to further price increases.
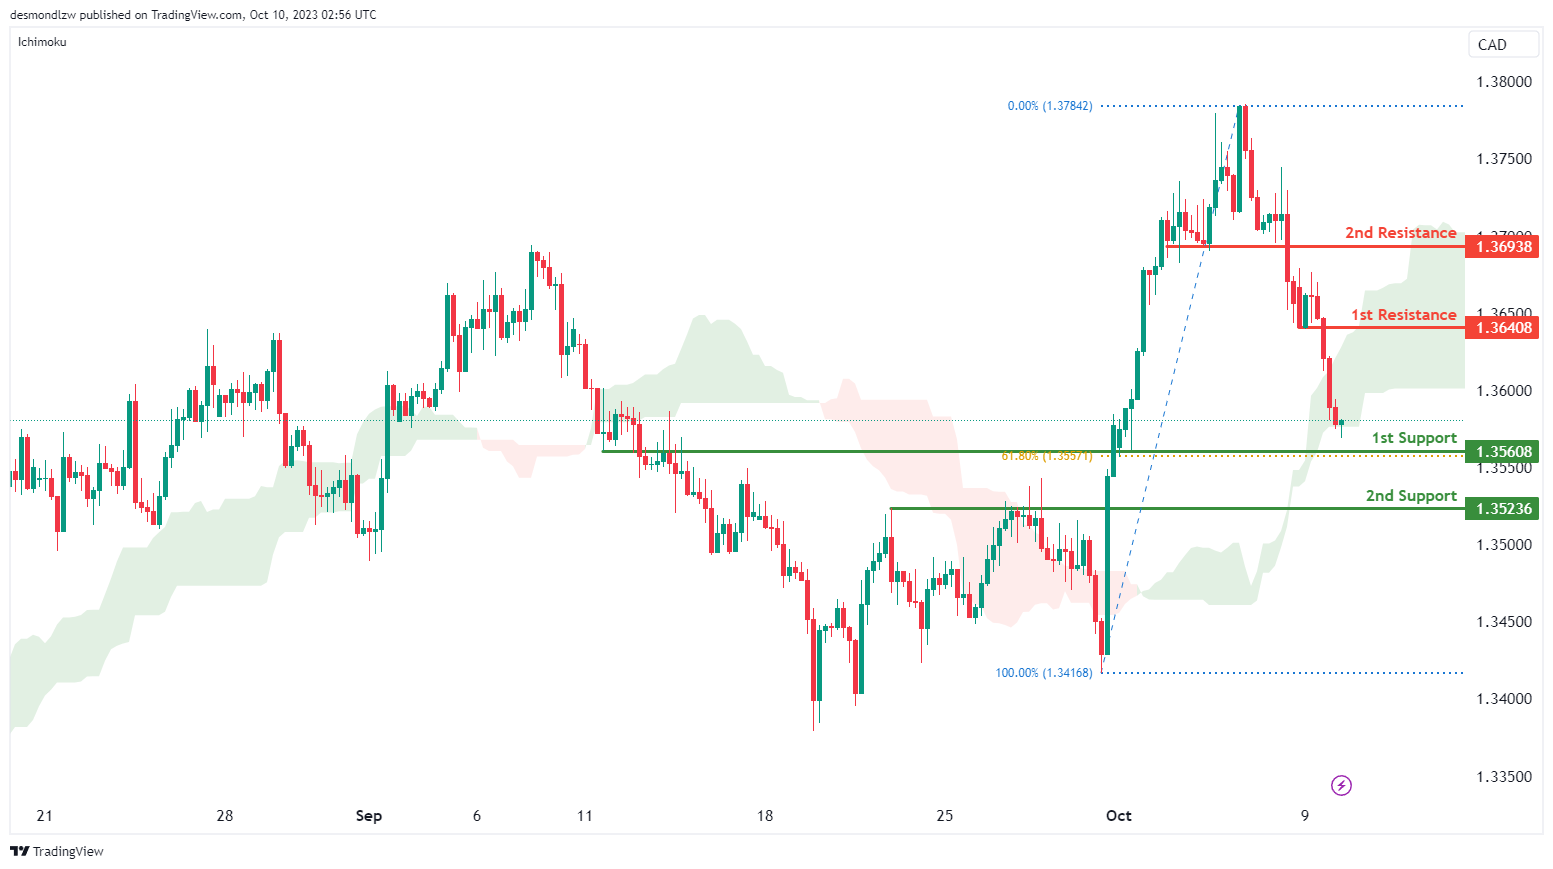
USD/CAD:
The USD/CAD chart is currently showing an overall bearish momentum, suggesting the possibility of a bearish continuation towards the 1st support should price break below the bullish Ichimoku cloud.
The 1st support level at 1.3561 is identified as an overlap support that aligns with the 61.80% Fibonacci retracement level. Additionally, the 2nd support level at 1.3524 is noted as a pullback support.
To the upside, the 1st resistance level at 1.3641 is identified as a pullback resistance. Higher up, the 2nd resistance level at 1.3694 is also noted as a pullback resistance, further emphasizing its significance as a barrier for future price increases.
AUD/USD:
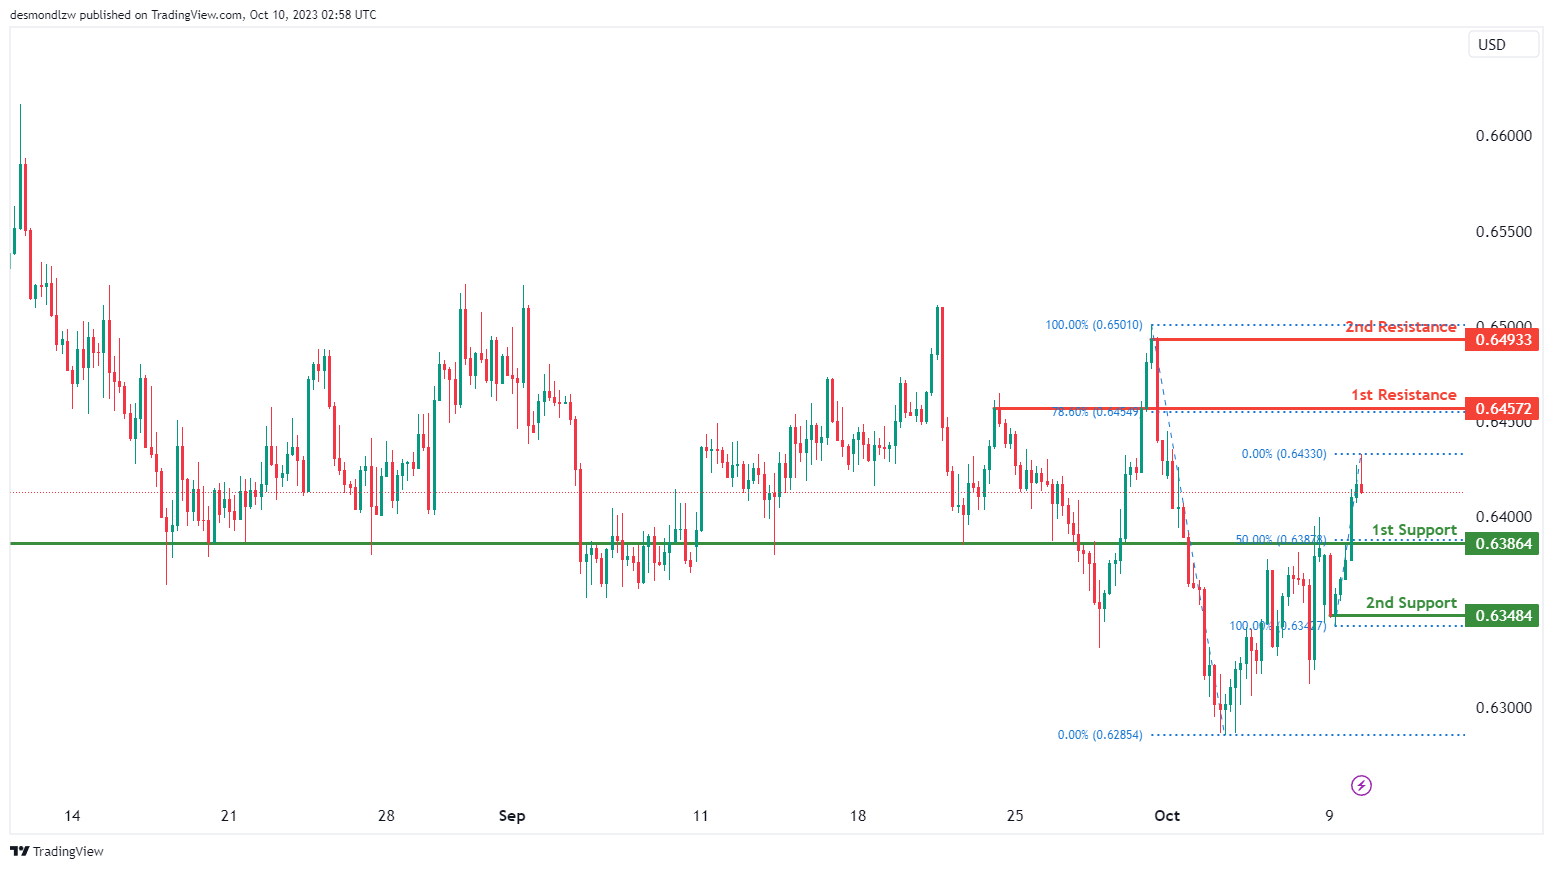
The AUD/USD chart currently exhibits a neutral momentum with a potential scenario for price to fluctuate between the 1st resistance and the 1st support levels.
The 1st support level at 0.6386 is identified as an overlap support that aligns with the 50.00% Fibonacci retracement level. Further below, the 2nd support level at 0.6348 is marked as a pullback, reinforcing its importance as a potential support level.
To the upside, the 1st resistance level at 0.6457 is identified as a swing-high resistance that aligns with the 78.60% Fibonacci retracement level. Additionally, the 2nd resistance level at 0.6493 is also noted as a swing-high resistance, further emphasizing its significance as a barrier for future price increases.
NZD/USD
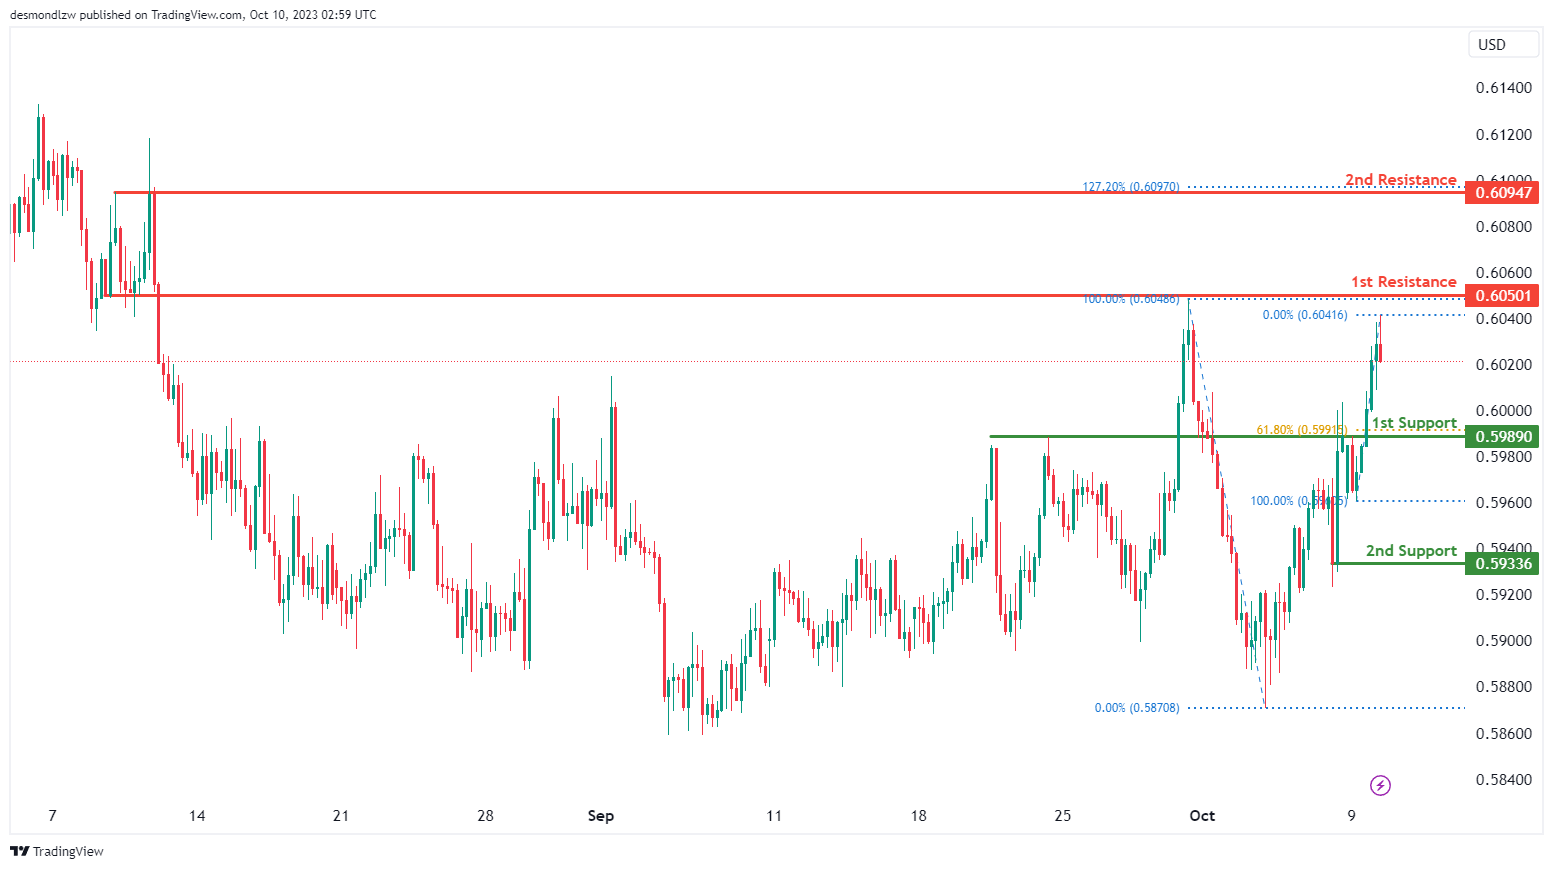
The NZD/USD chart currently exhibits a neutral momentum with a potential scenario for price to fluctuate between the 1st resistance and the 1st support levels.
The 1st resistance level at 0.6050 is identified as an overlap resistance. Additionally, the 2nd resistance level at 0.6095 is marked as a pullback resistance that aligns with the 127.20% Fibonacci extension level, further emphasizing its significance as a barrier for future price increases.
To the downside, the 1st support level at 0.5989 is identified as an overlap support that aligns with the 61.80% Fibonacci retracement level. Further below, the 2nd support level at 0.5934 is noted as a pullback support, further reinforcing its significance as an area where price may find support.
DJ30:
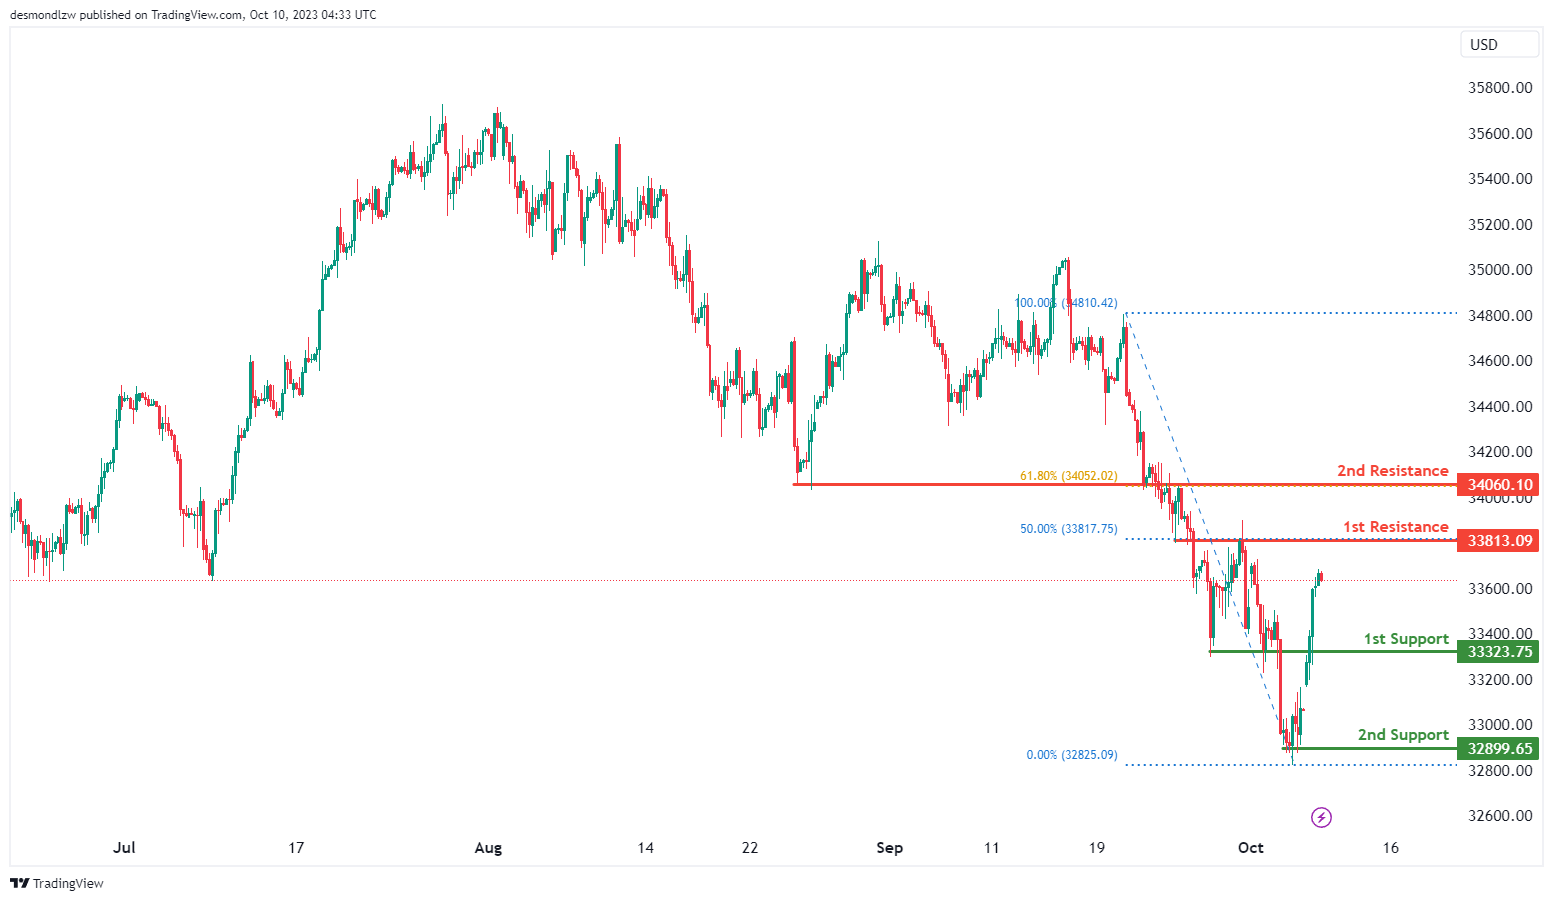
The instrument we are examining is DJ30, and the overall momentum of the chart indicates a bullish trend.
There is a possibility that the price may continue in a bullish direction, potentially reaching the first resistance level.
The first support level is at 33,323.75, and this support is considered strong due to its role as a pullback support.
The second support level is at 32,899.65, and it’s also significant as it represents a multi-swing low support.
On the resistance side, the first resistance level is at 33,813.09, and it’s noteworthy because it marks an overlap of resistance and is accompanied by a 50% Fibonacci Retracement.
The second resistance level is at 34,060.10, and it’s significant as well, as it represents an overlap of resistance and coincides with a 61.80% Fibonacci Retracement.
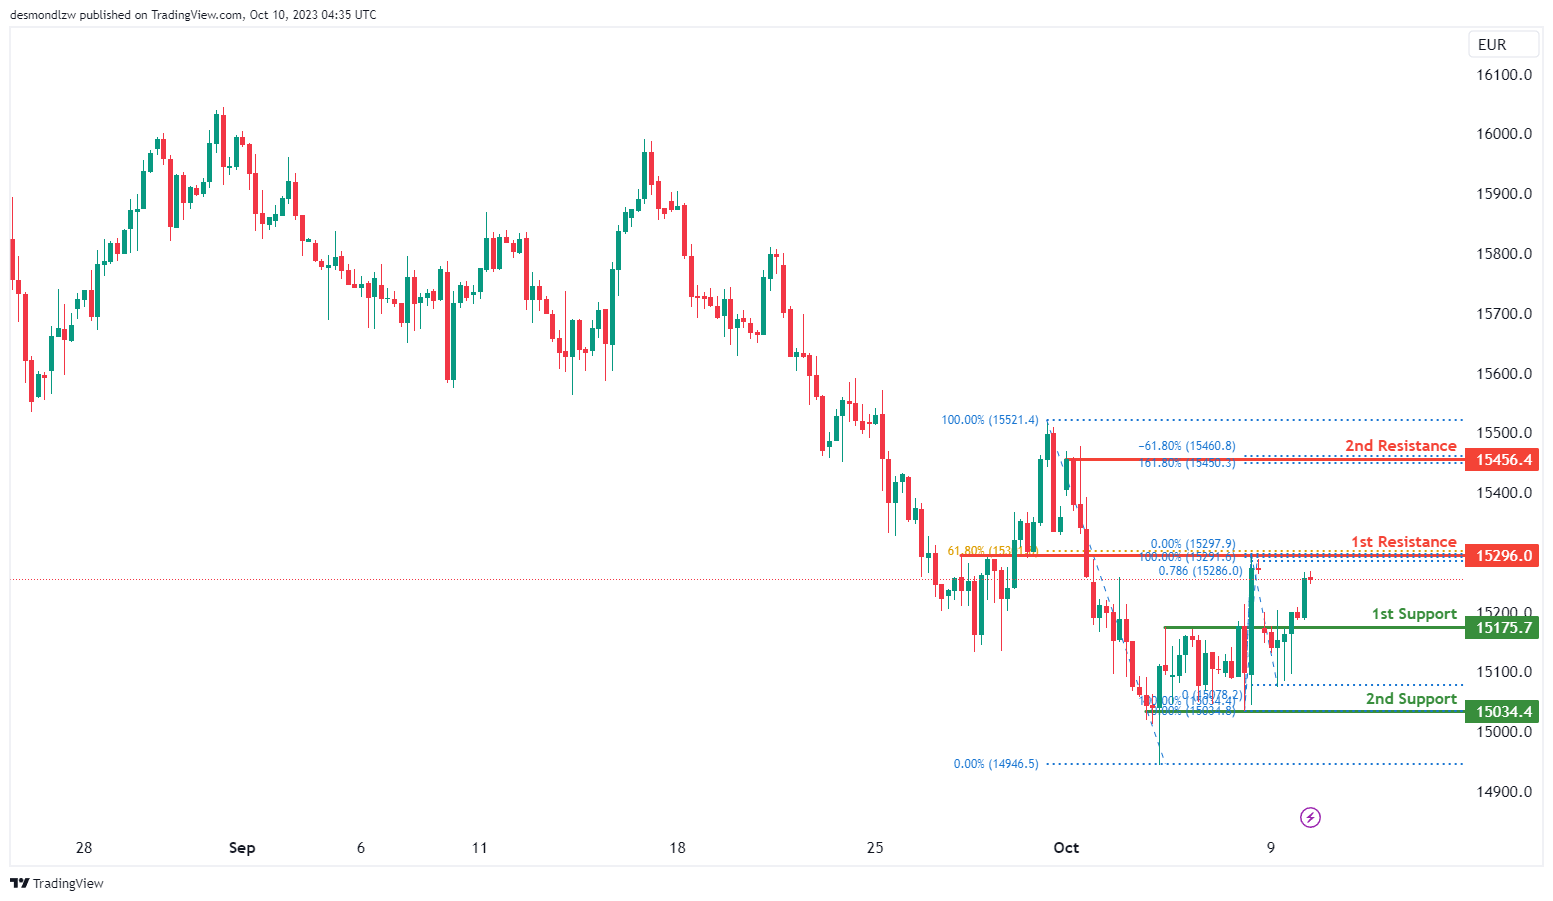
GER40:
The instrument we are examining is GER40, and the overall momentum of the chart indicates a bullish trend.
There is a possibility that the price may continue in a bullish direction, potentially reaching the first resistance level.
The first support level is at 15,175.70, and this support is considered strong due to its role as a pullback support.
The second support level is at 15,034.40, and it’s also significant as it represents a multi-swing low support.
On the resistance side, the first resistance level is at 15,296.00, and it’s noteworthy because it marks an overlap of resistance, a 61.80% Fibonacci Retracement, and a 78.60% Fibonacci Projection, indicating a Fibonacci confluence.
The second resistance level is at 15,456.40, and it’s significant as well, as it represents a swing high resistance and is associated with a -61.8% Fibonacci Expansion and a 161.80% Fibonacci Extension, indicating another Fibonacci confluence.
US500
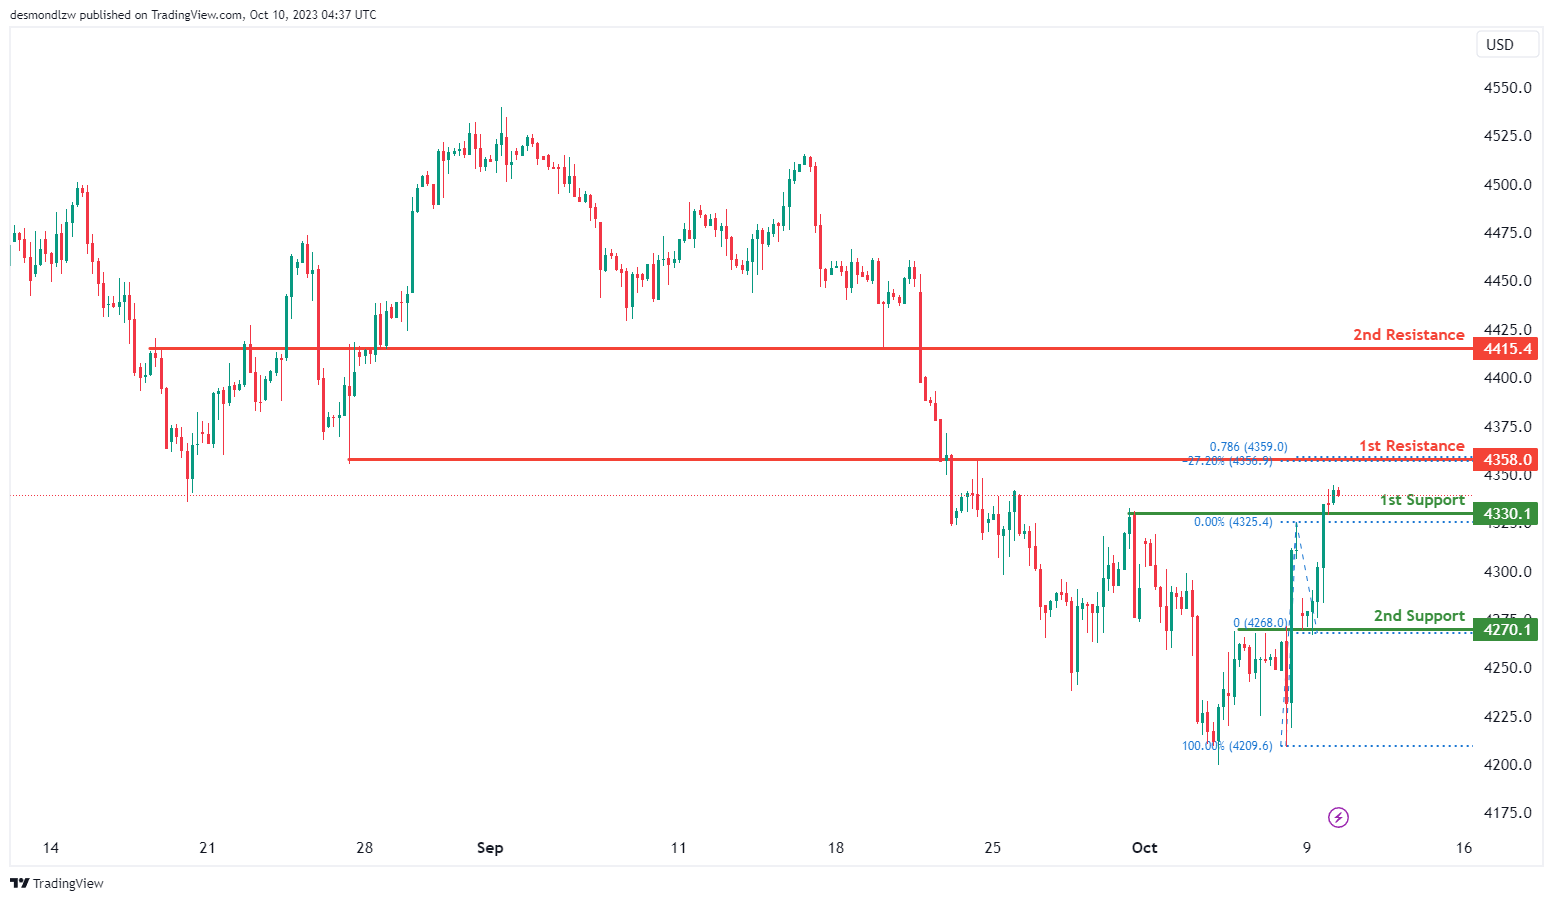
The instrument we are analyzing is US500, and the overall momentum of the chart indicates a bullish trend.
There is a possibility that the price may continue in a bullish direction, potentially reaching the first resistance level.
The first support level is at 4,330.1, and it’s considered strong because it represents an overlap of support.
The second support level is at 4,270.1, and it’s also significant as it marks another overlap of support.
On the resistance side, the first resistance level is at 4,358.0, and it’s noteworthy because it represents an overlap of resistance, a 78.60% Fibonacci Projection, and a -27% Fibonacci Expansion, indicating a Fibonacci confluence.
The second resistance level is at 4,415.4, and it’s significant as well, as it functions as a pullback resistance.
BTC/USD:
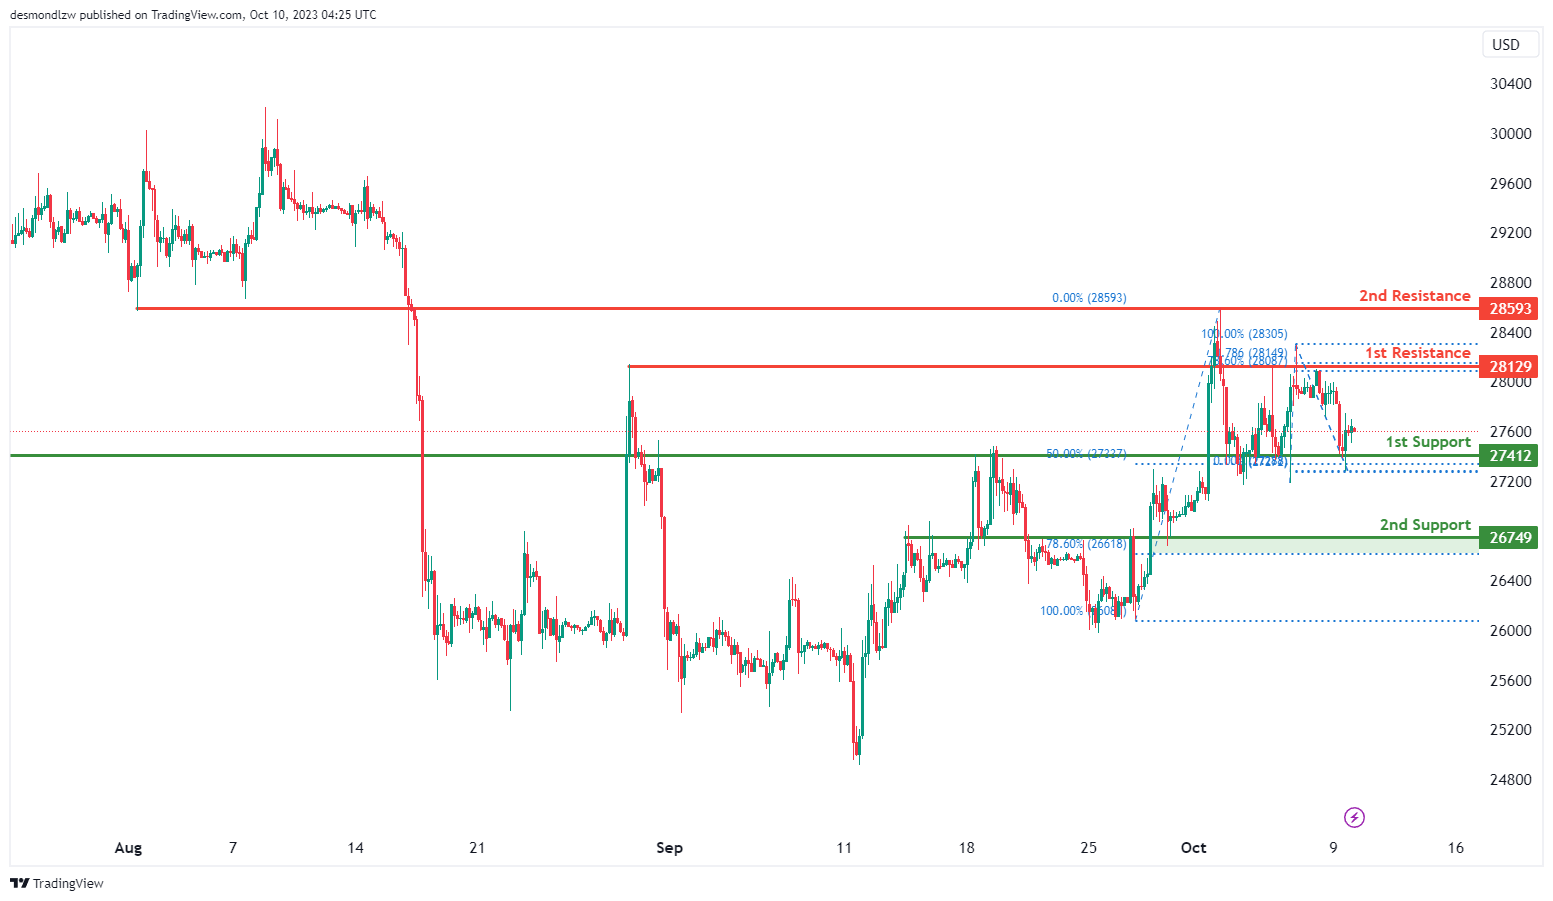
The instrument we’re looking at is BTC/USD, and the overall momentum of the chart appears to be bullish.
There is a possibility that the price could continue in a bullish direction, particularly towards the first resistance level.
The first support level is at 27,412, and this is considered a good support level due to an overlap of support and a 50% Fibonacci retracement.
The second support level is at 26,749, and it’s also considered a strong support because of an overlap of support and a 78.60% Fibonacci retracement.
On the resistance side, the first resistance level is at 28,129, and this is significant because there is an overlap of resistance, a 78.60% Fibonacci retracement, and a 78.60% Fibonacci projection, indicating a Fibonacci confluence.
The second resistance level is at 28,593 and is also noteworthy because it represents an overlap of resistance.
ETH/USD:
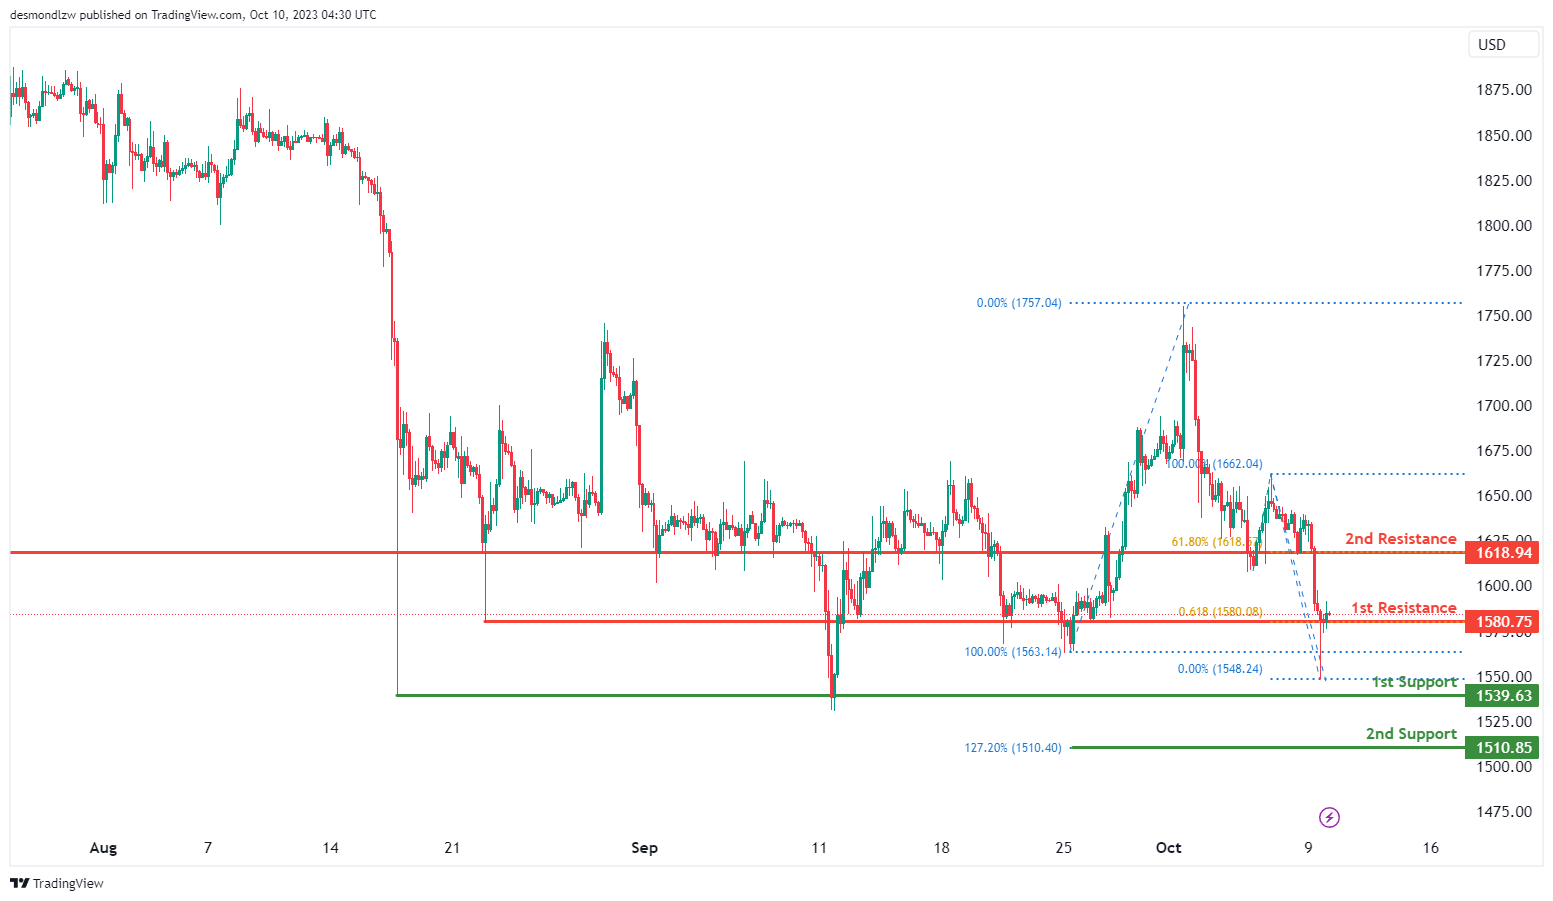
The instrument being analyzed is ETH/USD, and the overall momentum of the chart is currently bullish.
There is a possibility that the price could experience a bullish break through the first resistance and potentially rise to the second resistance level.
The first support level is at 1,539.63, and it’s considered a strong support due to its function as a pullback support.
The second support level is at 1,510.85, and it’s also notable because it aligns with the 127.20% Fibonacci Extension.
On the resistance side, the first resistance level is at 1,580.75, and it’s significant because it represents an overlap of resistance and is accompanied by a 61.80% Fibonacci Projection.
The second resistance level is at 1,618.94, and it’s noteworthy as well, as it functions as a pullback resistance and coincides with a 61.80% Fibonacci Retracement.
WTI/USD:
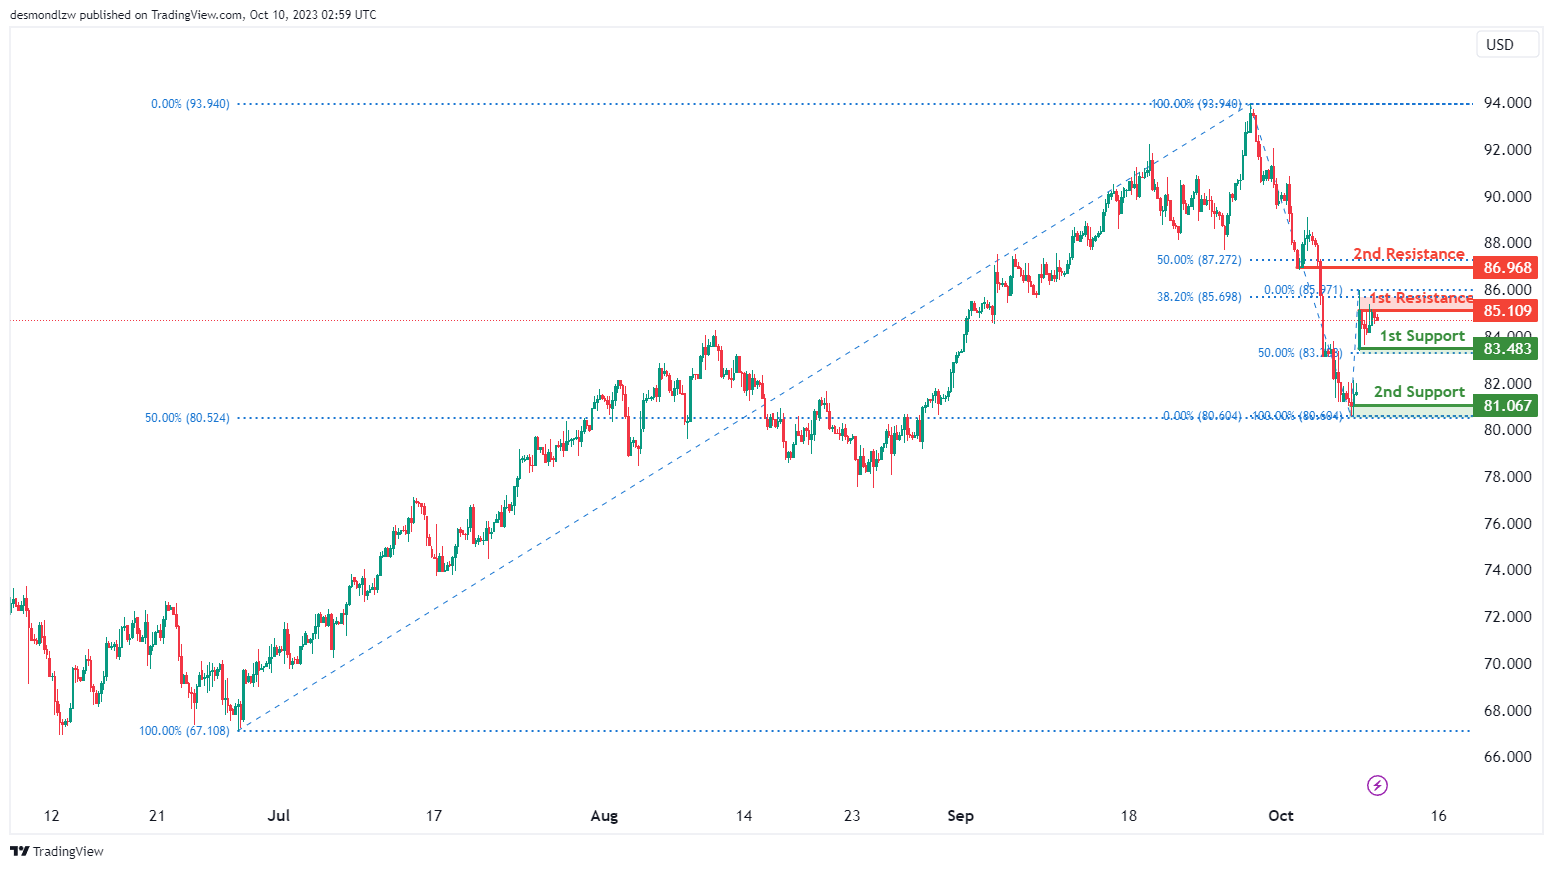
The WTI chart currently exhibits a neutral momentum with a potential scenario for price to fluctuate between the 1st resistance and the 1st support levels.
The 1st resistance level at 85.11 is identified as a pullback resistance that aligns close to the 38.20% Fibonacci retracement level. Higher up, the 2nd resistance level at 86.97 is also noted as a pullback resistance that aligns close to the 50.00% Fibonacci retracement level, potentially acting as a barrier to further upward movement.
To the downside, the 1st support level at 83.48 is identified as a pullback support that aligns with the 50.00% Fibonacci retracement level. Additionally, the 2nd support level at 81.07 is noted as a swing-low support, further reinforcing its significance as an area where price may find support.
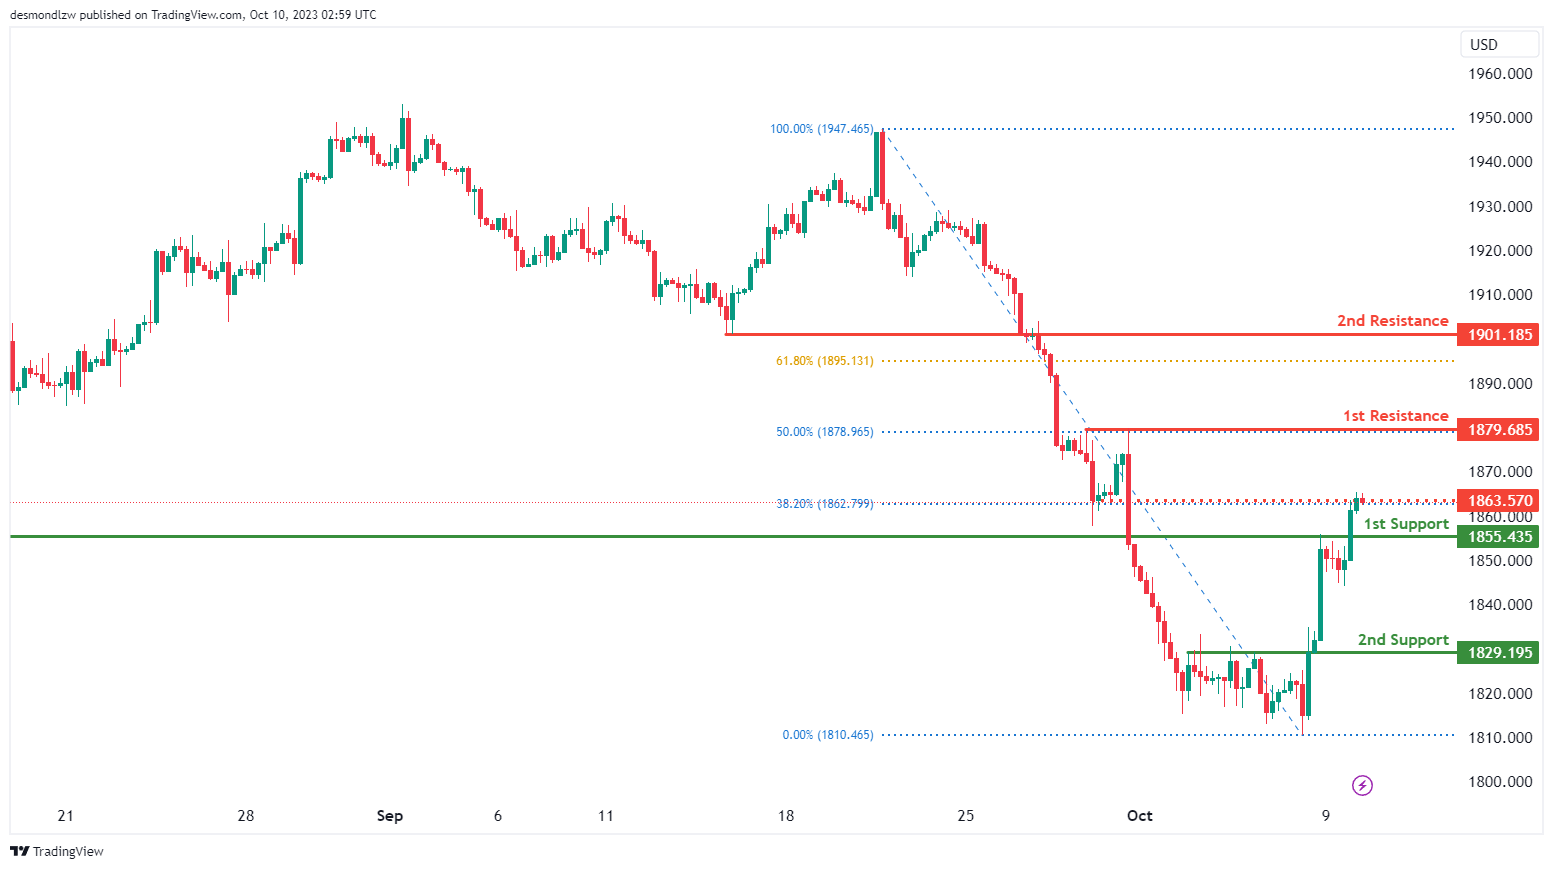
XAU/USD (GOLD):
The XAU/USD chart currently exhibits bullish momentum, with a potential scenario of a bullish continuation towards the 1st resistance level should price break above the intermediate resistance level.
The intermediate resistance level at 1863.57 is identified as a pullback resistance that aligns with the 38.20% Fibonacci retracement level while the 1st resistance level at 1879.69 is also noted as a pullback resistance that aligns with the 50.00% Fibonacci retracement level. Higher up, the 2nd resistance level at 1901.19 is identified as a pullback resistance that aligns close to the 61.80% Fibonacci retracement level, potentially acting as a barrier to further upward movement.
To the downside, the 1st support level at 1855.44 is identified as a pullback support. Additionally, the 2nd support level at 1829.19 is also marked as a pullback support, further reinforcing its significance as an area where price may find support.


