
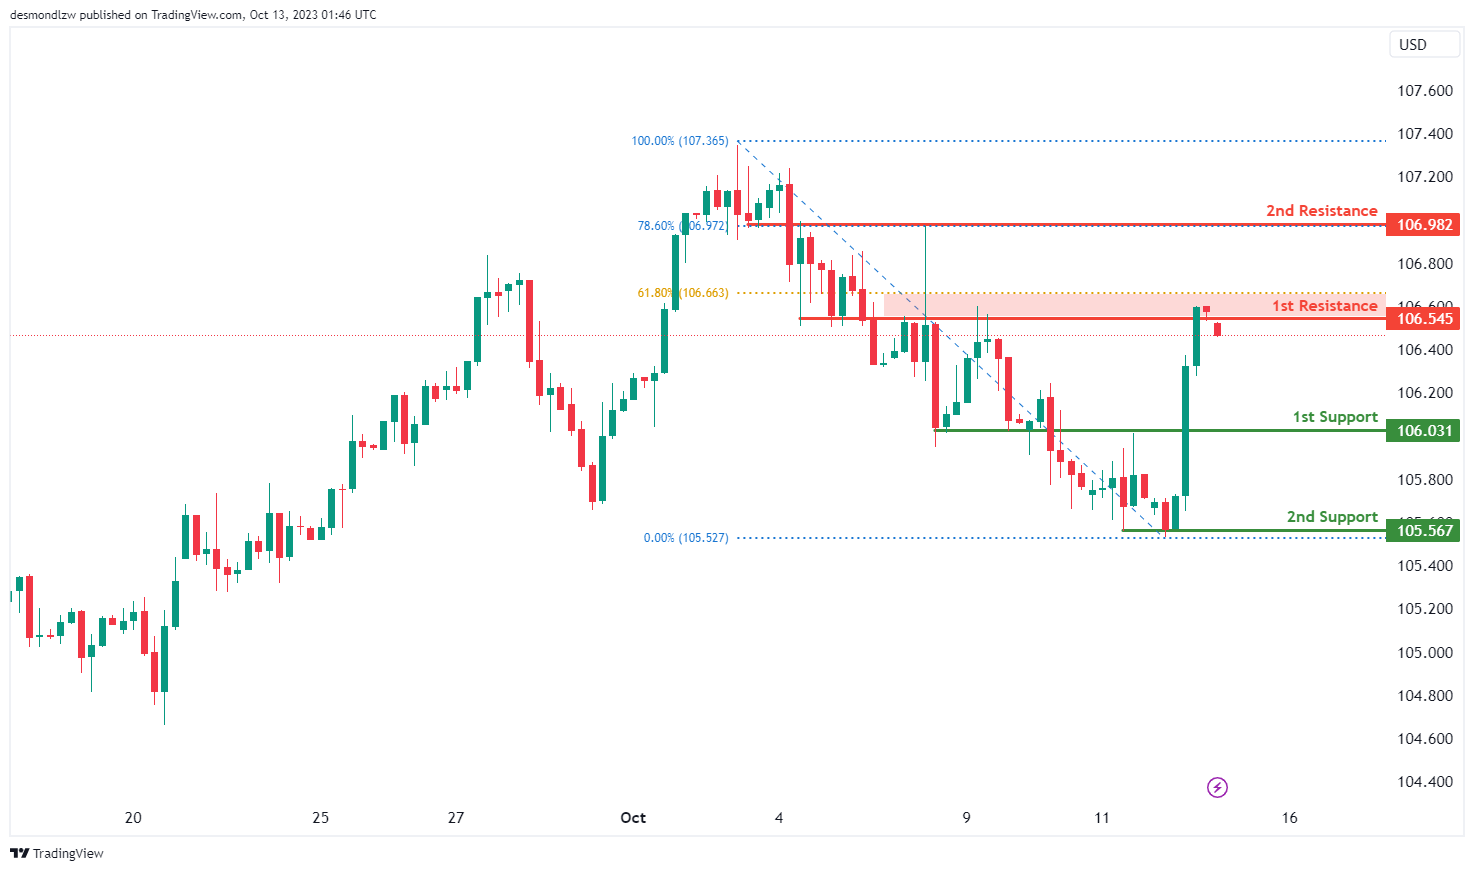
DXY:
The DXY chart currently exhibits a bearish overall momentum, suggesting the potential for a bearish continuation towards the 1st support level.
The 1st support at 106.03 is identified as a pullback support, signifying its historical relevance as a level where price has previously found buying interest. Additionally, the 2nd support at 105.56 serves as a swing low support, further reinforcing its potential significance in providing support to falling prices.
On the resistance side, the 1st resistance level at 106.54 is characterized as an overlap resistance. This level is notable for its historical role as a barrier to upward price movement. Furthermore, the 2nd resistance at 106.98 is another overlap resistance and coincides with the 78.60% Fibonacci Retracement level, indicating a potential area of strong resistance.
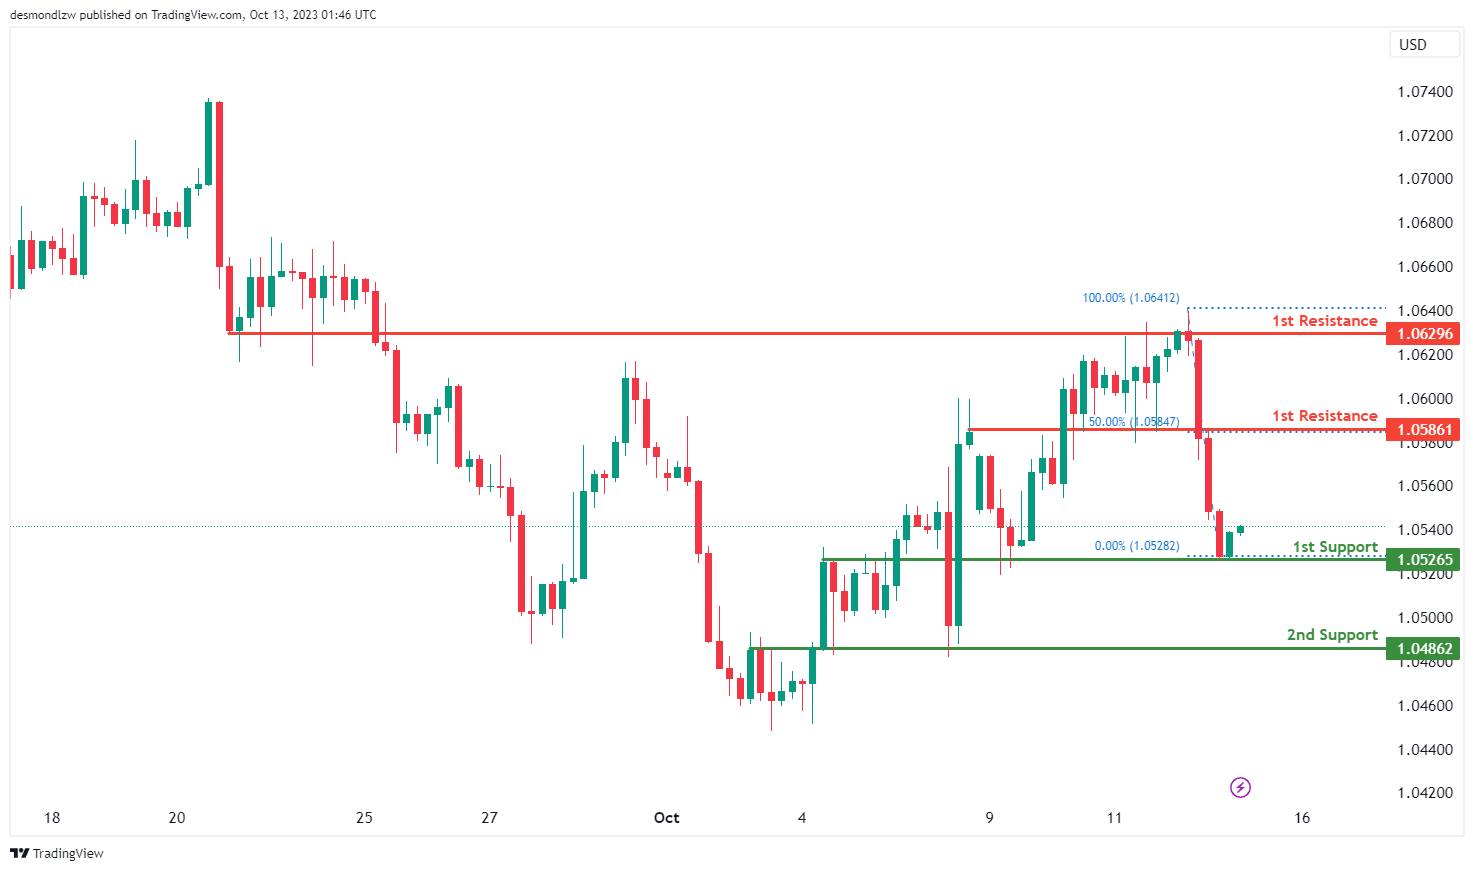
EUR/USD:
The EUR/USD chart is currently displaying a bullish overall momentum with the potential scenario of a bullish continuation towards the 1st resistance.
The 1st support at 1.0526 is characterized as an overlap support, signifying its historical significance as a level where buying interest has previously emerged. Adding to this support, the 2nd support at 1.0486 also serves as an overlap support, further reinforcing the potential for price support in this area.
On the resistance side, the 1st resistance level at 1.0586 is identified as an overlap resistance, which may act as a substantial barrier to further price advances. Additionally, the 2nd resistance at 1.0629 is another overlap resistance and aligns with the 50% Fibonacci Retracement level, making it an important level of potential resistance.
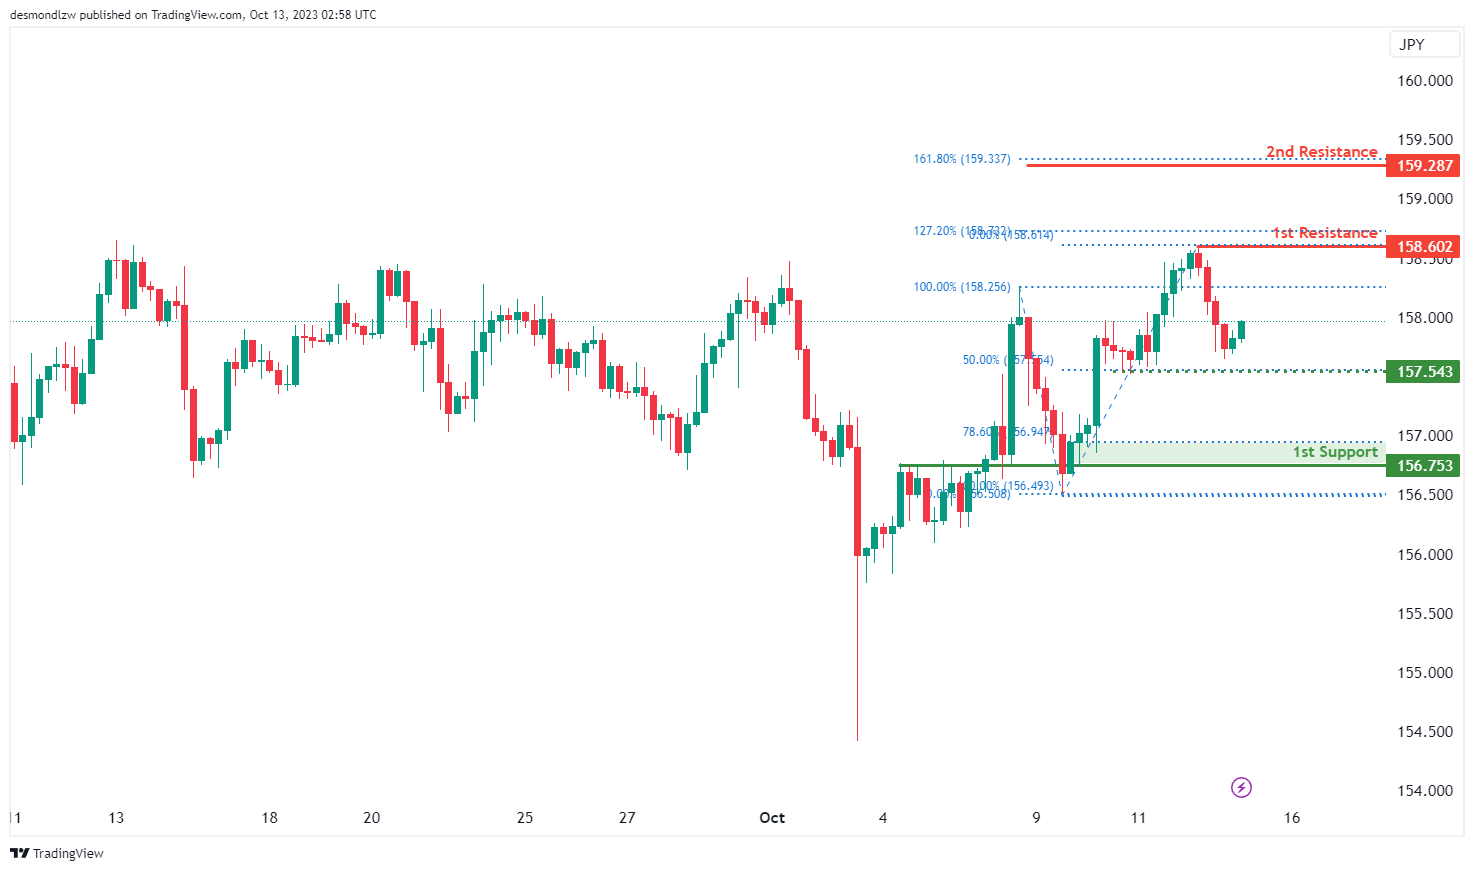
EUR/JPY:
The instrument we are analyzing is EUR/JPY, and the overall momentum of the chart suggests a bullish trend.
There is a possibility that the price may continue in a bullish direction, potentially reaching the resistance level.
The 1st support level is at 156.75, and it’s considered strong because it represents an overlap of support and aligns with a 78.60% Fibonacci Retracement.
There is also an intermediate support level at 157.54, which is significant due to its role as a multi-swing low support and aligning with a 50% Fibonacci Retracement.
On the resistance side, the 1st resistance level is at 158.60, and it’s noteworthy because it represents a swing high resistance and is accompanied by a 127.20% Fibonacci Extension.
The 2nd resistance level is at 159.28, and it’s significant as well, as it corresponds to a 161.80% Fibonacci Extension.
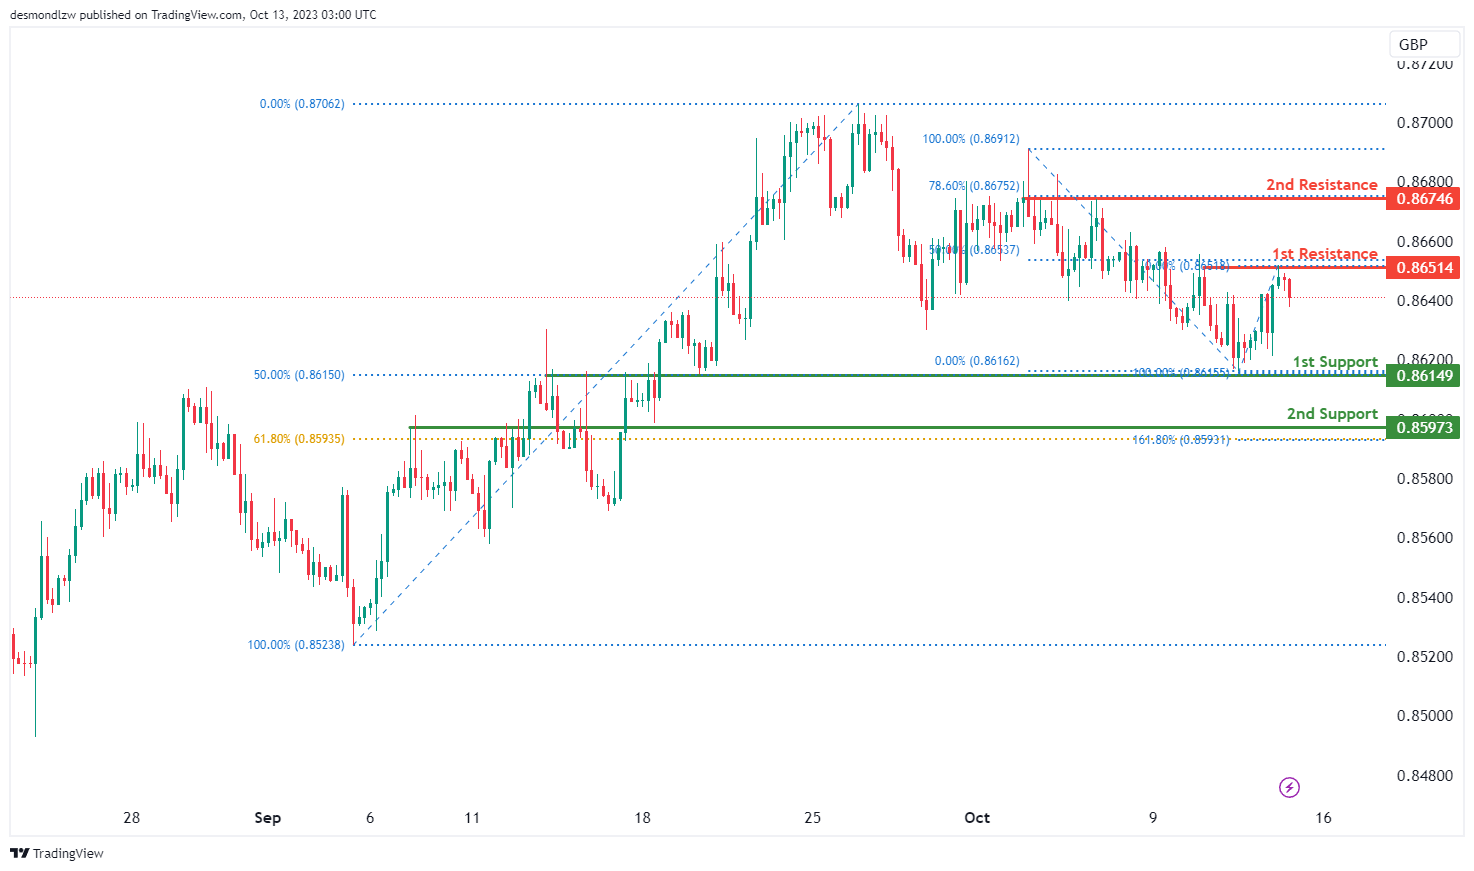
EUR/GBP:
The instrument we are examining is EUR/GBP, and the overall momentum of the chart indicates a bearish trend.
There is a possibility that the price may continue in a bearish direction, potentially reaching the support level.
The 1st support level is at 0.8614, and it’s considered strong because it represents an overlap of support and is associated with a 50% Fibonacci Retracement.
The 2nd support level is at 0.8597, and it’s also significant as it marks another overlap of support and coincides with a 61.80% Fibonacci Retracement and a 161.80% Fibonacci Extension, indicating a Fibonacci confluence.
On the resistance side, the 1st resistance level is at 0.8651, and it’s noteworthy because it represents a multi-swing high resistance and is accompanied by a 50% Fibonacci Retracement.
The 2nd resistance level is at 0.8674, and it’s significant as well, as it functions as a multi-swing high resistance and aligns with a 78.60% Fibonacci Retracement.
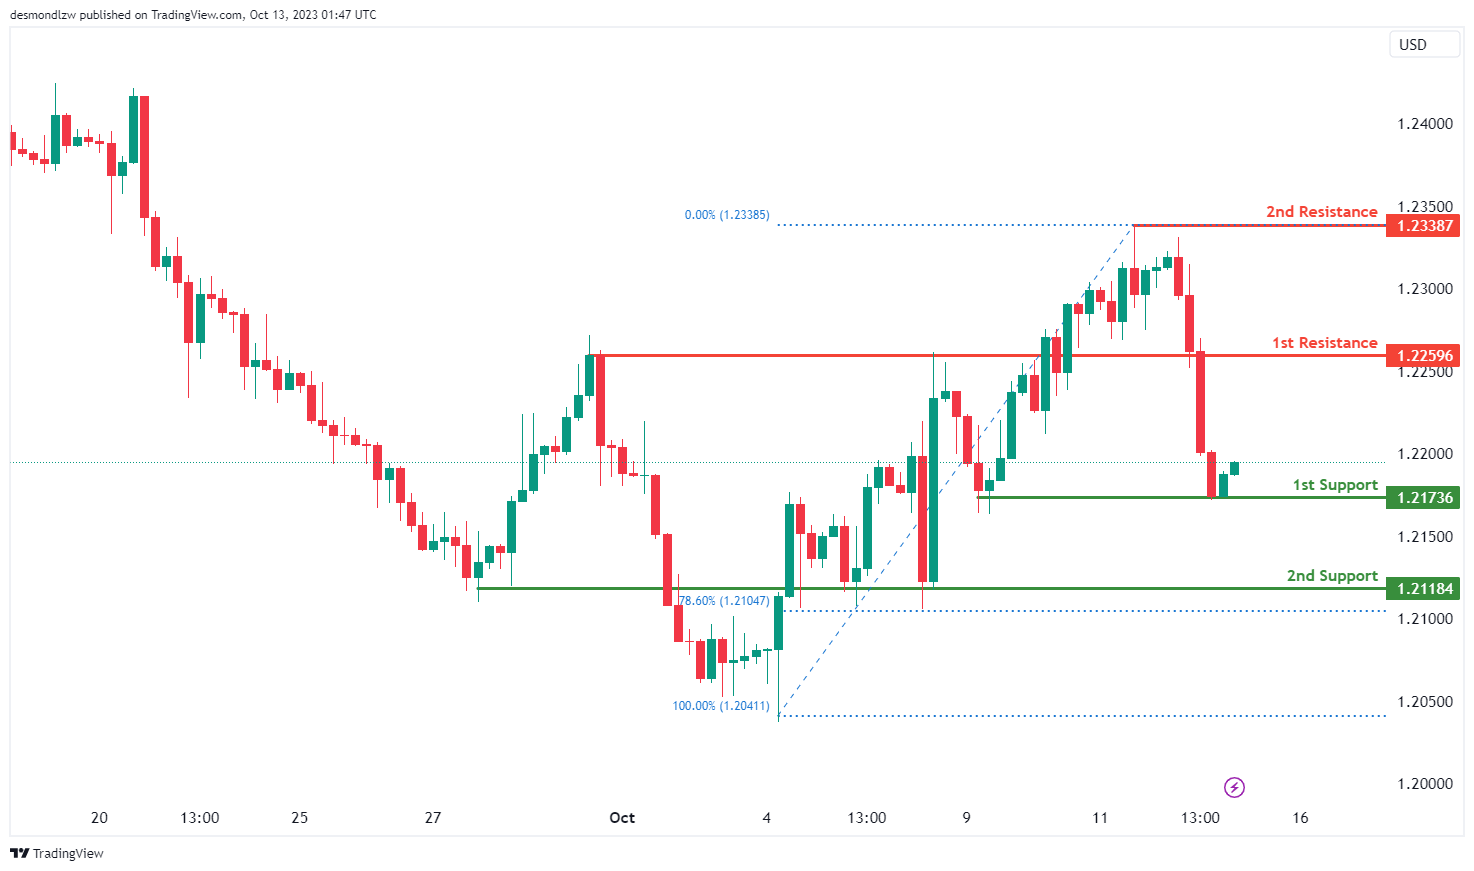
GBP/USD:
The GBP/USD chart currently maintains a bullish overall momentum, suggesting the potential for a bullish continuation towards the 1st resistance level.
The 1st support at 1.2173 is considered significant as it is identified as a multi-swing low support, indicating that it has previously acted as a level where buyers stepped in to support the price. Additionally, the 2nd support at 1.2118 holds significance as it coincides with the 78.60% Fibonacci Retracement level, further reinforcing its potential as a support level.
On the resistance side, the 1st resistance level at 1.2259 is characterized as a pullback resistance. This level is notable for its historical role as a barrier to upward price movement. Beyond this, the 2nd resistance at 1.2338 is identified as a swing high resistance, indicating a potential area where selling pressure may emerge.
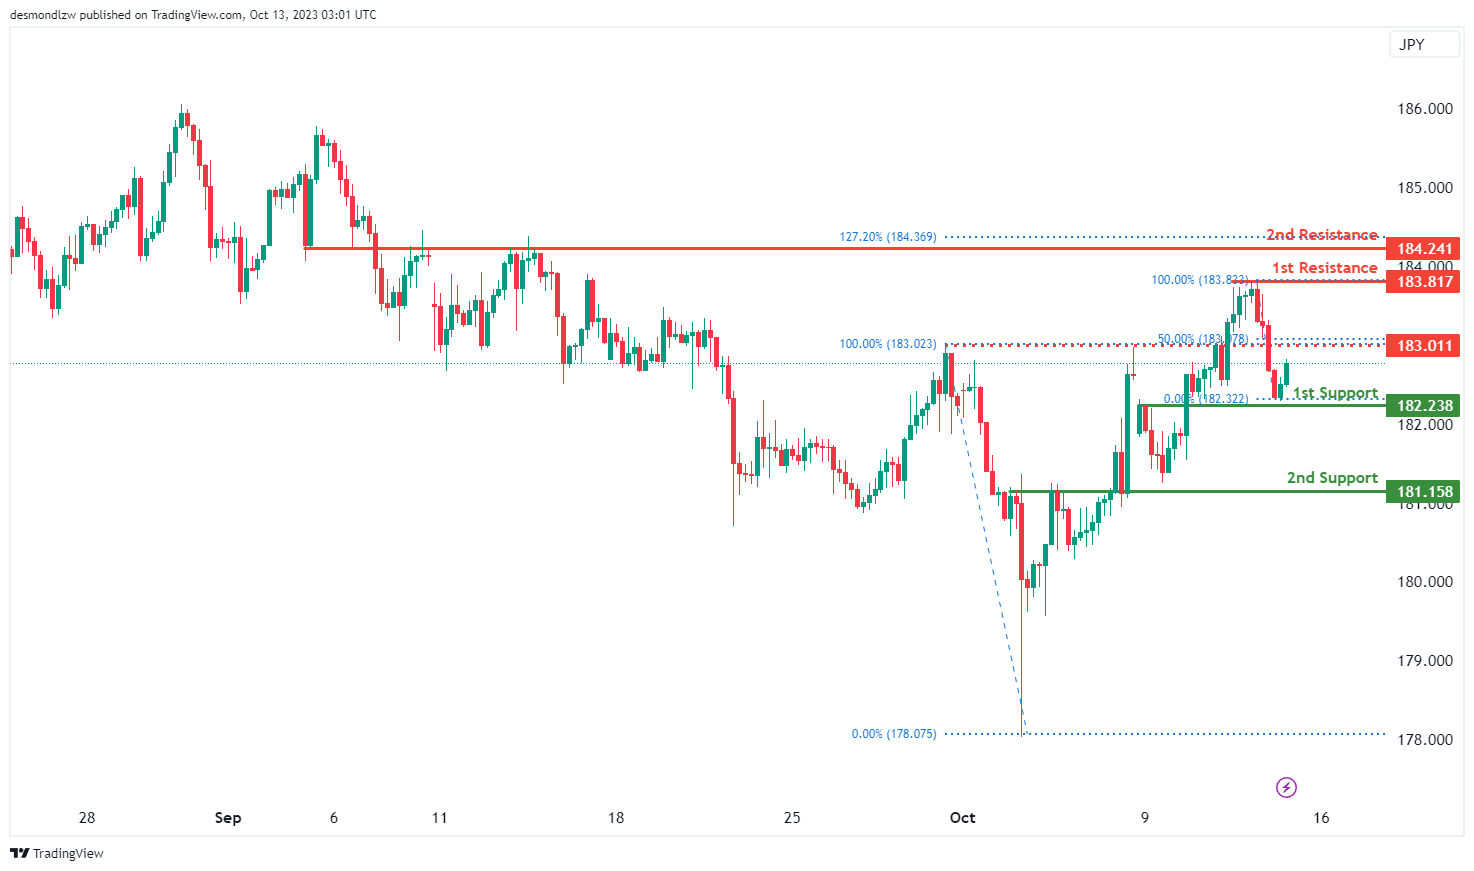
GBP/JPY:
The instrument we are analyzing is GBP/JPY, and the overall momentum of the chart indicates a bullish trend.
There is a possibility that the price may continue in a bullish direction, potentially reaching the resistance level.
The 1st support level is at 182.23, and it’s considered strong because it represents an overlap of support.
The 2nd support level is at 181.15, and it’s also significant as it marks another overlap of support.
On the resistance side, the 1st resistance level is at 183.81, and it’s noteworthy because it represents a multi-swing high resistance.
The 2nd resistance level is at 184.24, and it’s significant as well, as it functions as an overlap resistance and aligns with a 127.20% Fibonacci Extension.
There is also an intermediate resistance level at 183.01, and it’s considered strong because it represents a pullback resistance and coincides with a 50% Fibonacci Retracement.
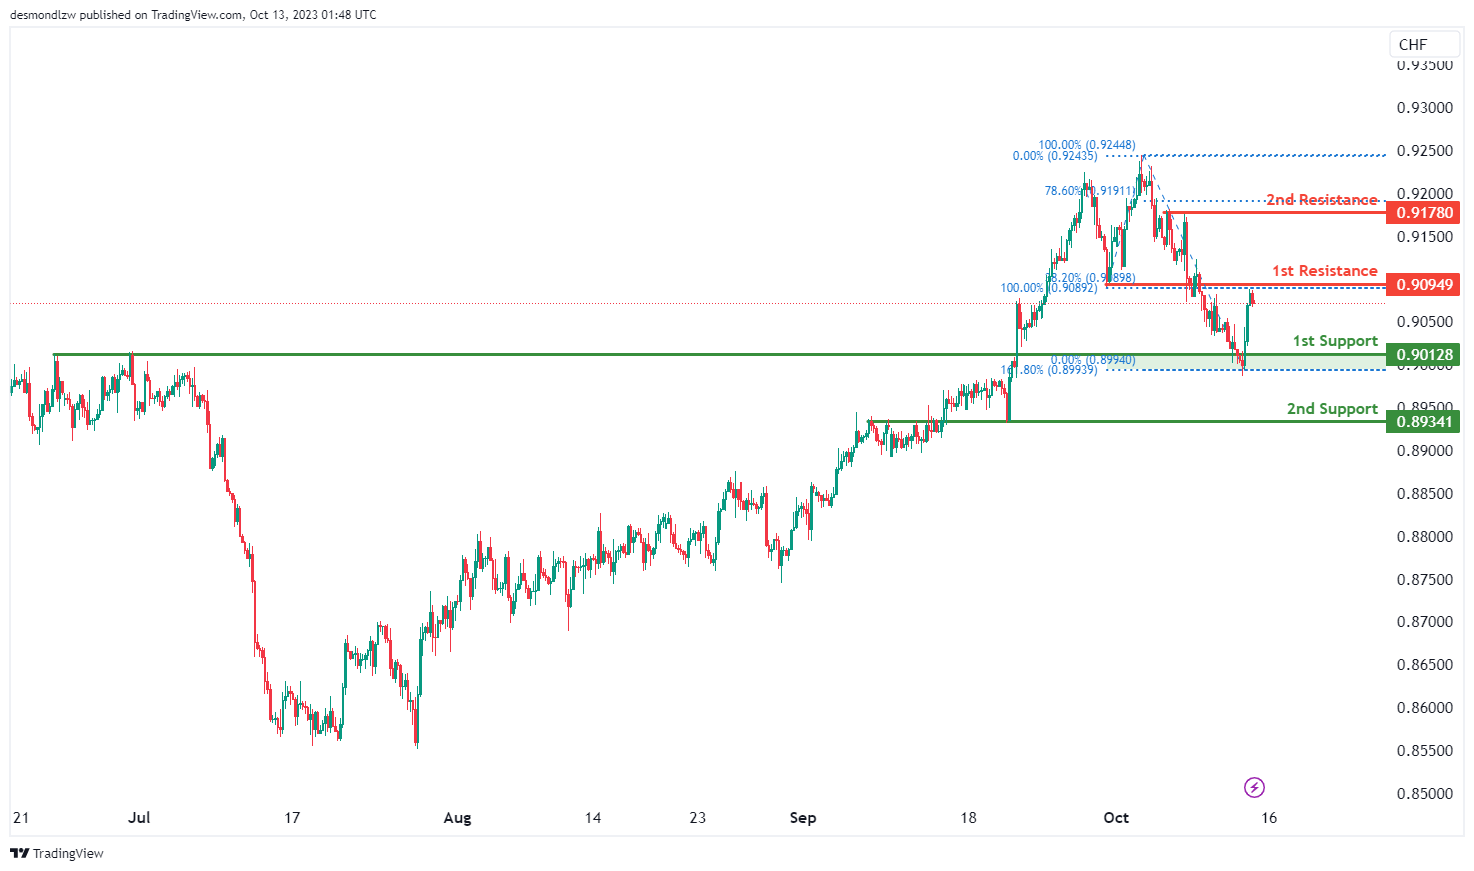
USD/CHF:
The USD/CHF chart currently exhibits a bearish overall momentum, suggesting the potential for a bearish reaction off the 1st resistance level with a subsequent drop towards the 1st support.
The 1st support at 0.9012 is considered significant as it is identified as an overlap support and coincides with the 161.80% Fibonacci Extension level. This level has the potential to act as a price floor, as it represents both historical support and a Fibonacci extension level.
The 2nd support at 0.8934 is also an overlap support level, further reinforcing its significance as a potential area where buyers might step in to support the price.
On the resistance side, the 1st resistance level at 0.9094 is characterized as an overlap resistance and coincides with the 38.20% Fibonacci Retracement level. This level is likely to pose a significant barrier to upward price movement. Beyond this, the 2nd resistance at 0.9178 is identified as a multi-swing high resistance, indicating a zone where selling pressure may intensify.
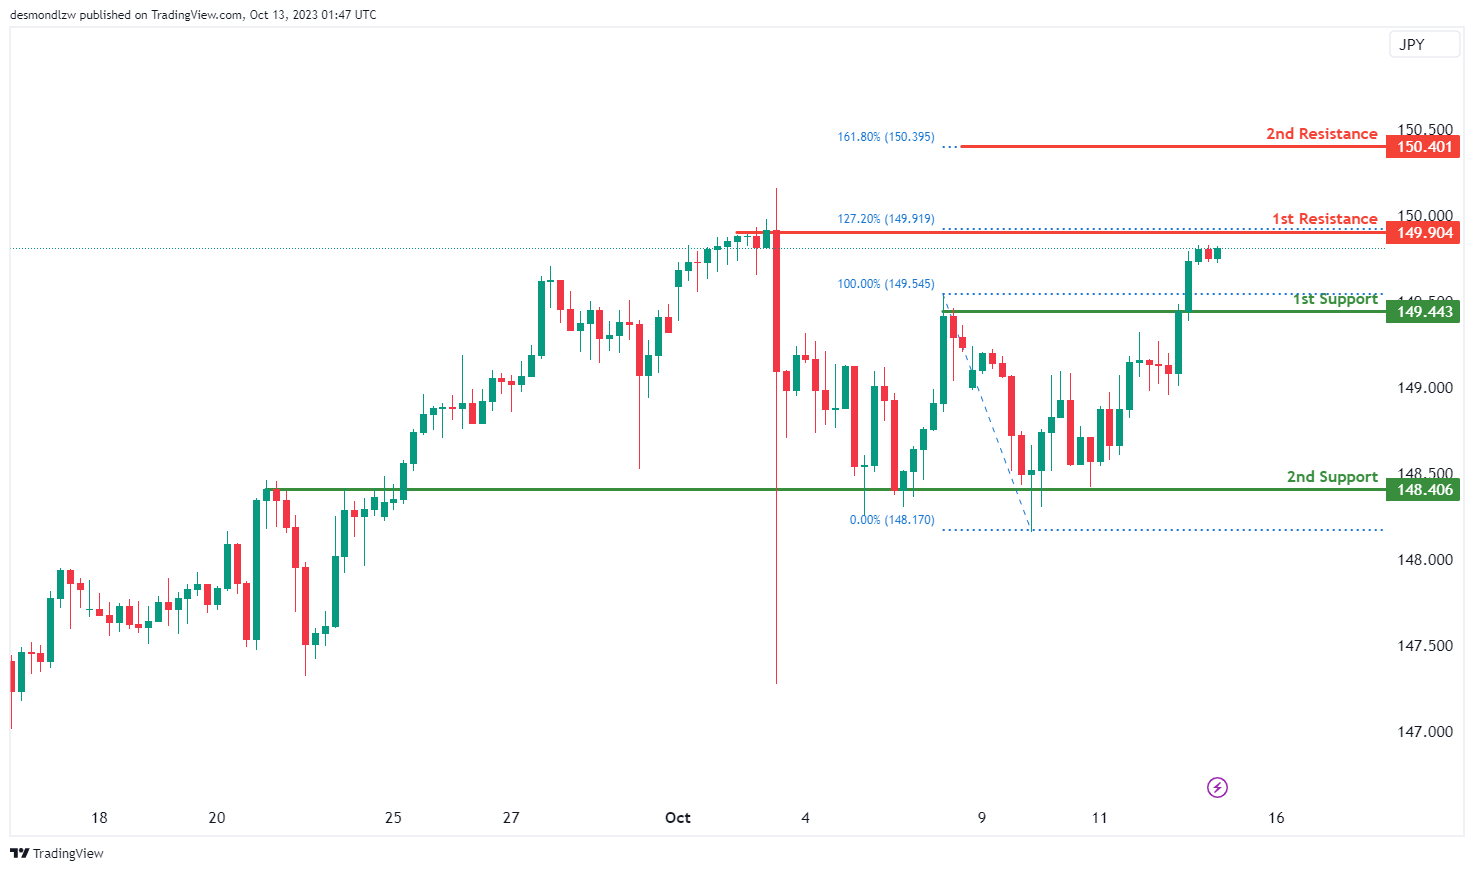
USD/JPY:
The USD/JPY chart currently reflects a bullish overall momentum, indicating the possibility of a bullish continuation towards the 1st resistance.
At 1st support, which stands at 149.44, we observe a substantial level of historical significance as a pullback support. This level has previously demonstrated its ability to provide support during pullback phases. The 2nd support, situated at 148.40, is equally noteworthy as an overlap support. Its presence reinforces the potential support zone and adds weight to its significance in price analysis.
On the resistance side, the 1st resistance level at 149.90 is notable due to its alignment with a multi-swing high resistance and the 127.20% Fibonacci Extension level. This convergence of resistance factors suggests that this level is likely to act as a formidable barrier to upward price movement. A breakthrough at this level could signal a bullish trend continuation.The 2nd resistance at 150.40 corresponds to the 161.80% Fibonacci Extension level, adding further confluence to this level as a critical resistance zone.
USD/CAD:
The USD/CAD chart is currently showing an overall bullish momentum with a potential scenario for price to make a bullish continuation towards the 1st resistance level.
The 1st resistance at 1.3692 is identified as an overlap resistance that aligns close to the 61.80% Fibonacci retracement level. Higher up, the 2nd resistance level at 1.3784 is marked as a swing-high resistance that aligns close to the 61.80% Fibonacci projection level, further emphasizing its significance as a barrier for future price increases.
To the downside, the 1st support level at 1.3578 is identified as a pullback support. Additionally, the 2nd support level at 1.3542 is also noted as a pullback support, further reinforcing its significance as an area where the price may find support.

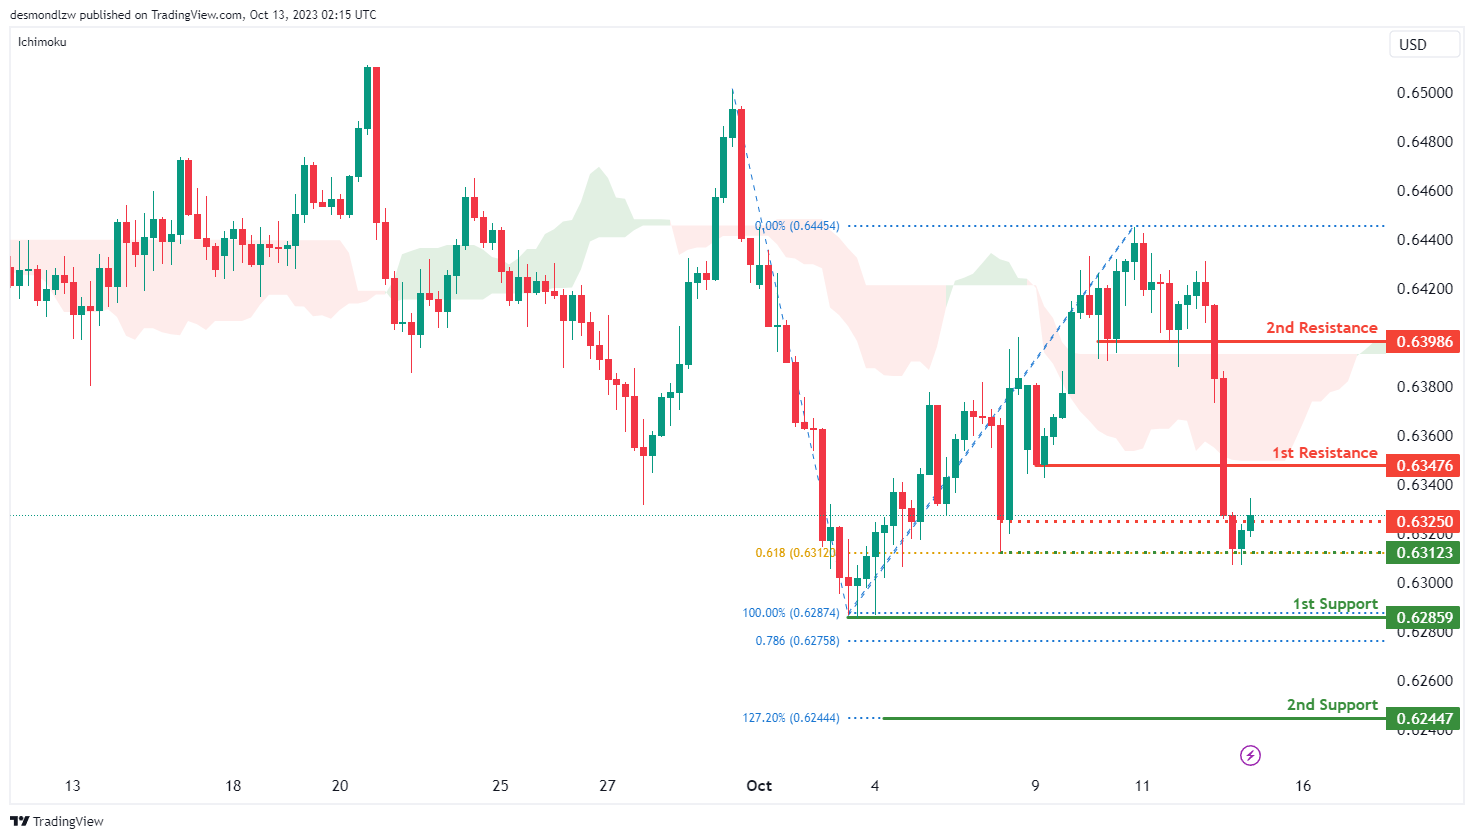
AUD/USD:
The AUD/USD chart currently exhibits an overall bearish momentum with a potential scenario for price to make a bearish continuation towards the 1st support level should price break below the intermediate support level.
The intermediate support level at 0.6312 is identified as a pullback support that aligns with the 61.80% Fibonacci projection level. The 1st support level at 0.6286 is noted as a swing-low support that aligns close to the 78.60% Fibonacci projection level. Further below, the 2nd support level at 0.6245 is marked as a support level that aligns with the 127.20% Fibonacci extension level, reinforcing its importance as a potential support level.
To the upside, the intermediate resistance level at 0.6325 is identified as a pullback resistance. The 1st resistance level at 0.6348 is also noted as a pullback resistance. Additionally, the 2nd resistance level at 0.6399 is marked as another pullback resistance, further emphasizing its significance as a barrier for future price increases.
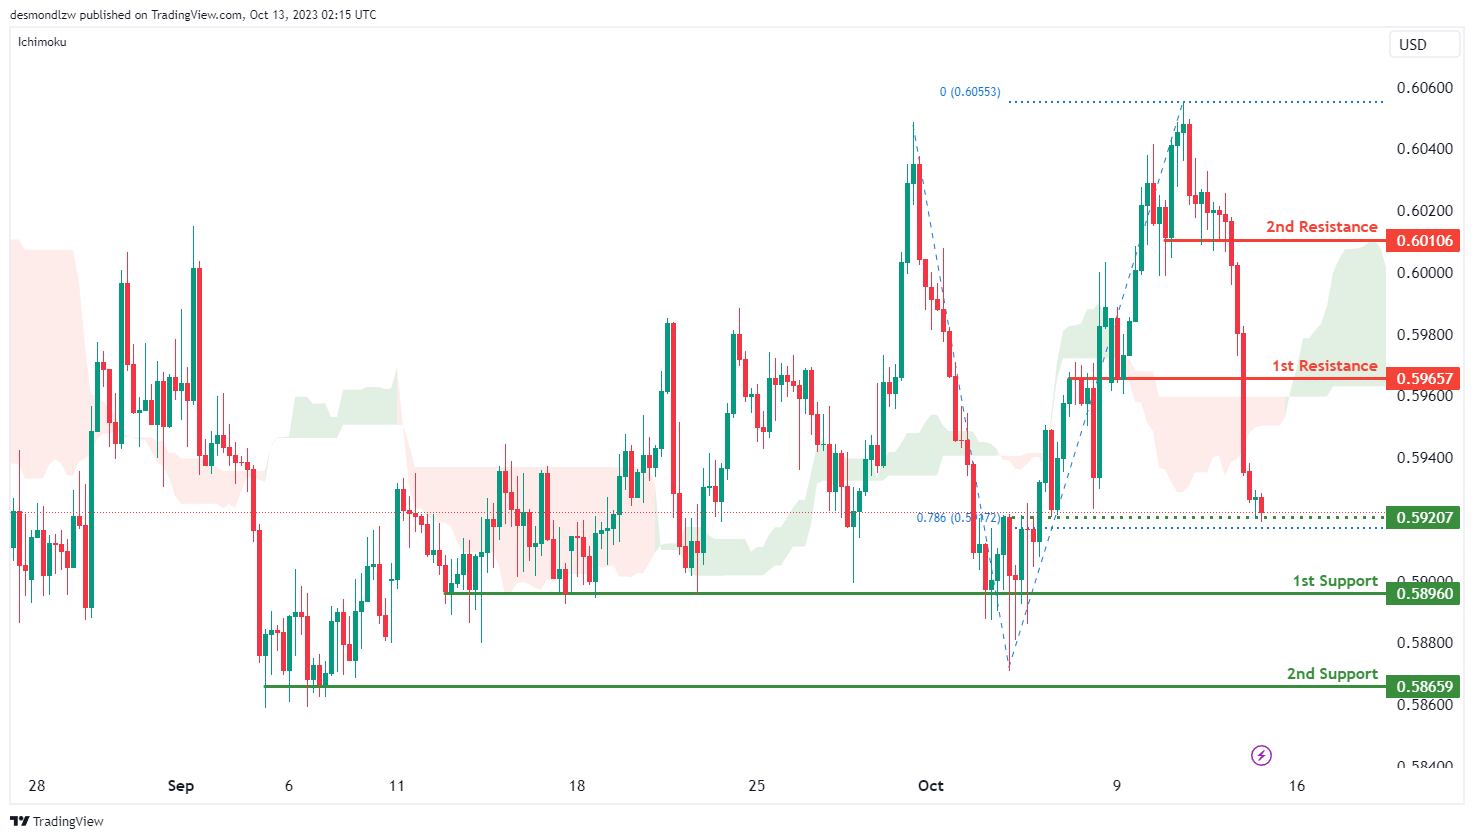
NZD/USD
The NZD/USD chart currently exhibits an overall bearish momentum with a potential scenario for price to make a bearish continuation towards the 1st support level should price break below the intermediate support level.
The intermediate support level at 0.5921 is identified as a pullback support that aligns with the 78.60% Fibonacci projection level. The 1st support level at 0.5896 is also noted as a pullback support. Further below, the 2nd support level at 0.5866 is marked as another pullback support, further reinforcing its significance as an area where price may find support.
To the upside, the 1st resistance level at 0.5966 is identified as an overlap resistance. Additionally, the 2nd resistance level at 0.6011 is marked as a pullback resistance, further emphasizing its significance as a barrier for future price increases.
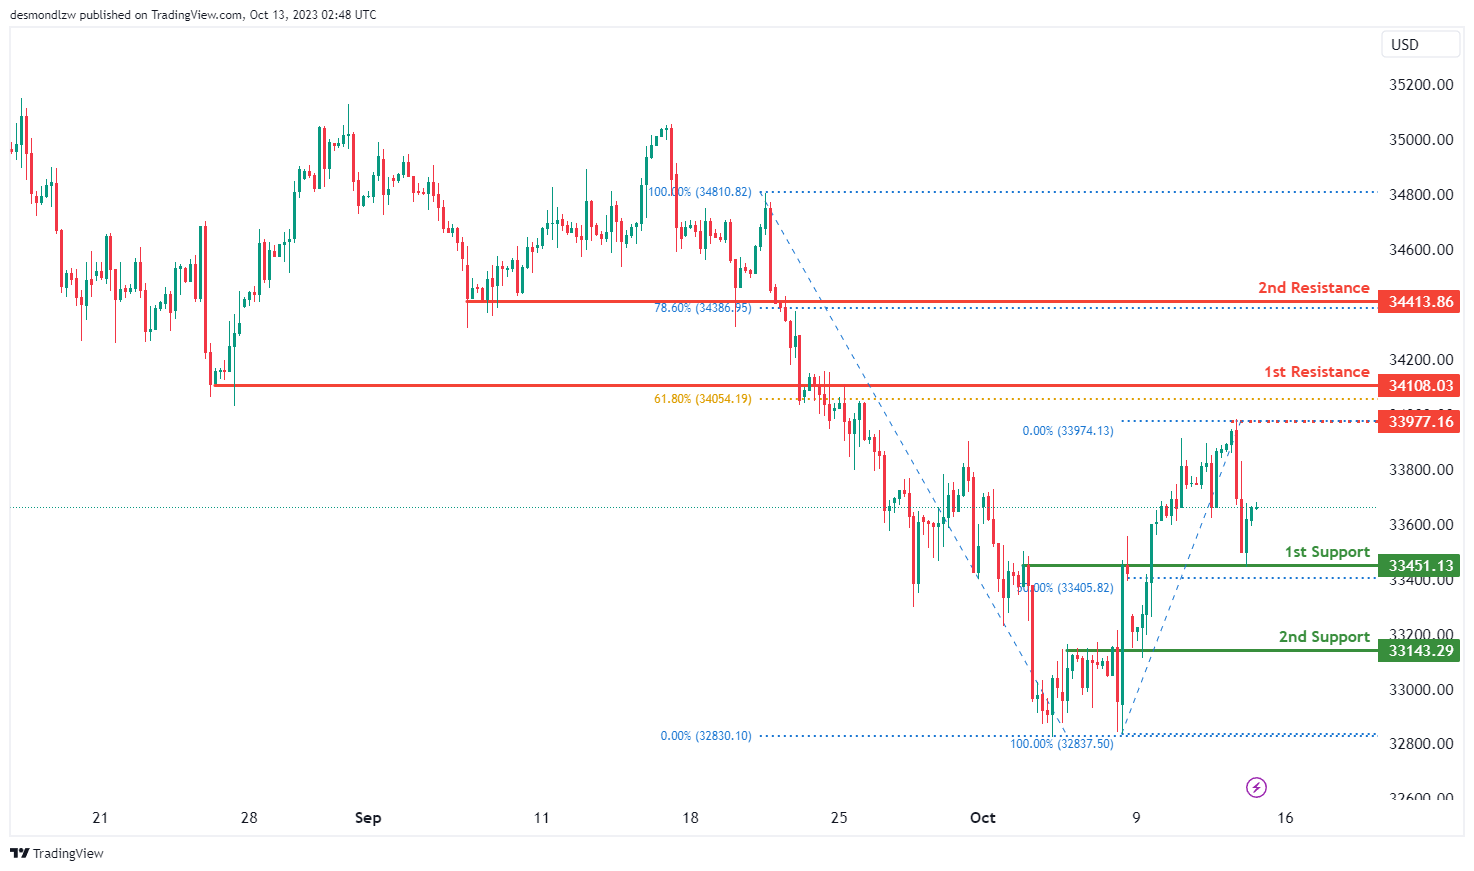
DJ30:
The instrument being analyzed is DJ30, and the overall momentum of the chart indicates a bullish trend.
There is a possibility that the price may continue in a bullish direction, potentially reaching the resistance level.
The 1st support level is at 33,451.13, and it’s considered strong because it represents an overlap of support and aligns with a 50% Fibonacci Retracement.
The 2nd support level is at 33,143.29, and it’s also significant as it marks another overlap of support.
On the resistance side, the 1st resistance level is at 34,108.03, and it’s noteworthy because it represents an overlap of resistance and is accompanied by a 61.80% Fibonacci Retracement.
The 2nd resistance level is at 34,413.86, and it’s significant as well, as it functions as a pullback resistance and coincides with a 78.60% Fibonacci Retracement.
There is also an intermediate resistance level at 33,977.16, and it’s considered strong because it represents a swing high resistance.
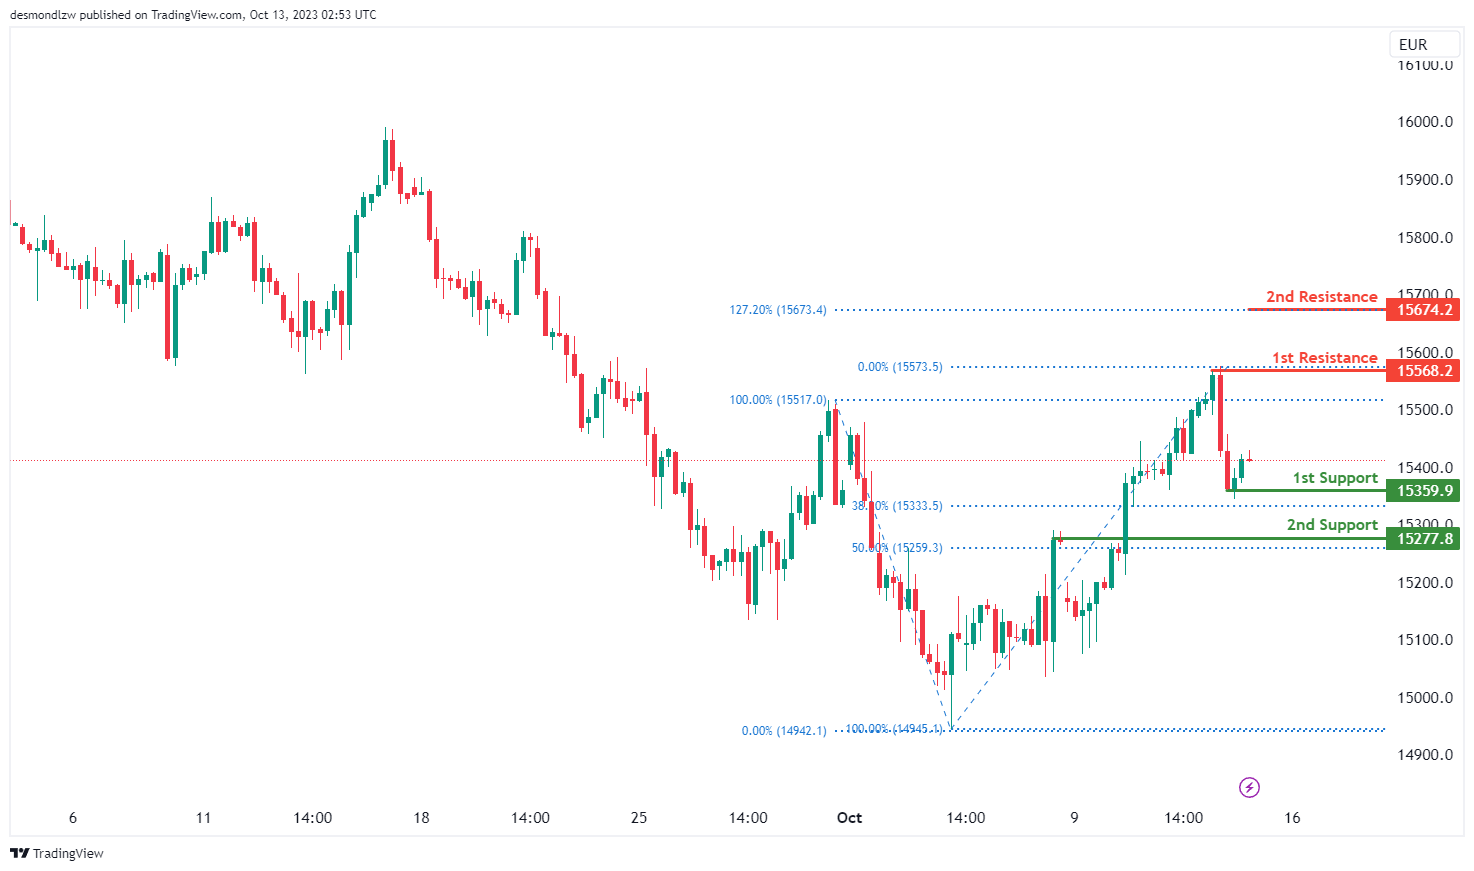
GER40:
The instrument we are analyzing is GER40, and the overall momentum of the chart indicates a bullish trend.
There is a possibility that the price may continue in a bullish direction, potentially reaching the resistance level.
The 1st support level is at 15,359.90, and it’s considered strong because it represents a swing low support and aligns with a 38.20% Fibonacci Retracement.
The 2nd support level is at 15,277.80, and it’s also significant as it marks a pullback support and corresponds to a 50% Fibonacci Retracement.
On the resistance side, the 1st resistance level is at 15,568.20, and it’s noteworthy because it represents a swing high resistance.
The 2nd resistance level is at 15,674.20, and it’s significant as well, as it corresponds to a 127.20% Fibonacci Extension.
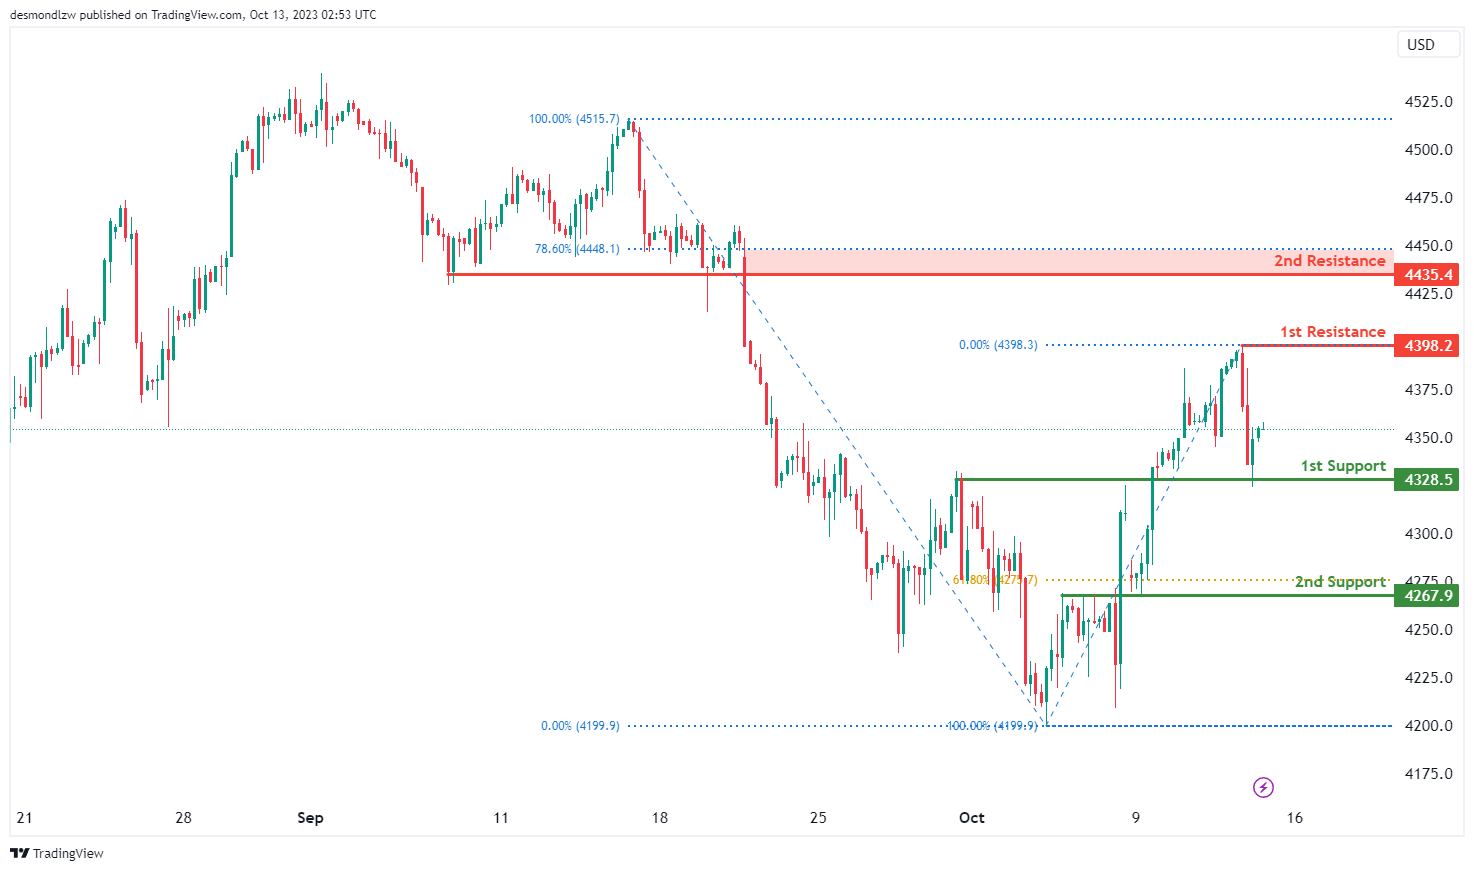
US500
The instrument we are examining is US500, and the overall momentum of the chart indicates a bullish trend.
There is a possibility that the price may continue in a bullish direction, potentially reaching the resistance level.
The 1st support level is at 4,328.5, and it’s considered strong because it represents an overlap of support.
The 2nd support level is at 4,267.9, and it’s also significant as it marks another overlap of support and aligns with a 61.80% Fibonacci Retracement.
On the resistance side, the 1st resistance level is at 4,398.2, and it’s noteworthy because it represents a swing high resistance.
The 2nd resistance level is at 4,435.4, and it’s significant as well, as it functions as a pullback resistance and coincides with a 78.60% Fibonacci Retracement.
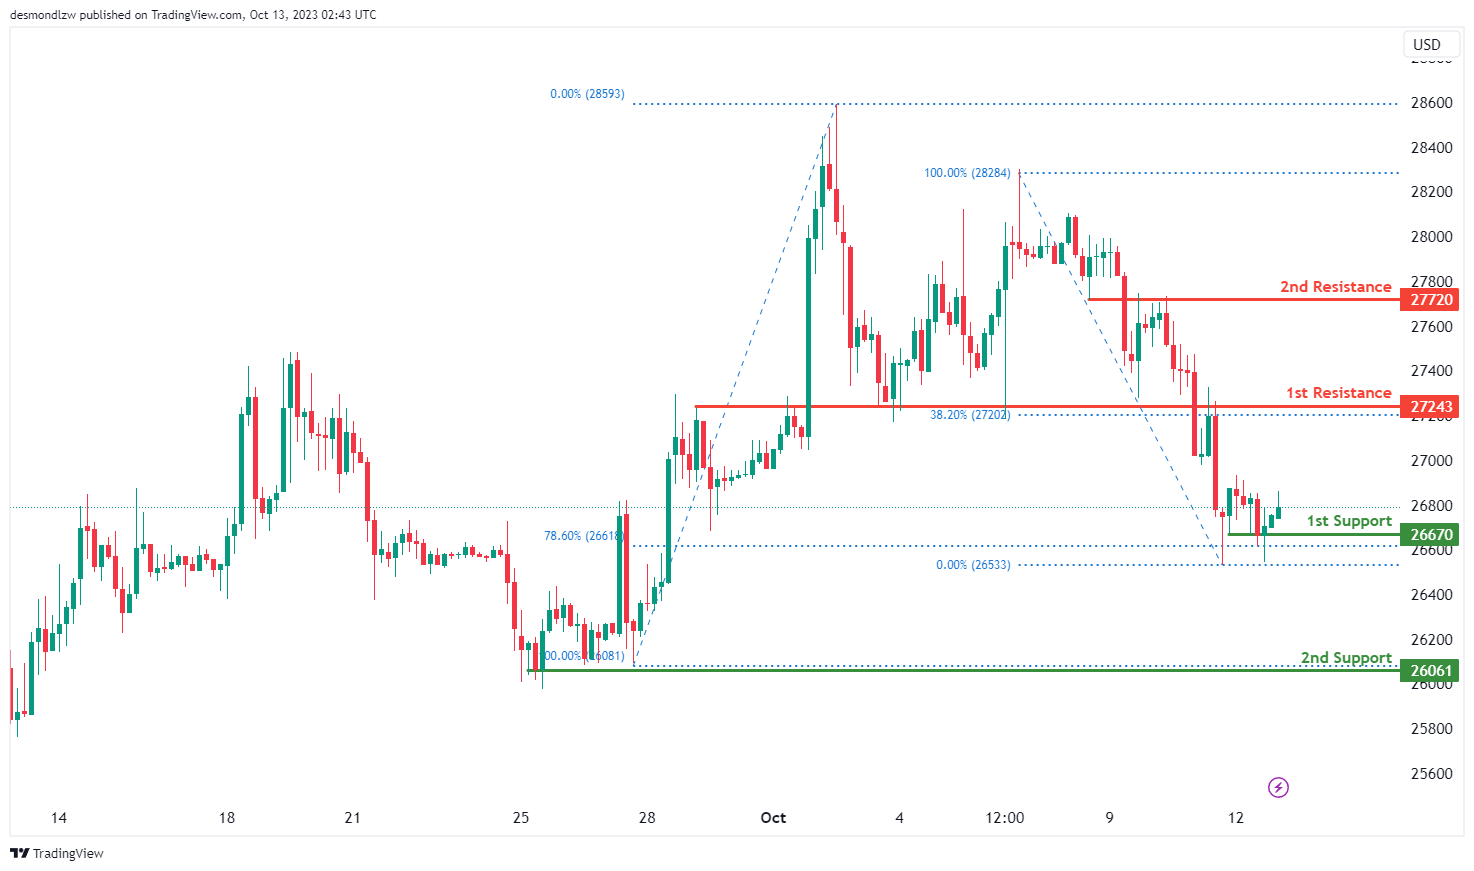
BTC/USD:
The instrument we are examining is BTC/USD, and the overall momentum of the chart indicates a bullish trend.
There is a possibility that the price may continue in a bullish direction, potentially reaching the resistance level.
The 1st support level is at 26,670, and it’s considered strong because it represents a multi-swing low support and aligns with a 78.60% Fibonacci Retracement.
The 2nd support level is at 26,061, and it’s also significant as it marks another multi-swing low support.
On the resistance side, the 1st resistance level is at 27,243, and it’s noteworthy because it represents an overlap of resistance and is accompanied by a 38.20% Fibonacci Retracement.
The 2nd resistance level is at 27,720, and it’s significant as well, as it functions as an overlap resistance.
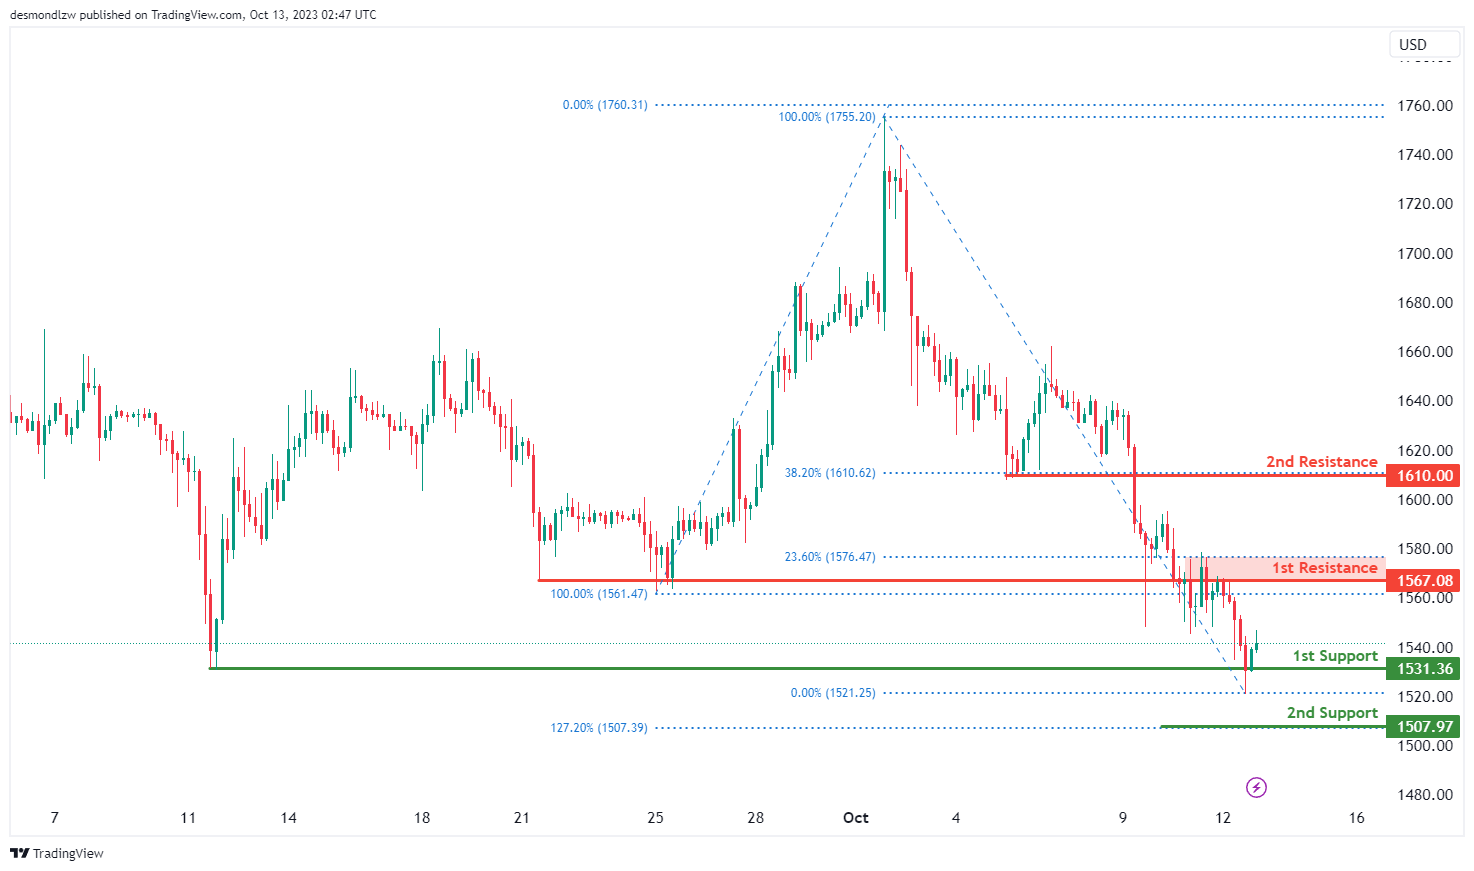
ETH/USD:
The instrument under consideration is ETH/USD, and the overall momentum of the chart indicates a bullish trend.
There is a possibility that the price may continue in a bullish direction, potentially reaching the resistance level.
The 1st support level is at 1,531.36, and it’s considered strong because it represents a multi-swing low support.
The 2nd support level is at 1,507.97, and it’s also significant as it aligns with the 127.20% Fibonacci Extension.
On the resistance side, the 1st resistance level is at 1,567.08, and it’s noteworthy because it represents an overlap of resistance and is accompanied by a 23.60% Fibonacci Retracement.
The 2nd resistance level is at 1,610.00, and it’s significant as well, as it functions as a pullback resistance and coincides with a 38.20% Fibonacci Retracement.
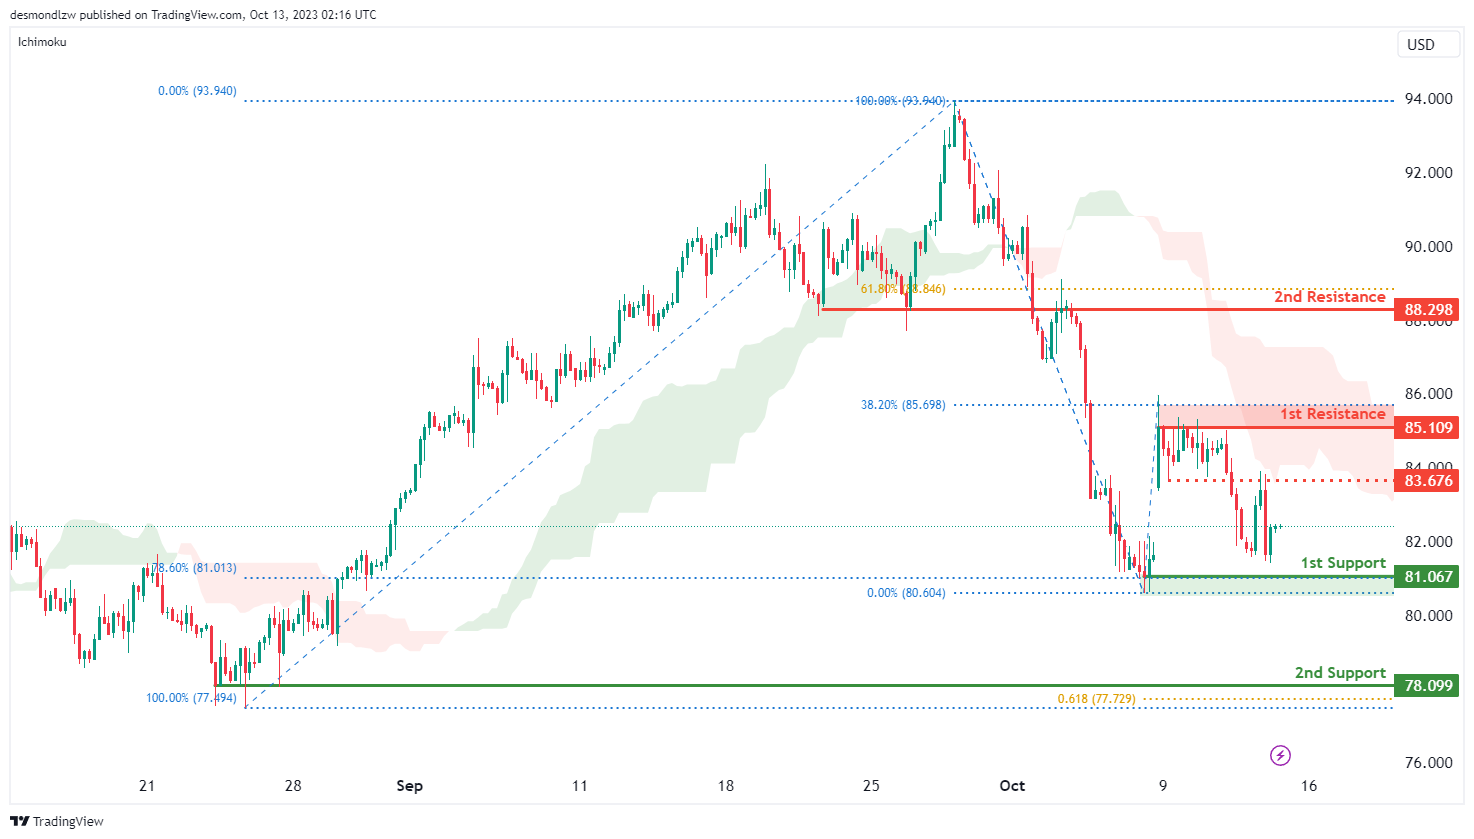
WTI/USD:
The WTI chart currently exhibits an overall bearish momentum with price trading under the bearish Ichimoku cloud. There is a potential scenario for price to make a bearish continuation towards the 1st support level.
The 1st support level at 81.07 is identified as a pullback support that aligns with the 78.60% Fibonacci retracement level. Additionally, the 2nd support level at 78.09 is also noted as pullback support that aligns close to the 61.80% Fibonacci projection level, further reinforcing its significance as an area where price may find support.
To the upside, the intermediate resistance level at 85.11 is identified as an overlap resistance. The 1st resistance level at 85.11 is noted as a pullback resistance that aligns close to the 38.20% Fibonacci retracement level. Higher up, the 2nd resistance level at 88.29 is marked as an overlap resistance that aligns close to the 61.80% Fibonacci retracement level, potentially acting as a barrier to further upward movement.
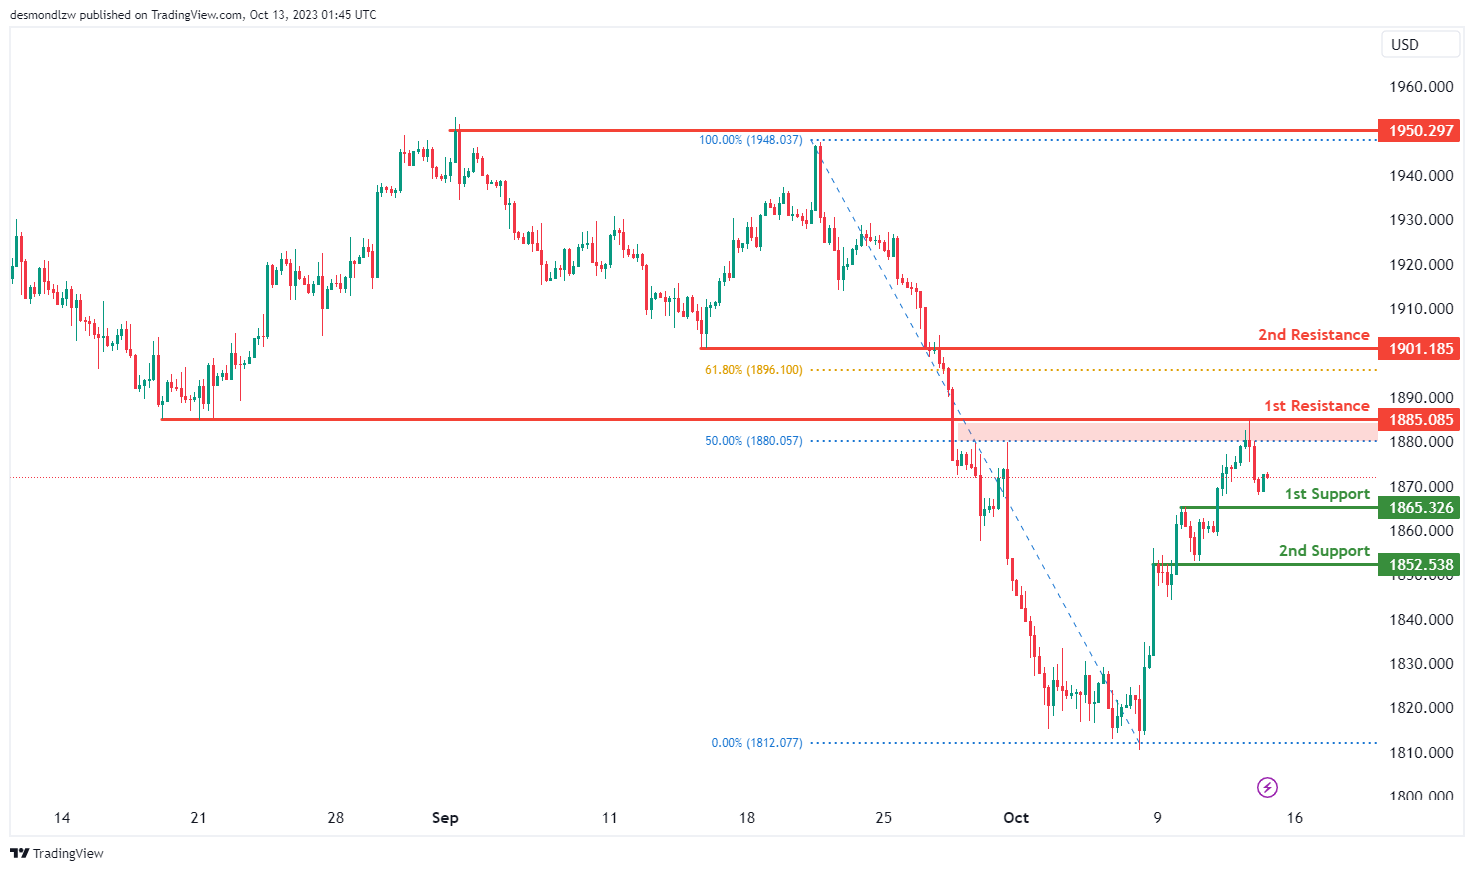
XAU/USD (GOLD):
The XAU/USD chart currently exhibits bullish momentum, suggesting the potential for a bounce off the 1st support and a move towards the 1st resistance.
The 1st support level at 1865.32 has previously acted as a reliable area of price support. This level is considered significant for potential upward movements. The 2nd support level at 1852.53 is another level of support, reinforcing the strength of the support zone.
On the resistance side, the 1st resistance at 1885.08 is characterized as a pullback resistance. It is also closely aligned with the 50% Fibonacci Retracement level, making it a critical area where price movement may encounter resistance. The 2nd resistance, situated at 1901.18, is an overlap resistance, which could potentially act as a significant barrier to further upward price movement.


