
DXY:
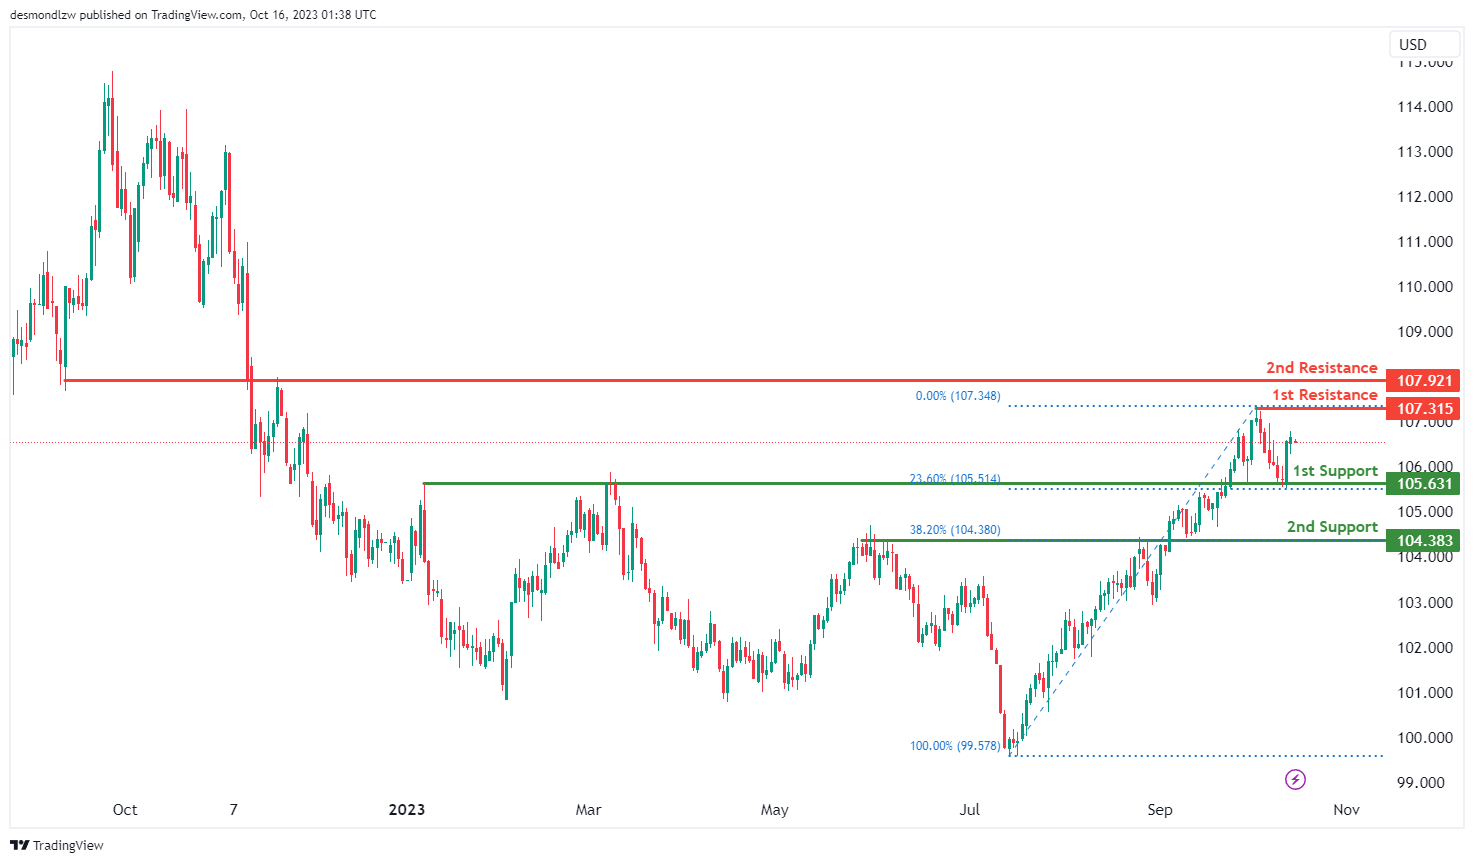
The DXY (US Dollar Index) chart currently demonstrates bullish momentum, indicating the potential for a bullish continuation towards the 1st resistance level.
The 1st support level at 105.63 is considered significant due to its alignment with an overlap support and the 23.60% Fibonacci Retracement level. This support level has the potential to act as a floor for price movements.
The 2nd support level at 104.38 is also an important level as it coincides with an overlap support and the 38.20% Fibonacci Retracement level. This dual confluence further strengthens its significance as a potential support area.
On the resistance side, the 1st resistance at 107.31 is characterized as a swing high resistance. This level marks a point where price movement may encounter resistance, potentially leading to a reversal or consolidation.
The 2nd resistance at 107.92 is an overlap resistance, which could serve as a formidable barrier to further bullish movements.
EUR/USD:
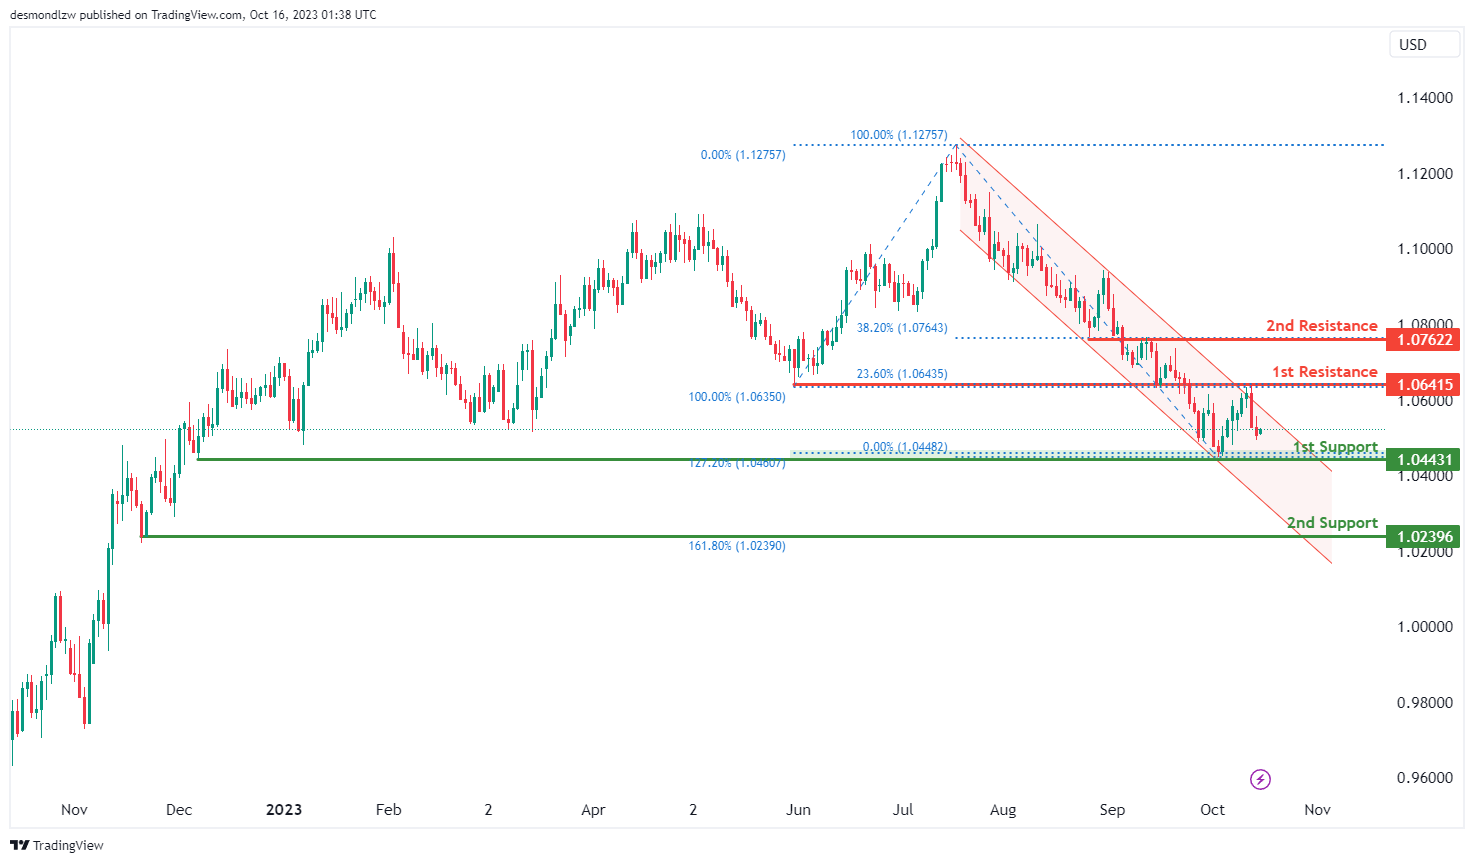
The EUR/USD chart currently exhibits bearish momentum, characterized by its presence in a bearish descending channel. This suggests a potential scenario of a bearish continuation towards the 1st support level.
The 1st support level at 1.0443 is considered significant as it aligns with an overlap support and coincides with the 127.20% Fibonacci Extension level. This level may act as a strong support zone and a potential target for bearish price movements.
The 2nd support level at 1.0239 is also notable, as it is identified as a swing low support and corresponds with the 161.80% Fibonacci Retracement level. This level further reinforces its importance as a potential support area.
On the resistance side, the 1st resistance at 1.0641 is characterized as an overlap resistance and is situated near the 23.60% Fibonacci Retracement level. This resistance level may hinder bullish advances, potentially leading to a reversal or consolidation. The 2nd resistance at 1.0762 is another overlap resistance and is positioned near the 38.20% Fibonacci Retracement level, making it a key level to watch for potential reversal or price reaction.
EUR/JPY:
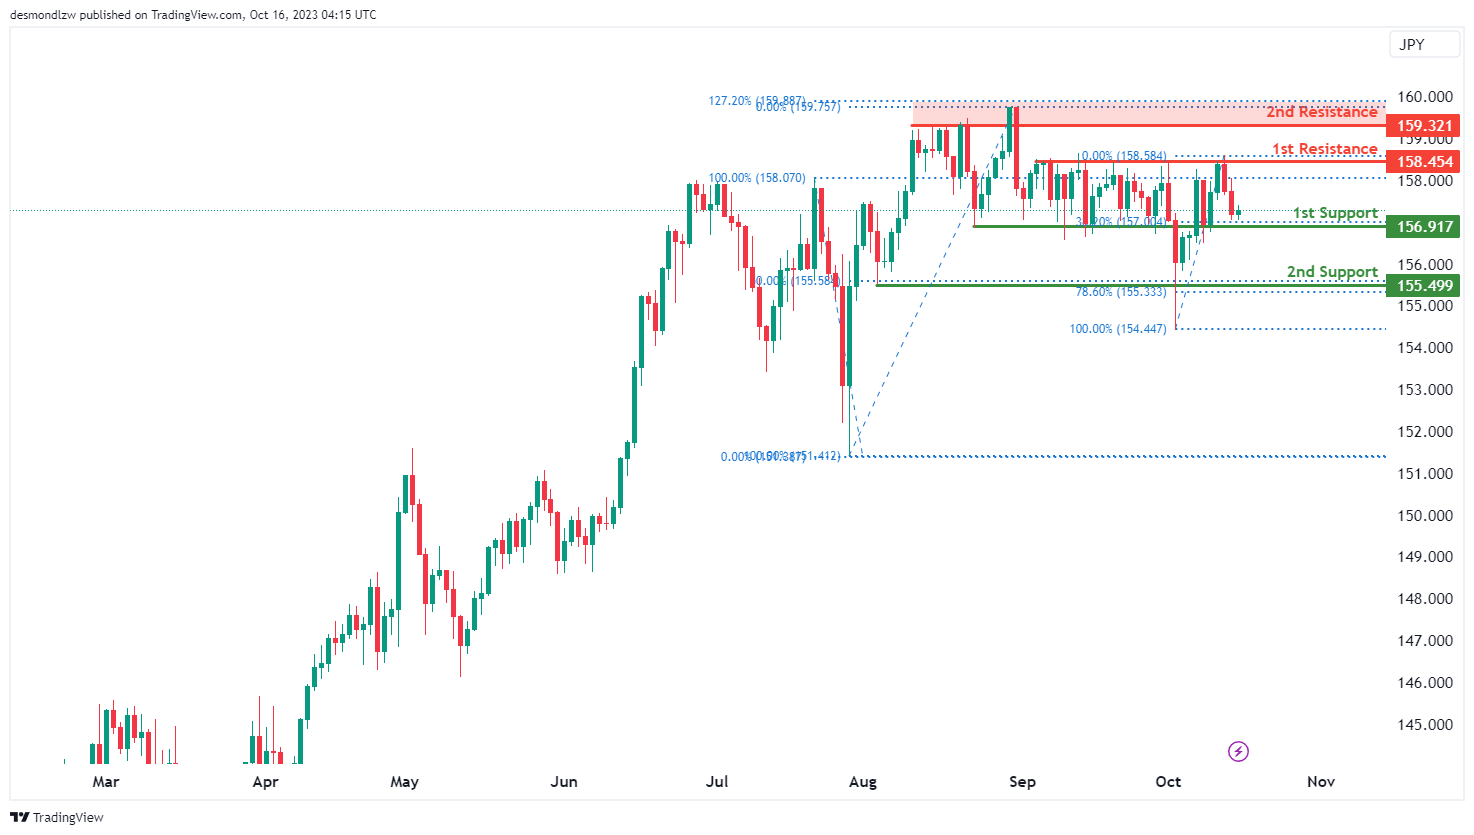
The instrument being analyzed is EUR/JPY, and the current overall momentum of its chart is bullish.
There is a potential scenario where the price could make a bullish bounce off the 1st support level, which is at 156.91, and head towards the 1st resistance level at 158.45.
The 1st support at 156.91 is considered significant because it acts as an overlap support and corresponds to a 38.20% Fibonacci Retracement level, providing a potential level of price support.
Additionally, there is a 2nd support level at 155.49, which is also valuable because it functions as a multi-swing low support. This level aligns with a 78.60% Fibonacci Retracement, further enhancing its significance in the analysis.
On the resistance side, the 1st resistance level at 158.45 is considered important because it represents a multi-swing high resistance, indicating a potential area where the price might encounter resistance.
Moreover, there is a 2nd resistance level at 159.32, which is also significant as it represents a pullback resistance. This level aligns with a 127.20% Fibonacci Extension, potentially adding to its significance in the chart analysis.
EUR/GBP:
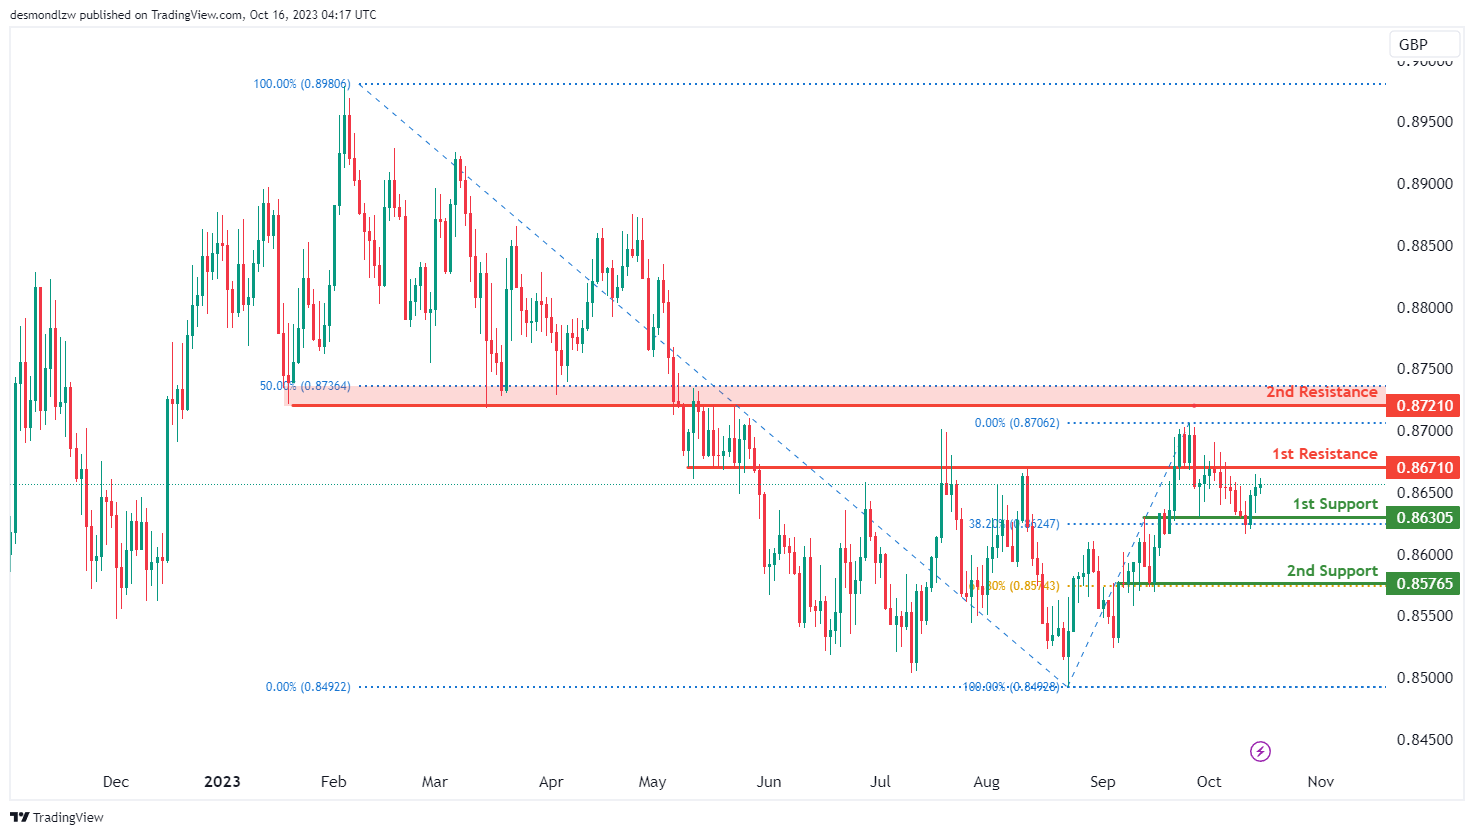
The instrument being analyzed is EUR/GBP, and the current overall momentum of its chart is bearish.
There is a potential scenario where the price could rise towards the 1st resistance level in the short term before reversing off it and dropping towards the 1st support level.
The 1st support level at 0.8630 is considered significant because it acts as an overlap support and corresponds to a 38.20% Fibonacci Retracement level, providing a potential level of price support.
Additionally, there is a 2nd support level at 0.8576, which is also valuable because it functions as an overlap support and aligns with a 61.80% Fibonacci Retracement, further enhancing its significance.
On the resistance side, the 1st resistance level at 0.8671 is considered important because it represents an overlap resistance, and this level might act as a barrier to further price increases.
Moreover, there is a 2nd resistance level at 0.8721, which holds importance as it represents an overlap resistance. This level coincides with a 50% Fibonacci Retracement, potentially adding to its significance in the chart analysis.
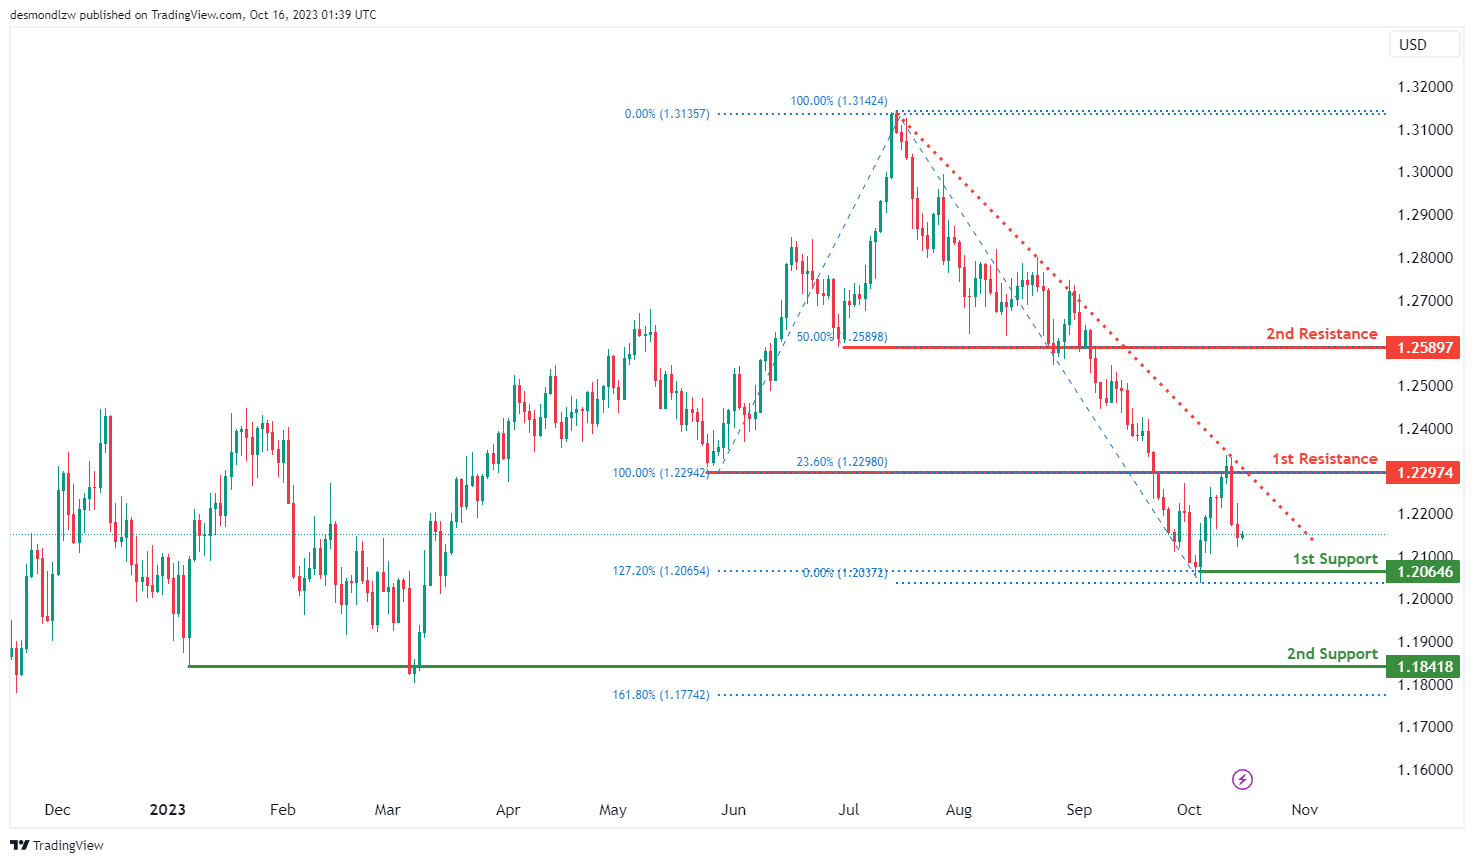
GBP/USD:
The GBP/USD chart currently exhibits bearish momentum, with factors contributing to this momentum being its position below a major descending trend line, suggesting a potential bearish continuation scenario.
The 1st support level at 1.2064 is of significance as it aligns with a swing low support and coincides with the 127.20% Fibonacci Extension level. This level may act as a strong support zone and a potential target for bearish price movements. The 2nd support level at 1.1841 is also noteworthy, as it is identified as a multi-swing low support. This level further reinforces its importance as a potential support area.
On the resistance side, the 1st resistance at 1.2297 is characterized as an overlap resistance and is situated near the 23.60% Fibonacci Retracement level. This resistance level may hinder bullish advances, potentially leading to a reversal or consolidation. The 2nd resistance at 1.2589 is a swing high resistance and is positioned near the 50% Fibonacci Retracement level, making it a key level to watch for potential reversal or price reaction.
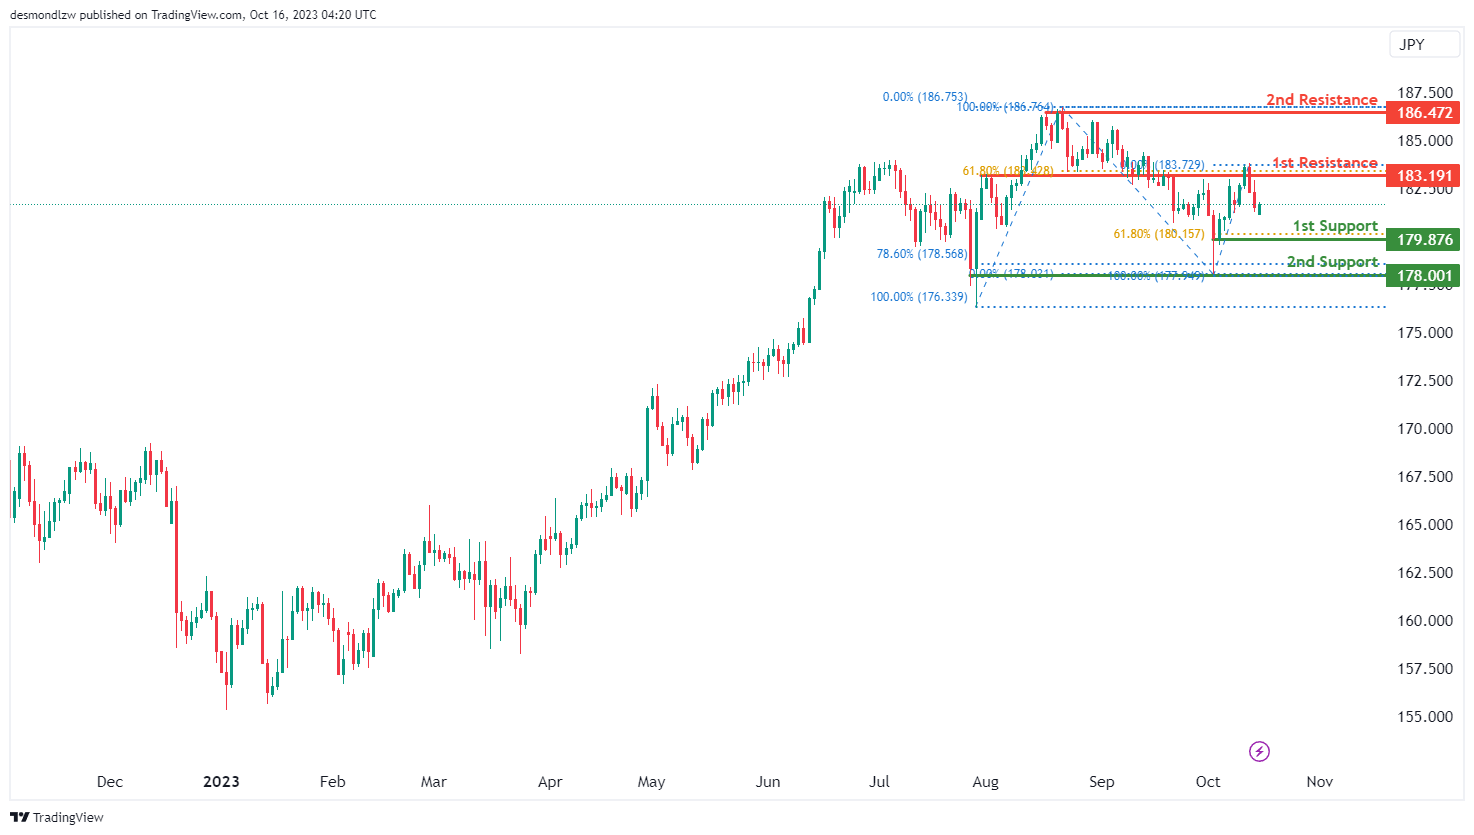
GBP/JPY:
The instrument being analyzed is GBP/JPY, and the current overall momentum of its chart is bearish.
There is a potential scenario where the price could make a bearish continuation towards the 1st support level, which is at 179.87.
The 1st support at 179.87 is considered significant because it functions as a swing low support and aligns with a 61.80% Fibonacci Retracement level, providing a potential level of price support.
In addition, there is a 2nd support level at 178.00, which is also valuable because it acts as a multi-swing low support. This level aligns with a 78.60% Fibonacci Retracement, further enhancing its significance in the analysis.
On the resistance side, the 1st resistance level at 183.19 is considered important because it represents an overlap resistance. This level coincides with a 61.80% Fibonacci Retracement, indicating that it might act as a barrier to further price increases.
Moreover, there is a 2nd resistance level at 186.47, which is significant as it represents a multi-swing high resistance in the chart analysis. This level could potentially hinder the price from moving higher, contributing to the overall bearish outlook.
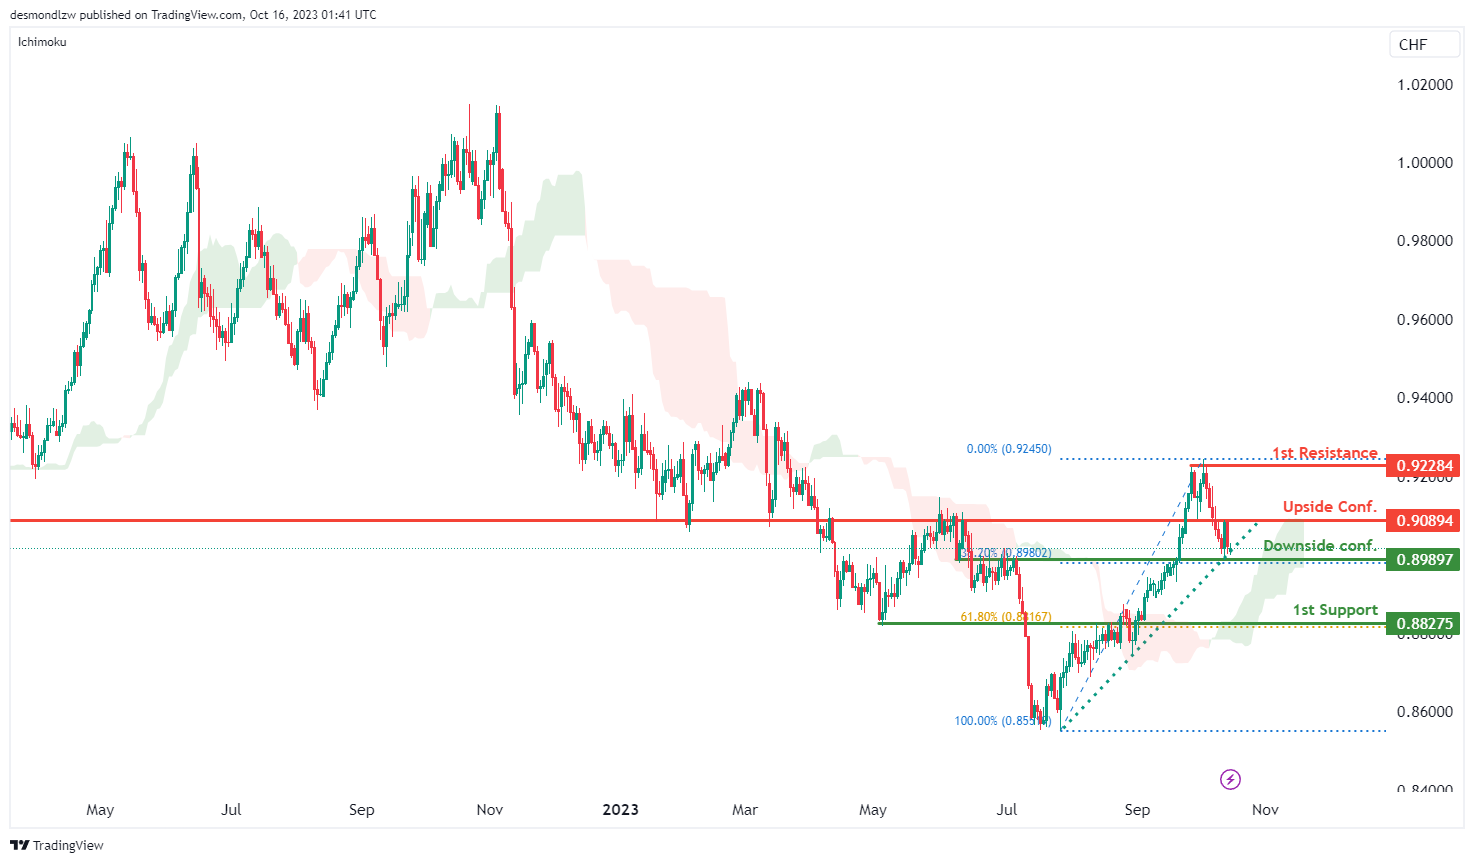
USD/CHF:
The USD/CHF chart currently exhibits bullish momentum, with factors contributing to this momentum being that price has crossed above the Ichimoku cloud and is following an ascending trend line, which acts as support.
Given the bullish momentum, but price could potentially fluctuate between the 1st resistance and 1st support levels.
The 1st support level at 0.8827 is considered significant as it aligns with an overlap support and coincides with the 61.80% Fibonacci Retracement level. This level may act as a strong support zone, potentially limiting downside movements. Waiting for downside confirmation at the level of 0.8989, which is also identified as an overlap support, further reinforces its potential importance as a support area.
On the resistance side, the 1st resistance at 0.9228 is characterized as a multi-swing high resistance, which could act as a barrier to further bullish advances. Waiting for upside confirmation at the level of 0.9089, identified as an overlap resistance.
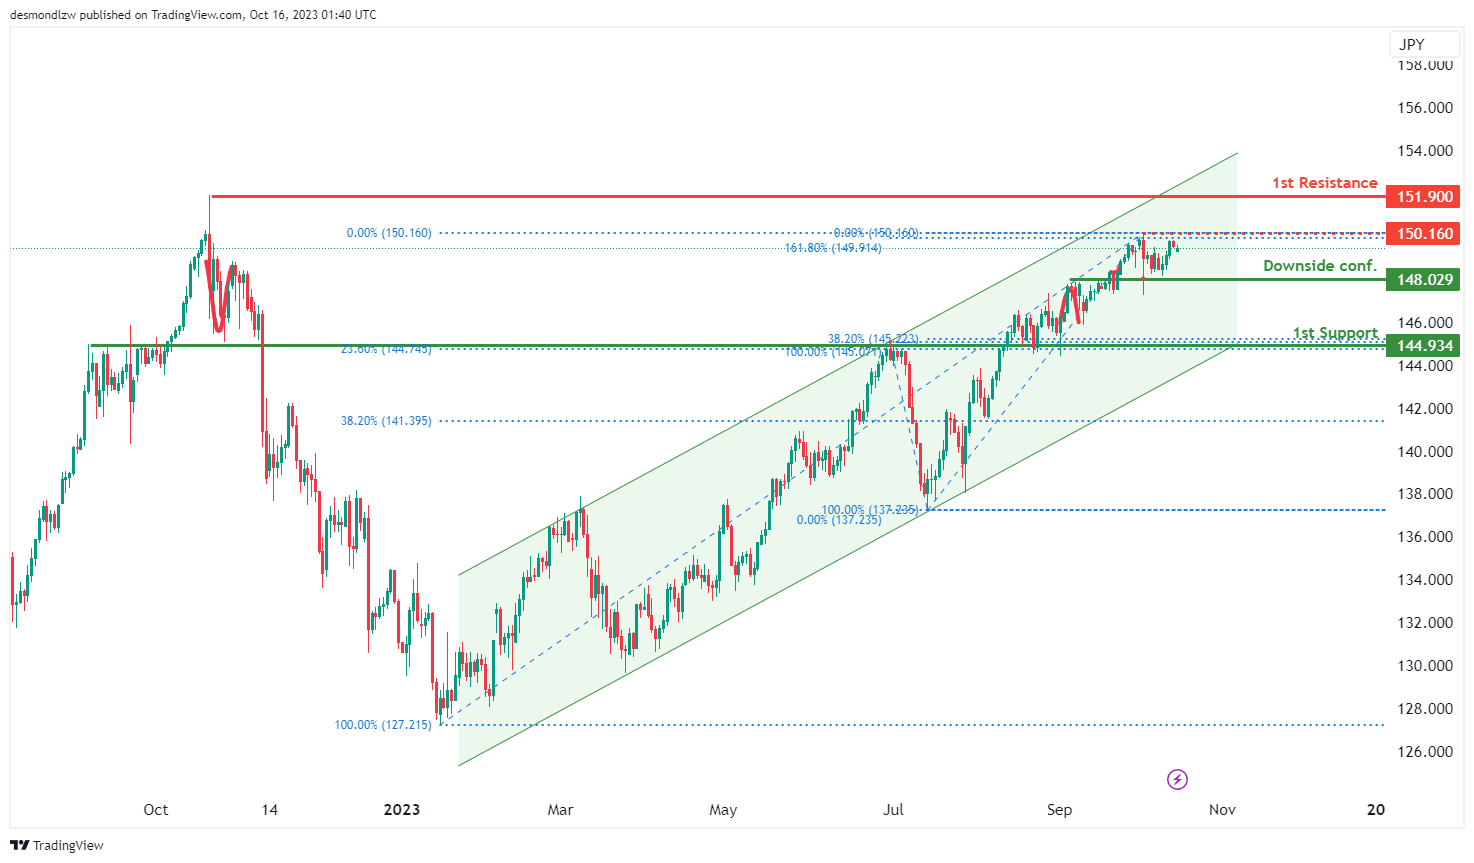
USD/JPY:
The USD/JPY chart currently exhibits bullish momentum, with factors contributing to this momentum being that price is within a bullish ascending channel.
Given this bullish momentum, price could potentially continue its upward movement towards the 1st resistance.
The 1st support level at 144.93 is considered significant as it aligns with a pullback support and coincides with the 38.20% Fibonacci Retracement level. This level may act as a strong support zone, potentially limiting downside movements. Waiting for downside confirmation at the level of 148.02, which is also identified as an overlap support, further reinforces its potential importance as a support area.
On the resistance side, the 1st resistance at 151.90 is characterized as a swing high resistance, which could act as a barrier to further bullish advances. Additionally, the intermediate resistance at the same level, 151.90, is significant as it aligns with a swing high resistance and coincides with the 161.80% Fibonacci Extension level, indicating a potential key resistance zone.
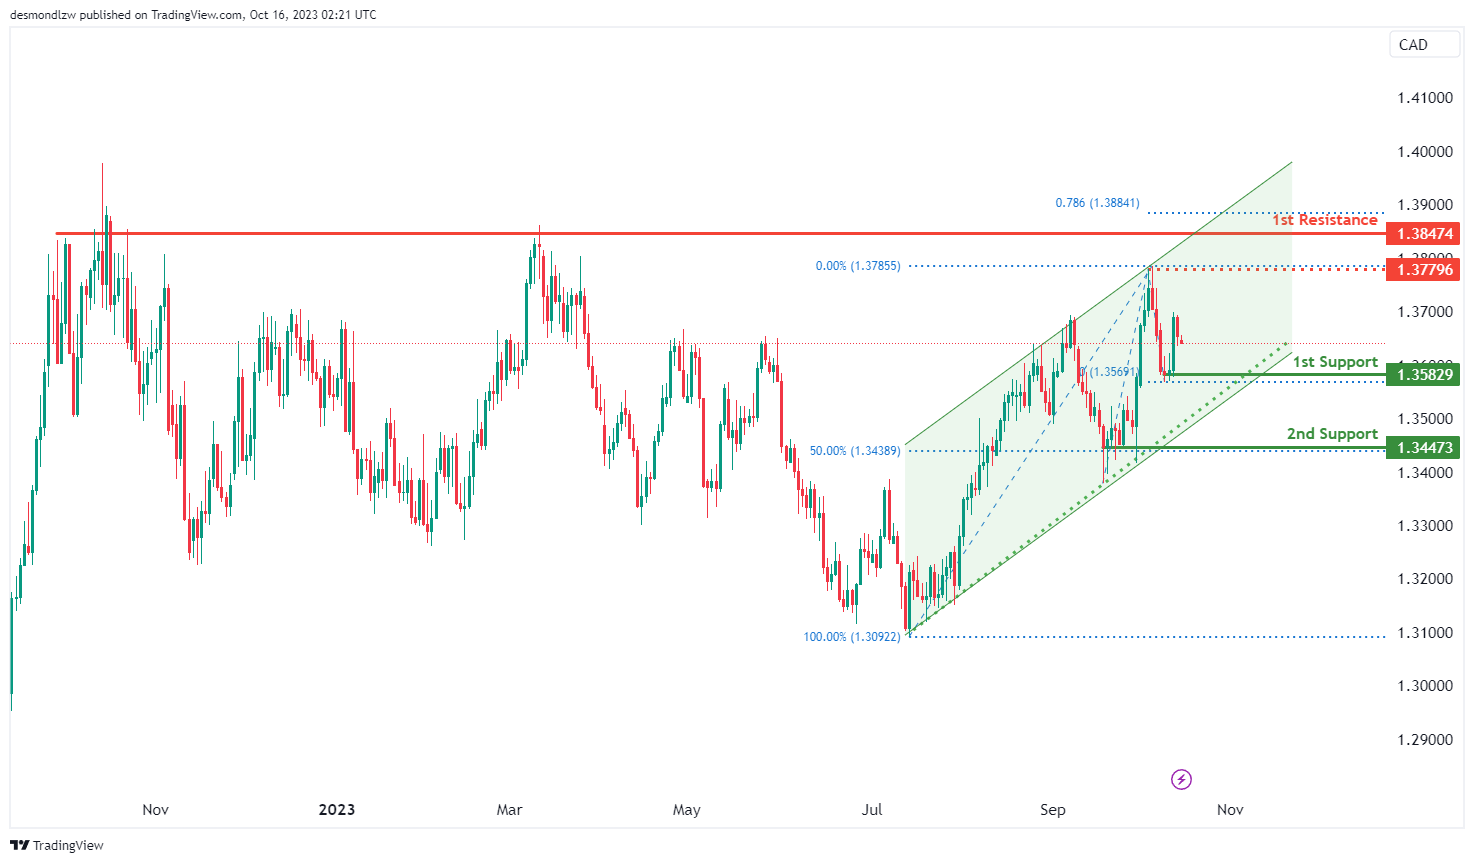
USD/CAD:
The USD/CAD chart currently exhibits bullish momentum, with factors contributing to this momentum being the presence of a bullish ascending channel.
In light of this bullish momentum, it is possible that price could experience a bullish continuation towards the 1st resistance.
The 1st support level at 1.3582 is considered significant as it aligns with a swing low support, indicating a potential strong support area within the bullish channel. This level may act as a foundation for potential pullbacks, providing a base for the ongoing bullish trend. Furthermore, the 2nd support at 1.3447 is characterized as a multi-swing low support and coincides with the 50% Fibonacci Retracement level, adding to its significance as a potential support zone.
On the resistance side, the 1st resistance at 1.3847 is identified as a multi-swing high resistance, potentially acting as a barrier to further bullish advances. Intermediate resistance at 1.3779, identified as a swing high resistance, adds another potential obstacle for the bullish price movement.
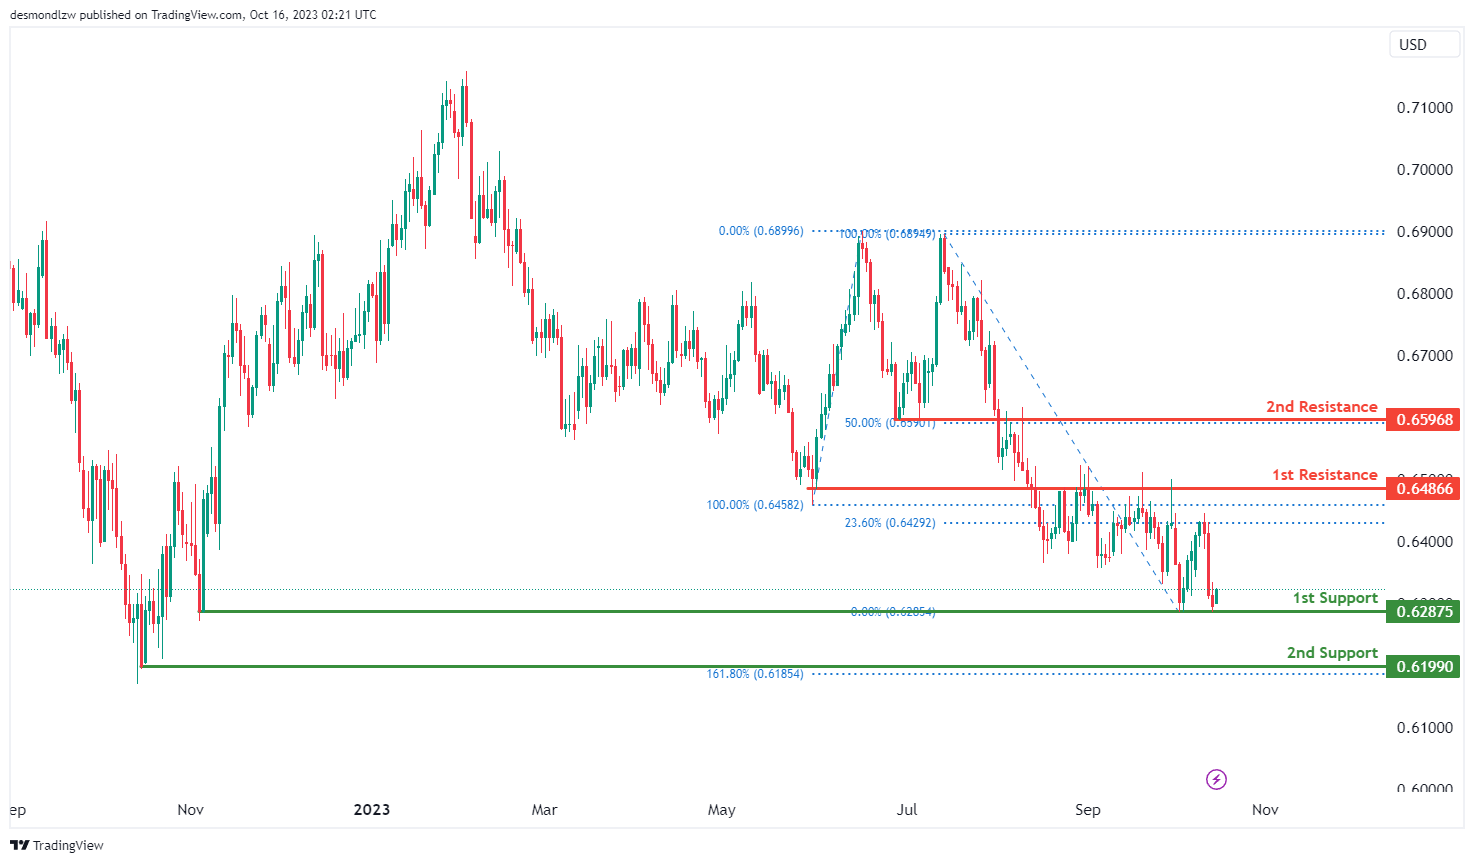
AUD/USD:
The AUD/USD chart currently exhibits bullish momentum, indicating a potential scenario of a bullish bounce off the 1st support level, aiming towards the 1st resistance.
The 1st support at 0.8687 is significant as it is identified as a multi-swing low support, suggesting that this level has historically acted as a strong support zone. Additionally, the 2nd support at 0.6199 is characterized as a swing low support and aligns with the 161.80% Fibonacci Extension level, further reinforcing its importance as a potential support area. However, please double-check the provided value for the 2nd support, as it appears to be significantly below the current market price, and it may not be accurate.
On the resistance side, the 1st resistance at 0.6486 is identified as an overlap resistance, which could pose a challenge to the bullish momentum. Beyond this, the 2nd resistance at 0.6596 is characterized as another overlap resistance and coincides with the 50% Fibonacci Retracement level, making it a potentially strong resistance level.
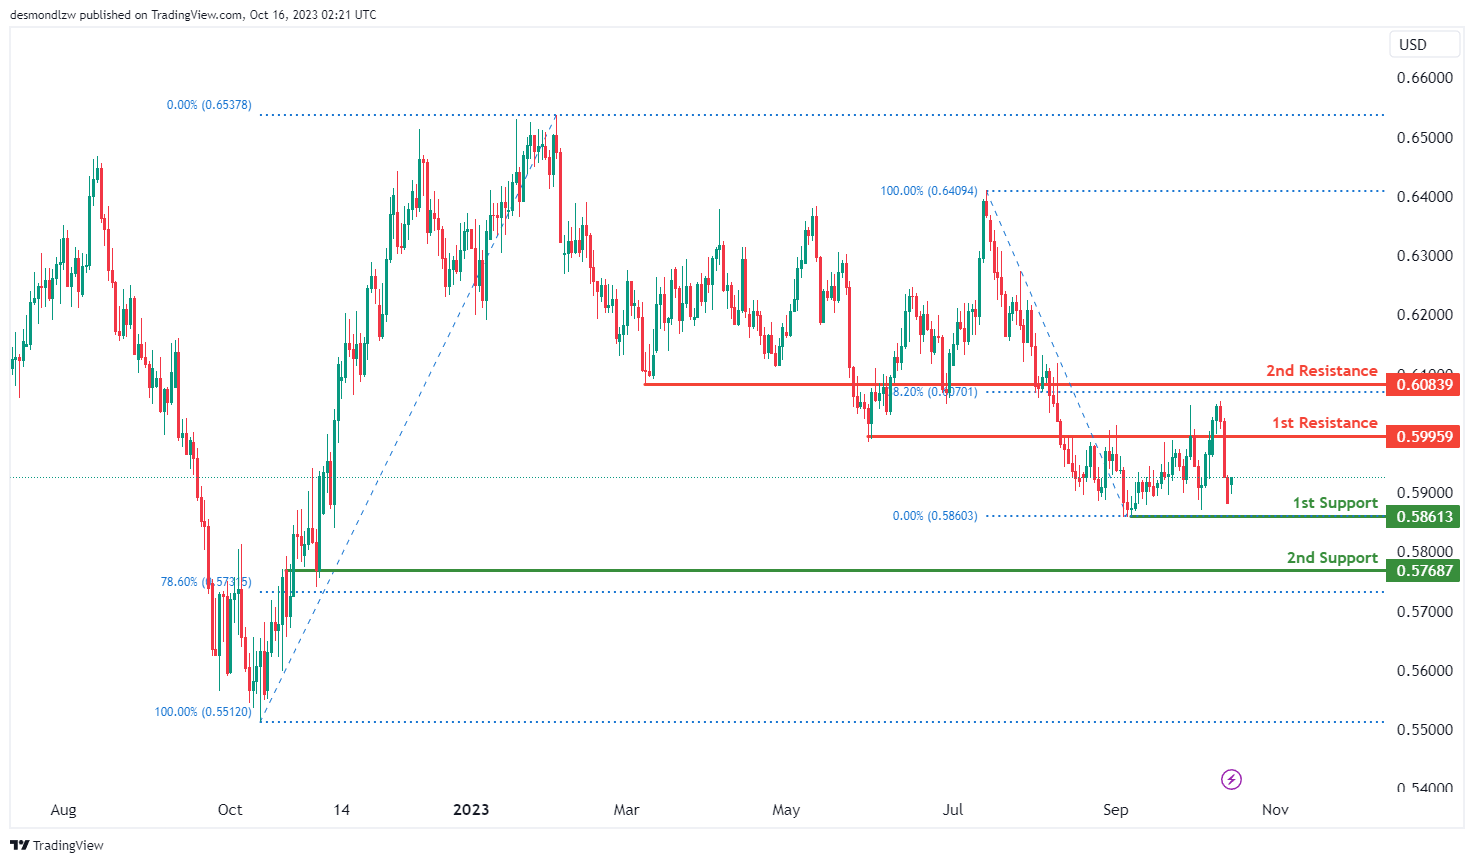
NZD/USD
The NZD/USD chart currently exhibits bullish momentum, suggesting a potential scenario of a bullish bounce off the 1st support level, with the aim of heading towards the 1st resistance.
The 1st support at 0.5861 is considered significant as it is identified as a multi-swing low support, indicating a historical level of strong support in the past. Additionally, the 2nd support at 0.5768 is characterized as an overlap support and aligns with the 78.60% Fibonacci Retracement level, which adds to its credibility as a potential support zone.
On the resistance side, the 1st resistance at 0.5995 is identified as a pullback resistance, which could potentially act as a barrier to the bullish momentum. Beyond this, the 2nd resistance at 0.6083 is characterized as another pullback resistance and coincides with the 38.20% Fibonacci Retracement level, making it a potentially strong resistance level.
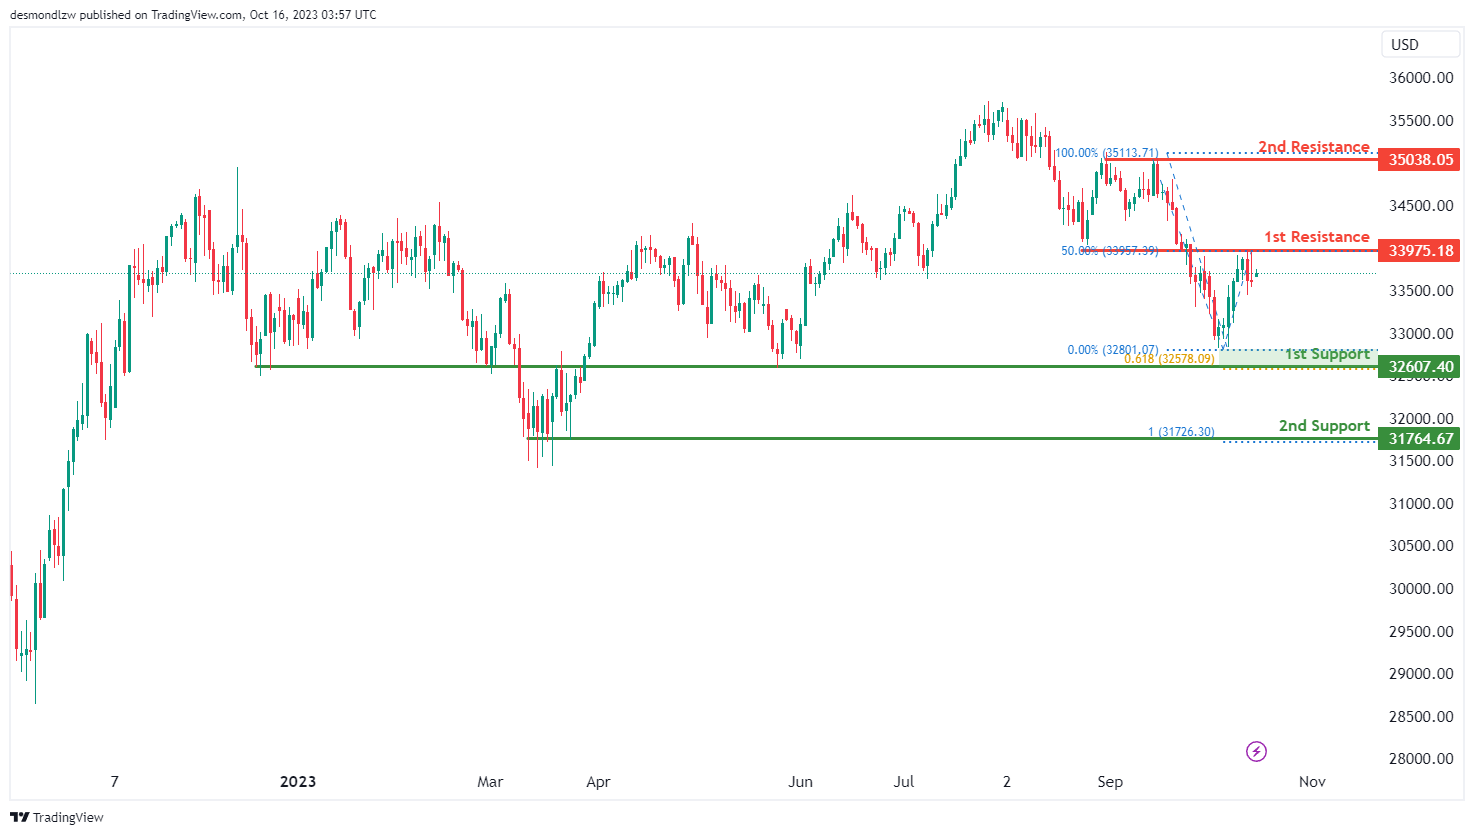
DJ30:
The instrument being analyzed is DJ30, and the current overall momentum of its chart is bearish.
There is a potential scenario where the price could make a bearish continuation towards the 1st support level, which is at 32607.40.
The 1st support at 32607.40 is considered significant because it acts as an overlap support and coincides with a 61.80% Fibonacci Projection, adding to its importance in the analysis.
In addition to the 1st support, there is a 2nd support level at 31764.67, which is also noteworthy due to its status as a multi-swing low support. This level aligns with a 100% Fibonacci Projection, further enhancing its significance.
On the resistance side, the 1st resistance level at 33975.18 is considered important because it represents an overlap resistance. Moreover, this level corresponds to a 50% Fibonacci Retracement, adding to its significance.
Moreover, there is a 2nd resistance level at 35038.05, which is deemed important as it represents a multi-swing high resistance in the chart analysis.
GER40:
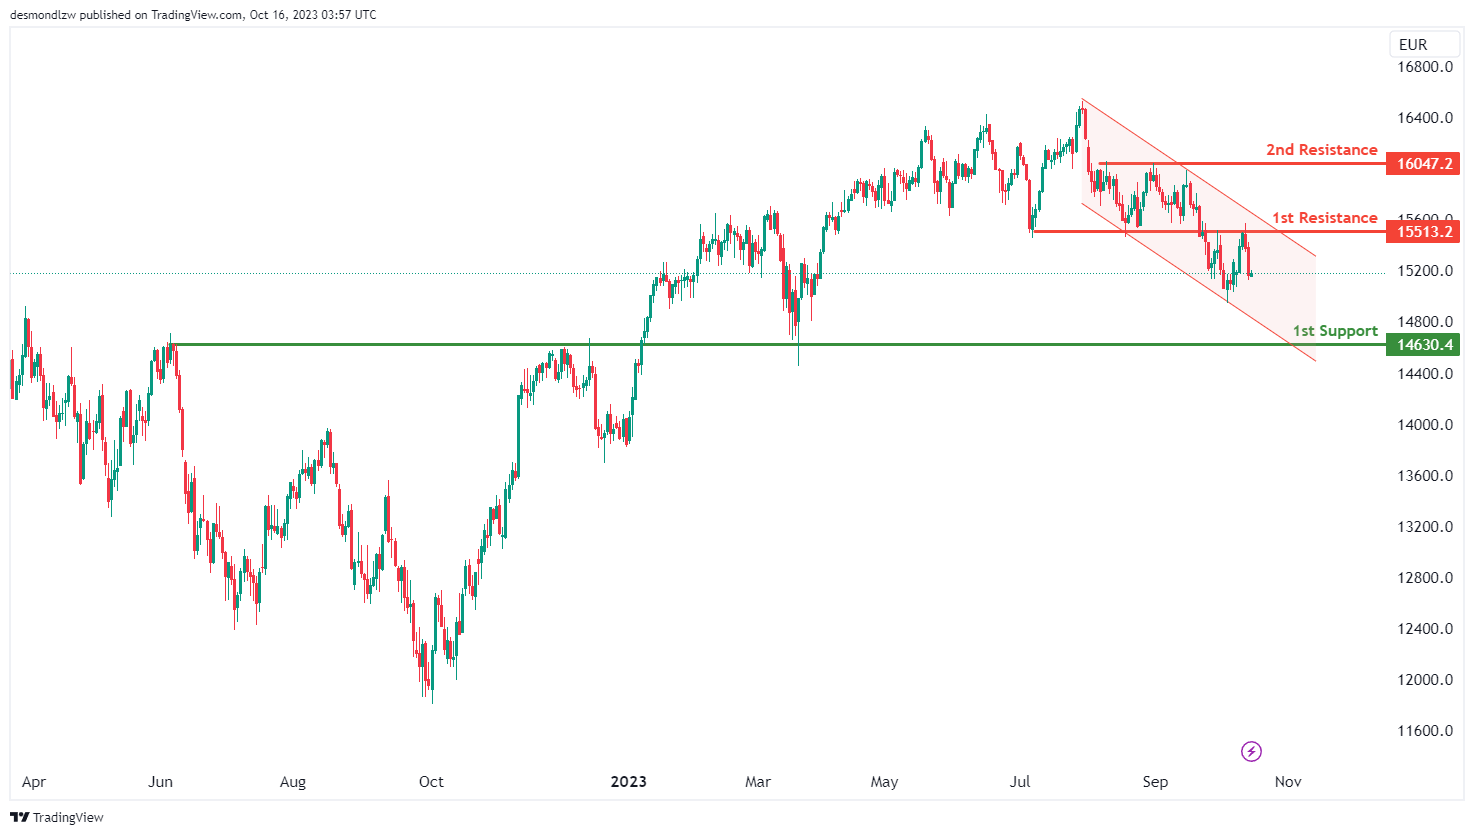
The instrument being analyzed is GER40, and the current overall momentum of its chart is bearish. This bearish momentum is influenced by the fact that the price is within a bearish descending channel.
There is a potential scenario where the price could make a bearish continuation towards the 1st support level, which is at 14630.40. The 1st support is considered significant because it acts as an overlap support, providing a potential level of price support.
On the resistance side, the 1st resistance level is at 15513.20, and it is considered important because it represents an overlap resistance. This level may act as a barrier to further price increases.
Additionally, there is a 2nd resistance level at 16047.20, which is valuable because it serves as a multi-swing high resistance. This level could also potentially hinder the price from moving higher, contributing to the bearish outlook.
US500
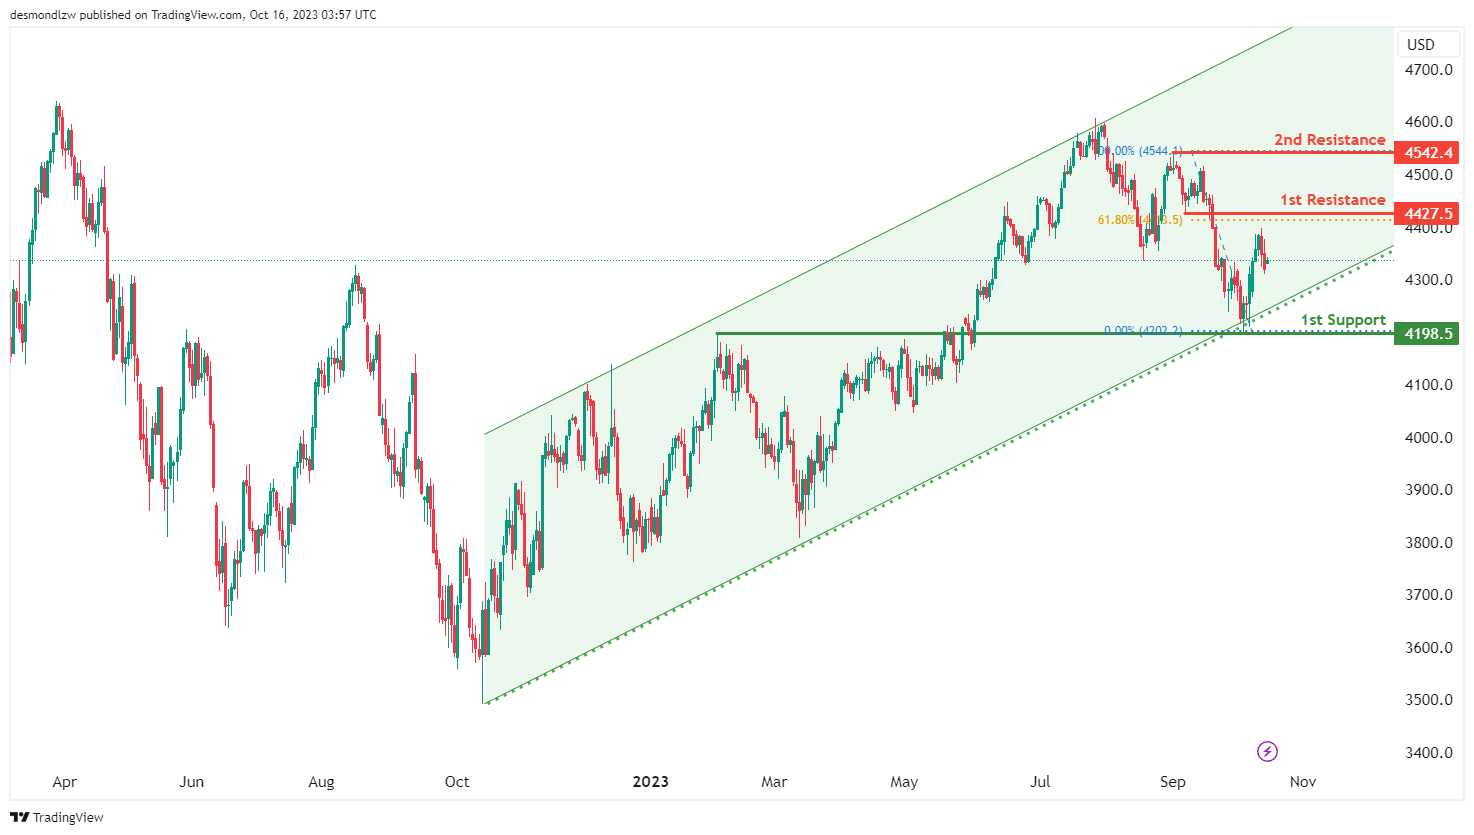
The instrument being analyzed is US500, and the current overall momentum of its chart is bullish. This bullish momentum is influenced by the fact that the price is within a bullish ascending channel.
There is a potential scenario where the price could make a bullish continuation towards the 1st resistance level, which is at 4427.5.
The 1st support level at 4198.5 is considered significant because it acts as an overlap support. However, specific reasons for its importance are not provided in the data you’ve provided.
On the resistance side, the 1st resistance level at 4427.5 is considered important because it represents a pullback resistance. Furthermore, this level aligns with a 61.80% Fibonacci Retracement, adding to its significance in the analysis.
Moreover, there is a 2nd resistance level at 4542.4, which is valuable because it functions as a swing high resistance. This level may act as an additional barrier to price increases, contributing to the overall bullish outlook.
BTC/USD:
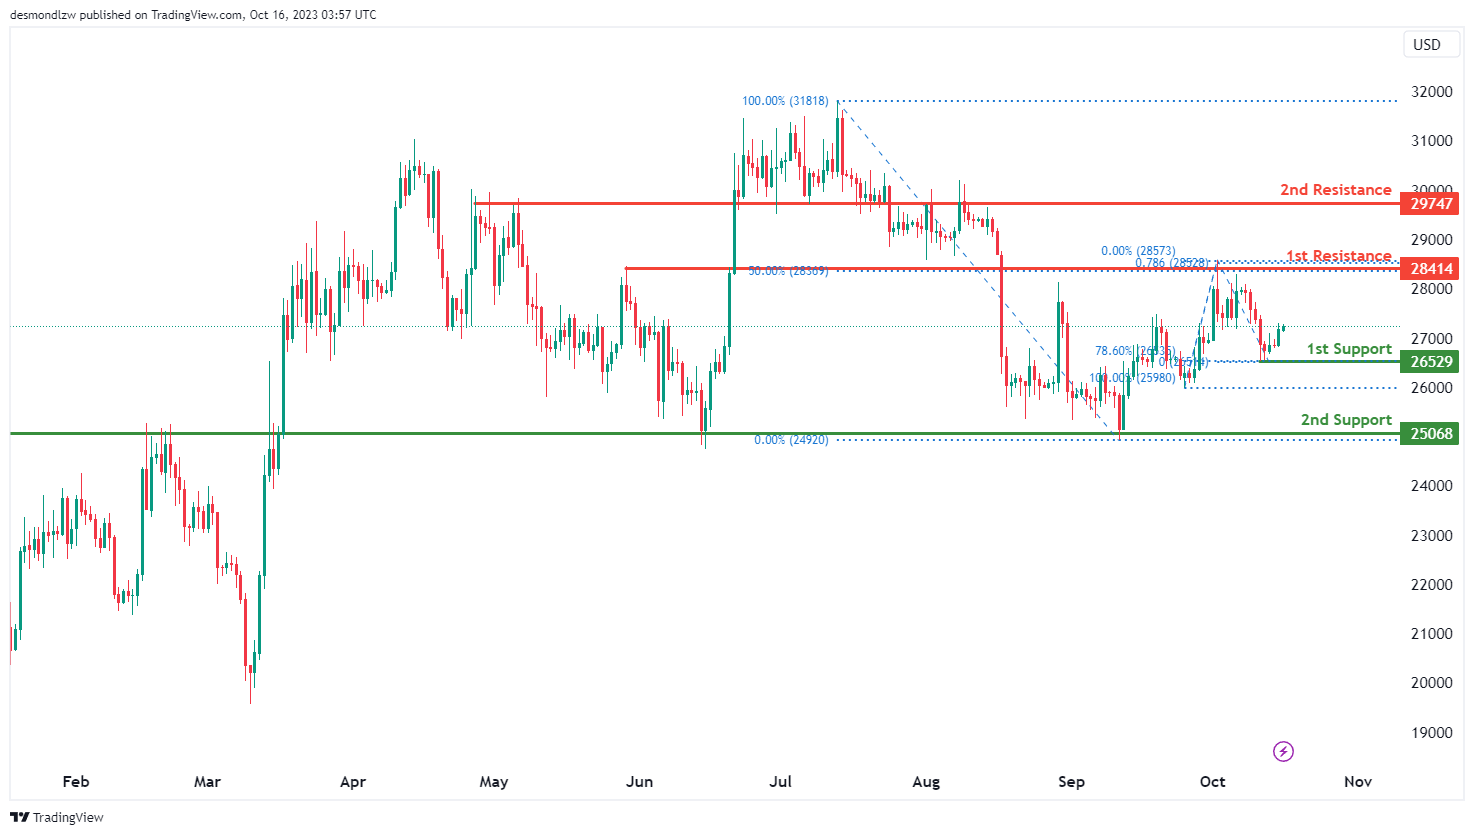
The instrument being analyzed is BTC/USD, and the current overall momentum of its chart is bullish.
There is a potential scenario where the price could continue its bullish movement towards the 1st resistance level, which is at 28414.
The 1st support at 26529 is considered significant because it functions as a swing low support and aligns with a 78.60% Fibonacci Retracement level.
Additionally, there is a 2nd support level at 25068, which is also valuable as it acts as an overlap support.
On the resistance side, the 1st resistance level at 28414 is considered important because it represents an overlap resistance. Furthermore, this level coincides with both a 78.60% Fibonacci Projection and a 50% Fibonacci Retracement, indicating Fibonacci confluence and adding to its significance in the analysis.
Moreover, there is a 2nd resistance level at 29747, which is also significant as it represents an overlap resistance in the chart analysis.
ETH/USD:
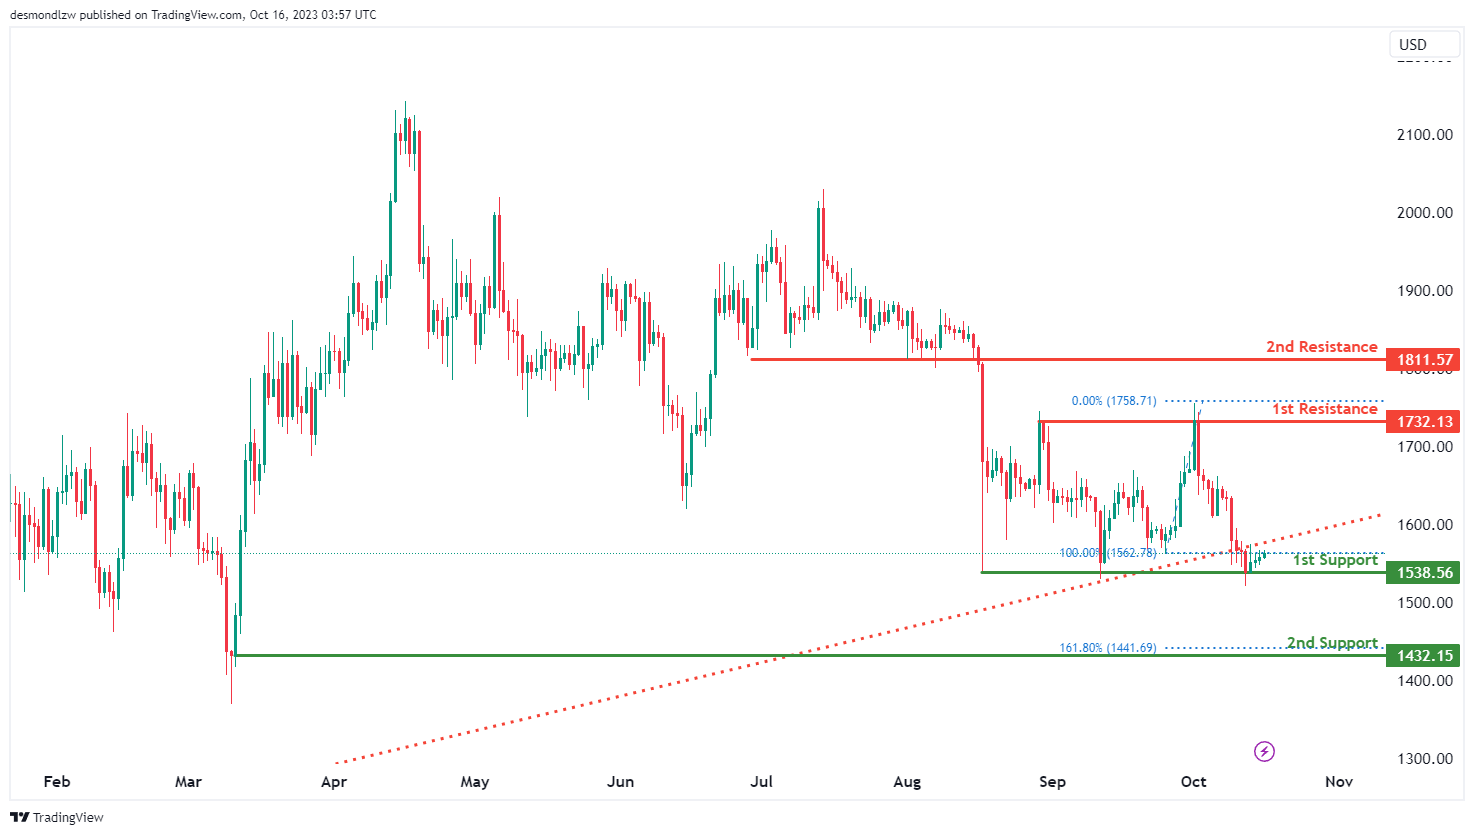
The instrument being analyzed is ETH/USD, and the current overall momentum of its chart is bullish.
There is a potential scenario where the price could make a bullish bounce off the 1st support level, which is at 1538.56, and head towards the 1st resistance level at 1732.13.
The 1st support at 1538.56 is considered significant because it acts as a multi-swing low support.
In addition, there is a 2nd support level at 1432.15, which is also valuable as it functions as a swing low support and aligns with a 161.80% Fibonacci Extension.
On the resistance side, the 1st resistance level at 1732.13 is considered important because it represents a multi-swing high resistance.
Moreover, there is a 2nd resistance level at 1811.57, which holds importance as a pullback resistance in the chart analysis.
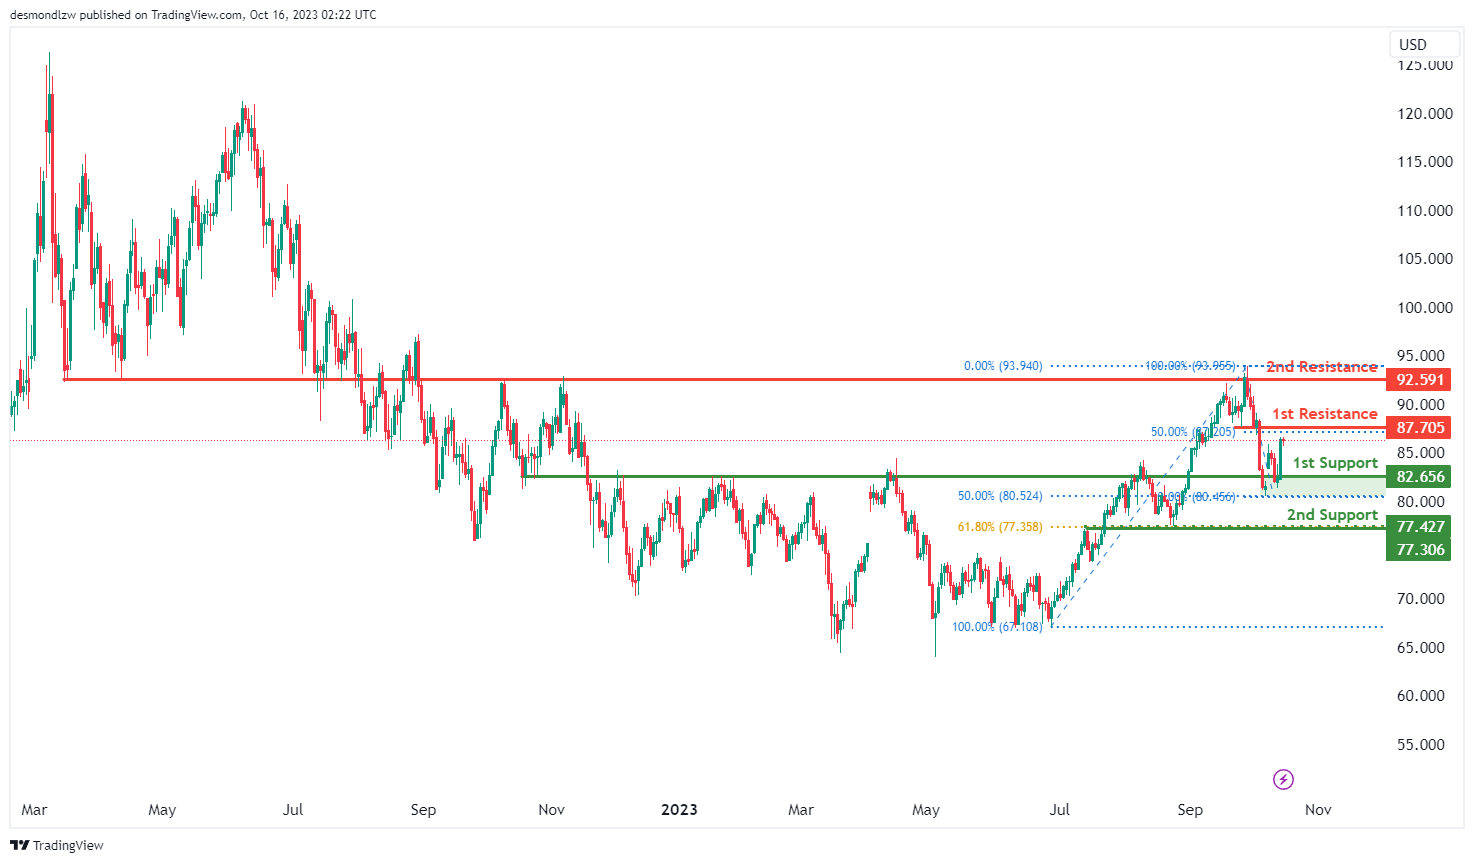
WTI/USD:
The WTI chart currently shows a bearish momentum, indicating the potential for a bearish reaction off the 1st resistance level and a drop towards the 1st support.
The 1st support at 82.65 is considered significant as it aligns with an overlap support level and coincides with the 50% Fibonacci Retracement level. This confluence of technical factors makes it a strong potential support zone. Additionally, the 2nd support at 77.42 is identified as another overlap support level and corresponds to the 61.80% Fibonacci Retracement level, further reinforcing its credibility as a potential support area.
On the resistance side, the 1st resistance at 87.70 is characterized as a pullback resistance, which could potentially act as a barrier to the bearish momentum. Beyond this, the 2nd resistance at 92.59 is identified as an overlap resistance level.
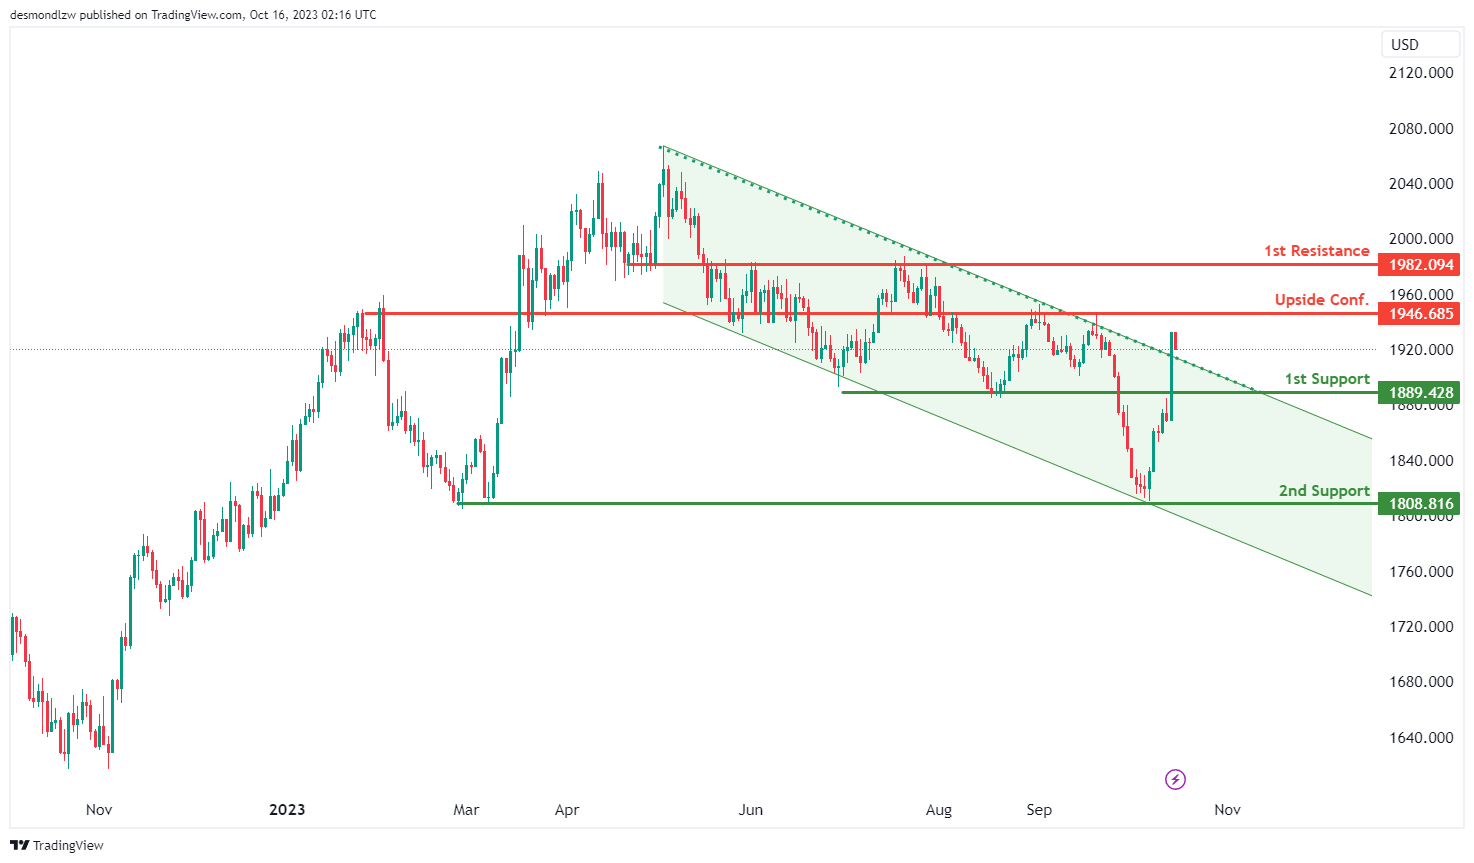
XAU/USD (GOLD):
The XAU/USD chart currently exhibits bullish momentum, with factors contributing to this momentum being the breakout above a descending resistance line, triggering a potential bullish move.
Given this bullish momentum, price could potentially experience a bullish bounce off the 1st support and continue its upward movement towards the 1st resistance.
The 1st support level at 1889.42 is considered significant as it aligns with a pullback support, indicating a potential strong support area. This level may act as a foundation for any potential pullbacks, providing a base for the bullish trend. Additionally, the 2nd support at 1808.81 is characterized as a multi-swing low support, further reinforcing its significance as a potential support zone.
On the resistance side, the 1st resistance at 1982.09 is identified as an overlap resistance, potentially acting as a barrier to further bullish advances. Waiting for upside confirmation at the level of 1946.68, which is also identified as an overlap resistance, adds weight to its importance as a resistance area.


