
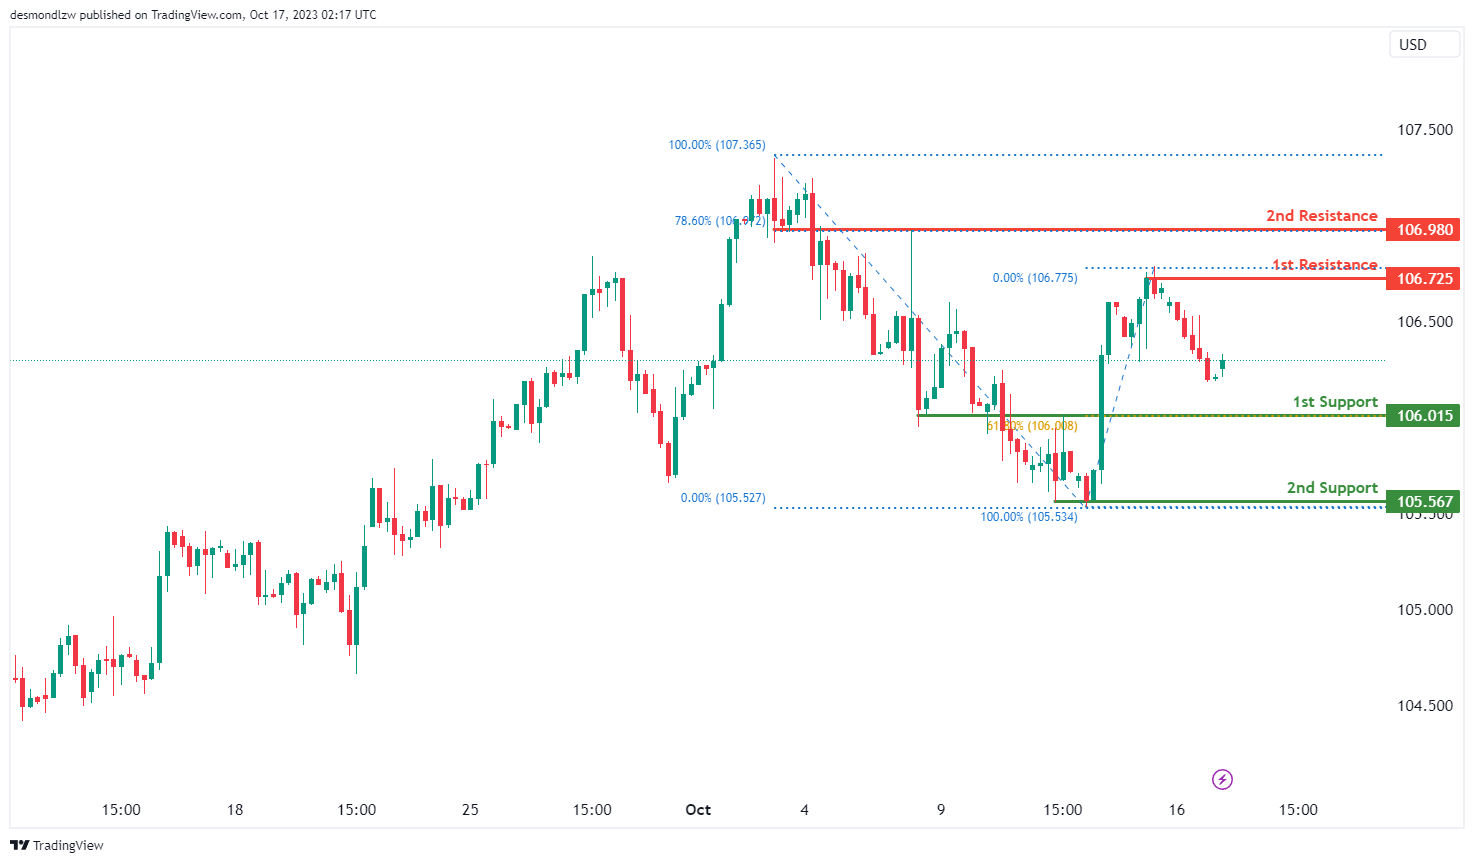
DXY:
The DXY chart currently exhibits a bullish momentum, suggesting the potential for a bullish bounce off the 1st support level and a move towards the 1st resistance.
The 1st support at 106.01 is considered significant as it aligns with a pullback support level and coincides with the 61.80% Fibonacci Retracement level. This confluence of technical factors makes it a strong potential support zone. Additionally, the 2nd support at 105.56 is identified as a multi-swing low support level, further reinforcing its credibility as a potential support area.
On the resistance side, the 1st resistance at 106.72 is characterized as a swing high resistance, which could potentially act as a barrier to the bullish momentum. Beyond this, the 2nd resistance at 106.98 is identified as an overlap resistance level and coincides with the 78.60% Fibonacci Retracement level.
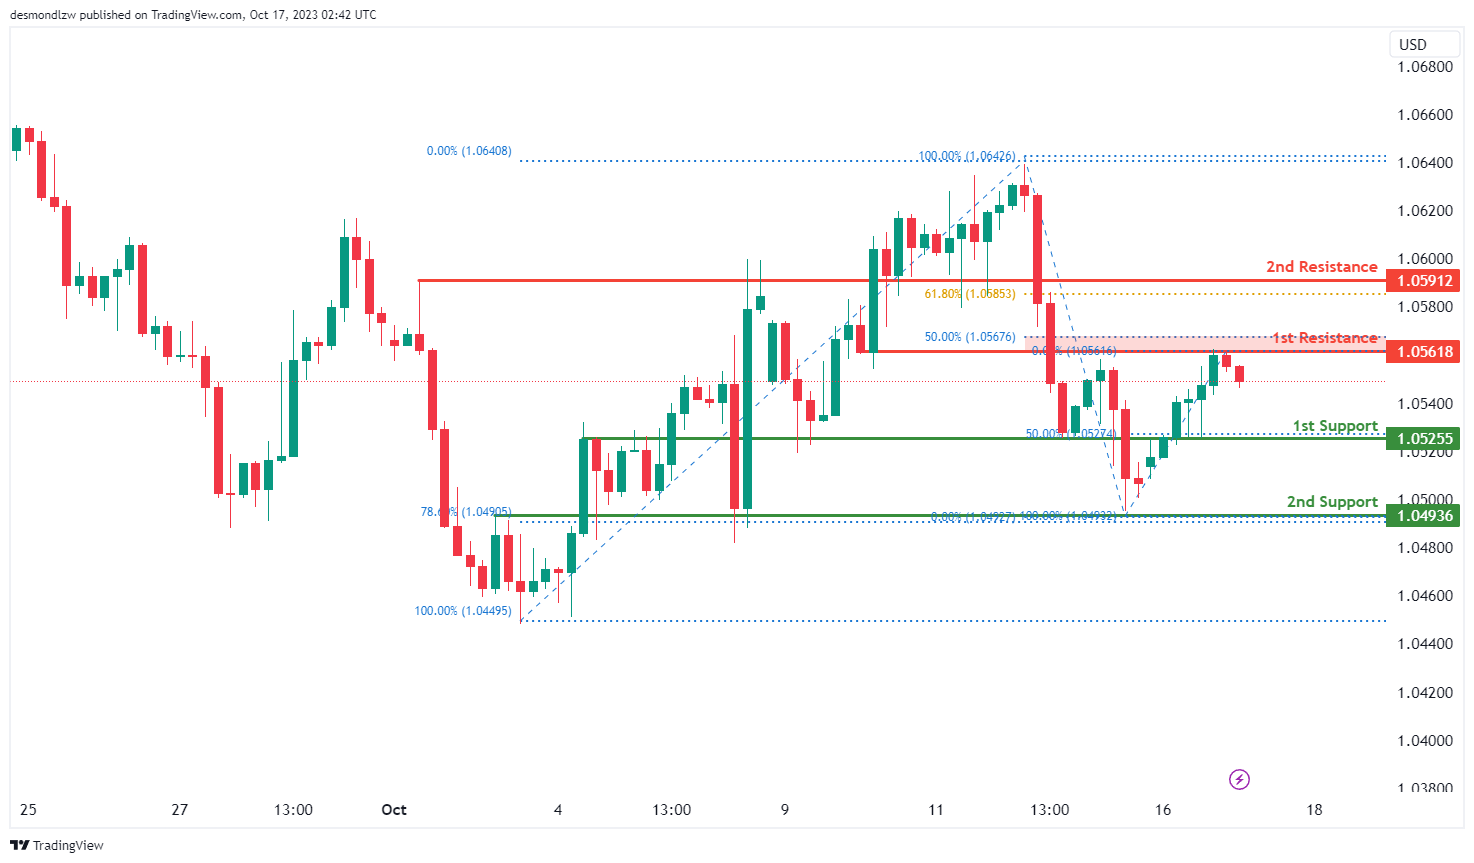
EUR/USD:
The EUR/USD chart currently exhibits a bearish momentum, suggesting the potential for a bearish continuation towards the 1st support level.
The 1st support at 1.0525 is considered significant as it aligns with an overlap support level and coincides with the 50% Fibonacci Retracement level, providing strong potential support. Additionally, the 2nd support at 1.0493 is identified as another overlap support level and aligns with the 78.60% Fibonacci Retracement level, further reinforcing its credibility as a potential support area.
On the resistance side, the 1st resistance at 1.0561 is characterized as an overlap resistance level and aligns with the 50% Fibonacci Retracement level. This level could potentially act as a barrier to the bearish momentum. Beyond this, the 2nd resistance at 1.0591 is identified as a pullback resistance and coincides with the 61.80% Fibonacci Retracement level.
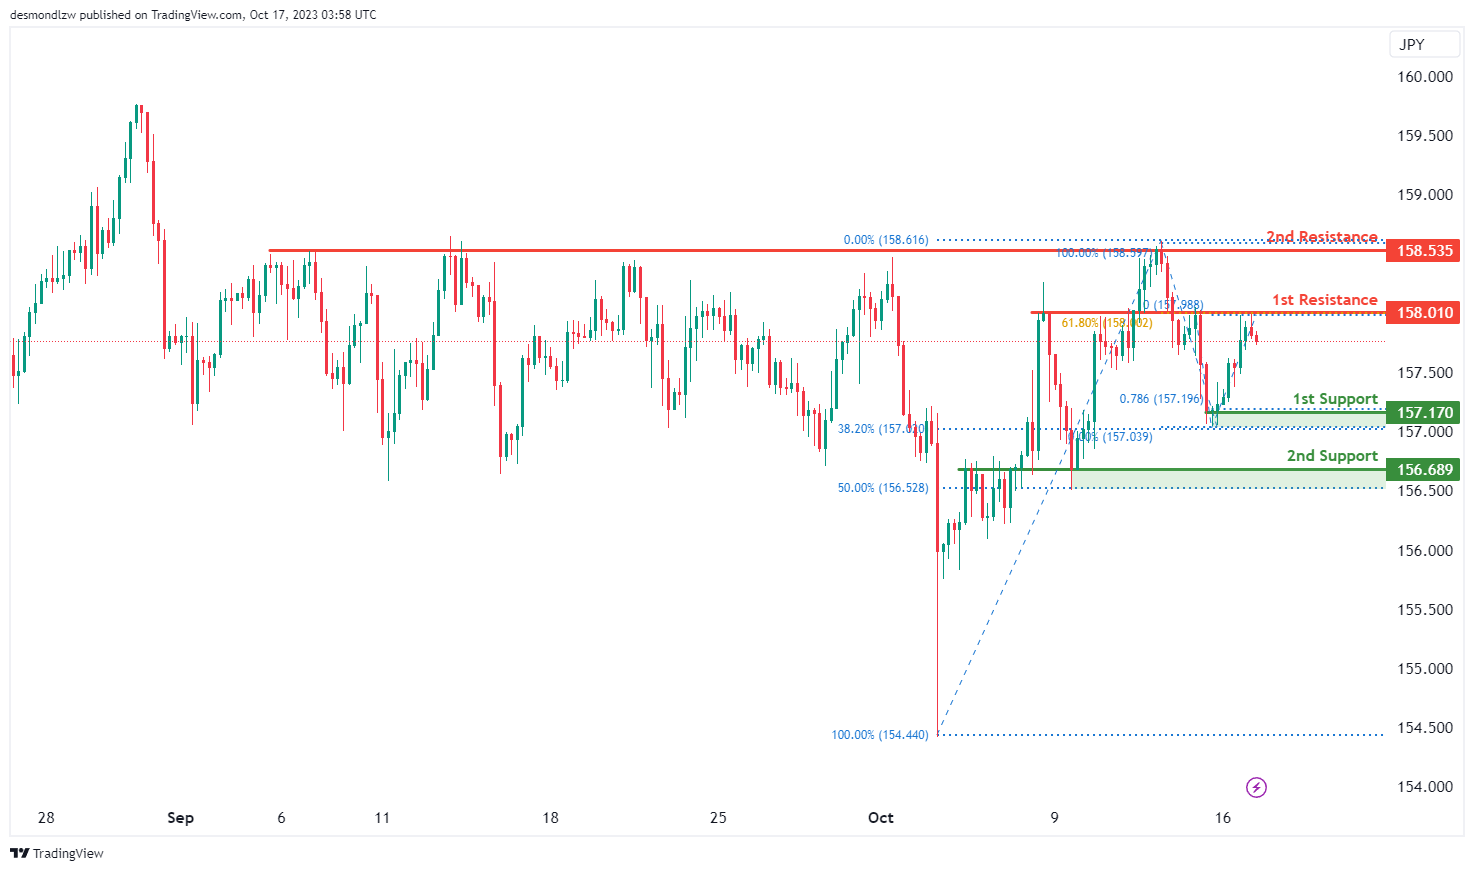
EUR/JPY:
The instrument being analyzed is EUR/JPY, and the current overall momentum of its chart is bearish.
There is a potential scenario where the price could make a bearish continuation towards the 1st support level, which is at 157.17.
The 1st support at 157.17 is considered significant for several reasons. It serves as a swing low support and coincides with both a 78.60% Fibonacci Projection and a 38.20% Fibonacci Retracement, indicating a strong confluence of Fibonacci levels. This suggests that 157.17 is a robust level of potential price support.
In addition, there is a 2nd support level at 156.68, which is also valuable because it acts as an overlap support and corresponds to a 50% Fibonacci Retracement. This reinforces its significance as a potential area of support in the analysis.
On the resistance side, the 1st resistance level at 158.01 is considered important because it represents an overlap resistance and aligns with a 61.80% Fibonacci Retracement. This level may act as a barrier to further price increases.
Moreover, there is a 2nd resistance level at 158.53, which is also significant as it represents a multi-swing high resistance. This resistance level may present a challenge to the price moving higher.
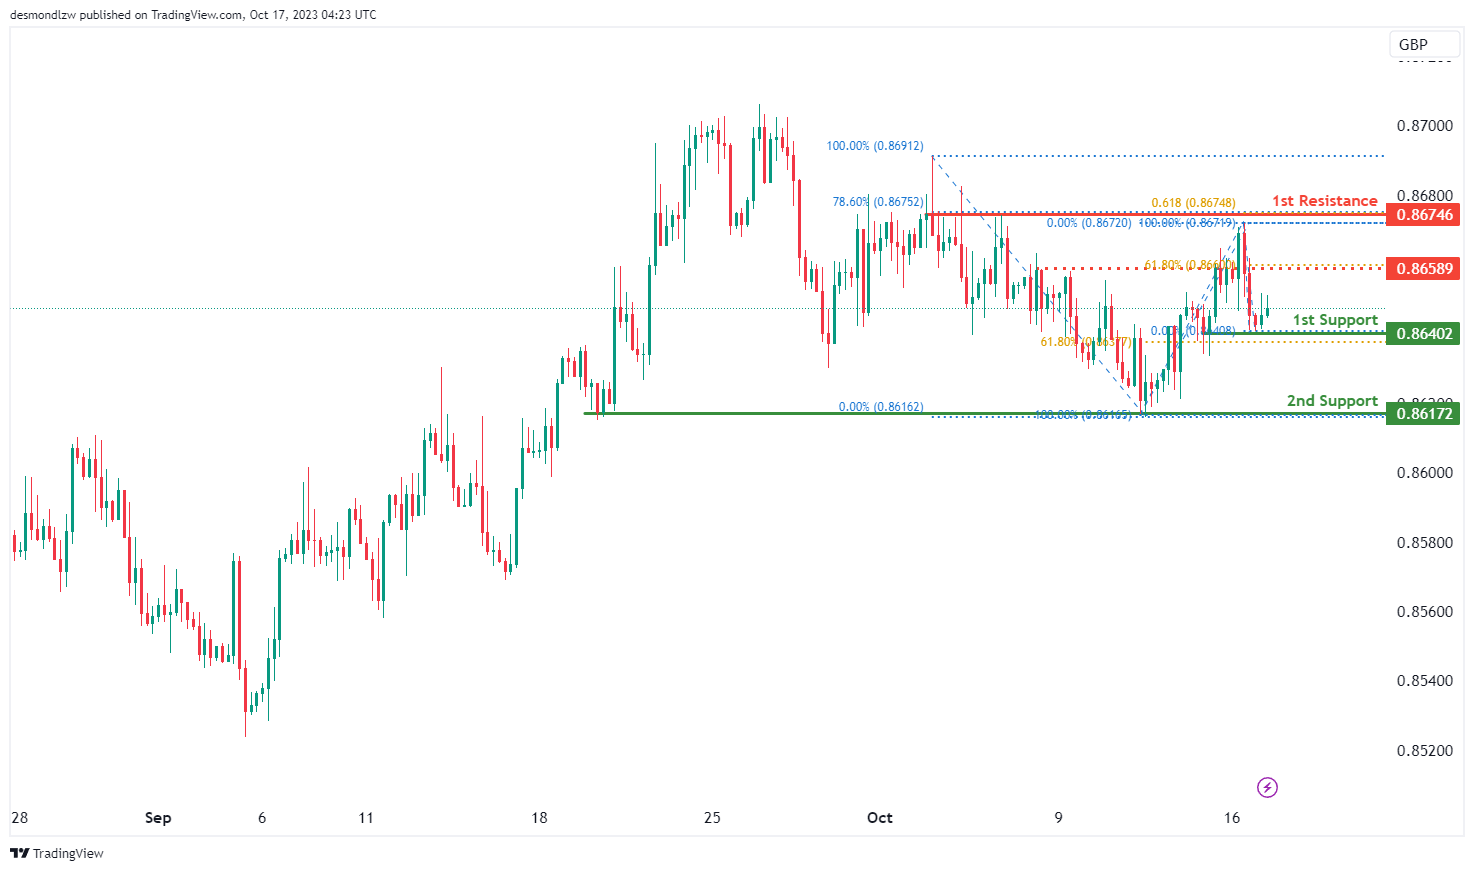
EUR/GBP:
The instrument being analyzed is EUR/GBP, and the current overall momentum of its chart is bullish.
There is a potential scenario where the price could make a bullish bounce off the 1st support level, which is at 0.8640, and head towards the 1st resistance level.
The 1st support at 0.8640 is considered significant for several reasons. It serves as a multi-swing low support and aligns with a 61.80% Fibonacci Retracement, indicating a strong confluence of technical factors that make it a potential area of price support.
Additionally, there is a 2nd support level at 0.8617, which also functions as a multi-swing low support, further adding to the potential areas of support in the analysis.
On the resistance side, the 1st resistance level at 0.8674 is considered important due to several factors. It represents a multi-swing high resistance and aligns with a 78.60% Fibonacci Retracement and a 61.80% Fibonacci Projection. This confluence of Fibonacci levels and resistance factors indicates that 0.8674 may pose a significant barrier to further price increases.
In addition, there is an intermediate resistance level at 0.8658, which is significant as it aligns with a 61.80% Fibonacci Retracement, further enhancing its importance in the chart analysis.
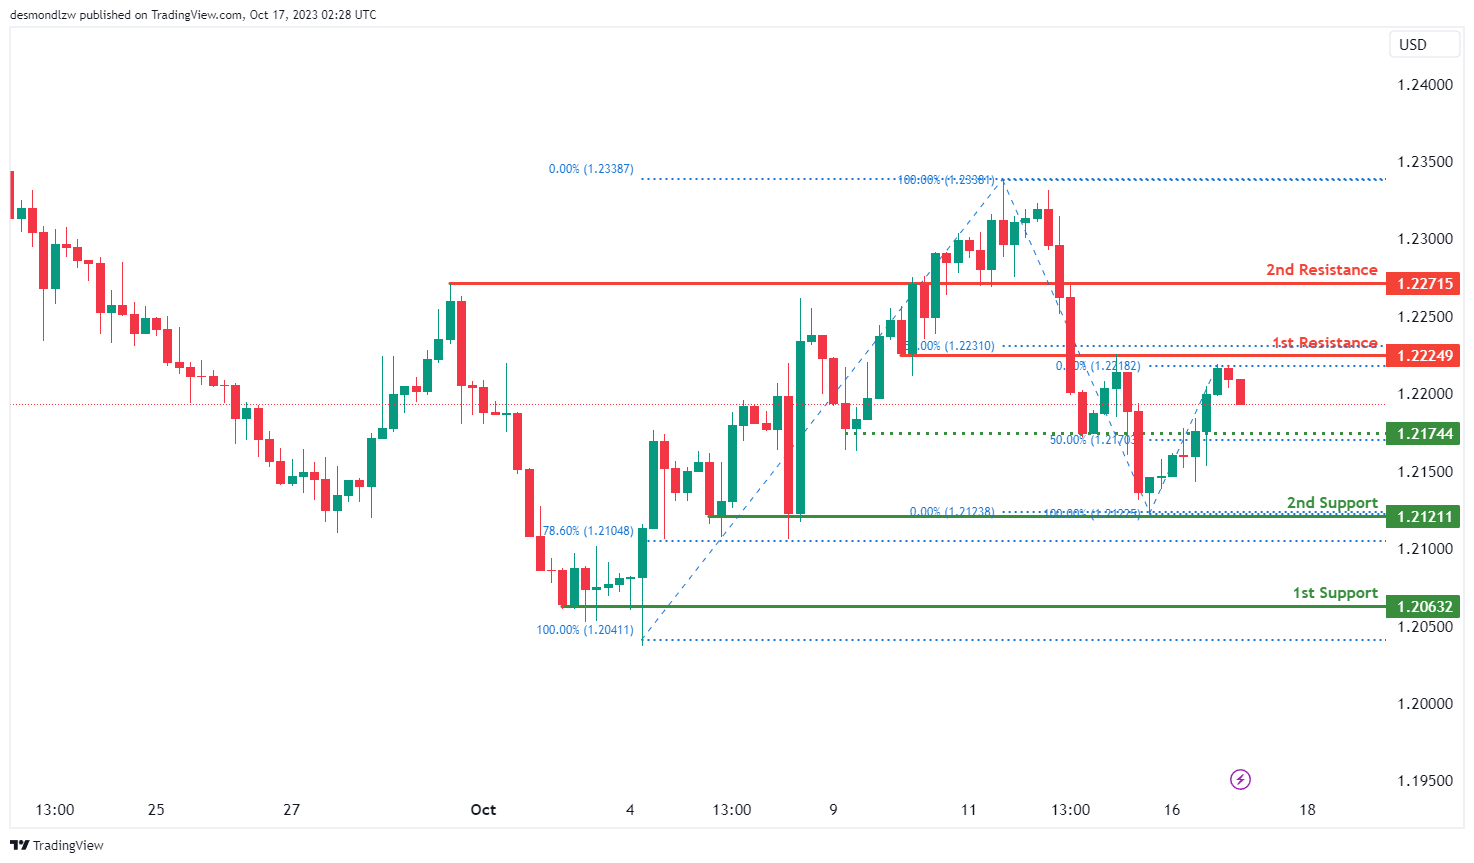
GBP/USD:
The GBP/USD chart currently exhibits bearish momentum, indicating the potential for a bearish continuation towards the 1st support level.
The 1st support at 1.2121 is considered significant as it aligns with a swing low support level and coincides with the 78.60% Fibonacci Retracement level, providing strong potential support for the price. Additionally, the 2nd support at 1.2063 is identified as a multi-swing low support, further reinforcing its credibility as a potential support area.
On the resistance side, the 1st resistance at 1.2224 is characterized as an overlap resistance level and aligns with the 50% Fibonacci Retracement level. This level could potentially act as a barrier to the bearish momentum. Similarly, the 2nd resistance at 1.2227 is identified as an overlap resistance.
Intermediate support is also noted at 1.2174, which is described as a pullback support level and aligns with the 50% Fibonacci Retracement level.
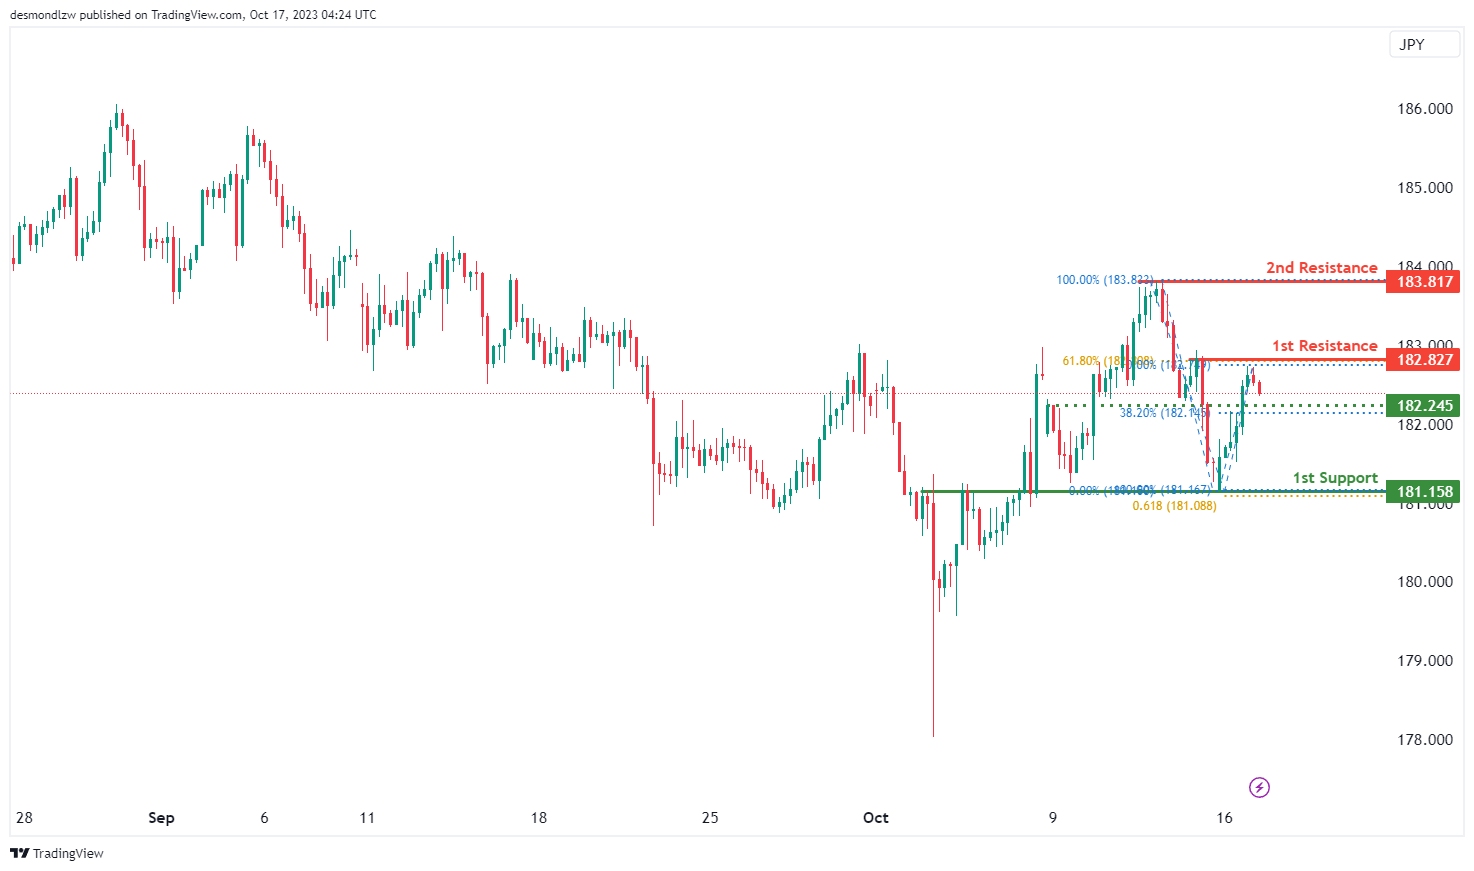
GBP/JPY:
The instrument being analyzed is GBP/JPY, and the current overall momentum of its chart is bearish.
In this analysis, there is a potential scenario where the price could make a bearish continuation towards the 1st support level, which is at 181.15.
The 1st support at 181.15 is considered significant for several reasons. It acts as an overlap support and aligns with a 61.80% Fibonacci Projection, indicating a strong technical confluence that makes it a notable area of potential price support.
Additionally, there is an intermediate support level at 182.24. This level is important because it serves as a pullback support and coincides with a 38.20% Fibonacci Retracement, enhancing its significance as a potential support level in the analysis.
On the resistance side, the 1st resistance level at 182.82 is considered important due to several factors. It represents a swing high resistance and aligns with a 61.80% Fibonacci Retracement, which may act as a barrier to further price increases.
Moreover, there is a 2nd resistance level at 183.81, which is significant as it serves as a swing high resistance, indicating a potential challenge for the price moving higher.
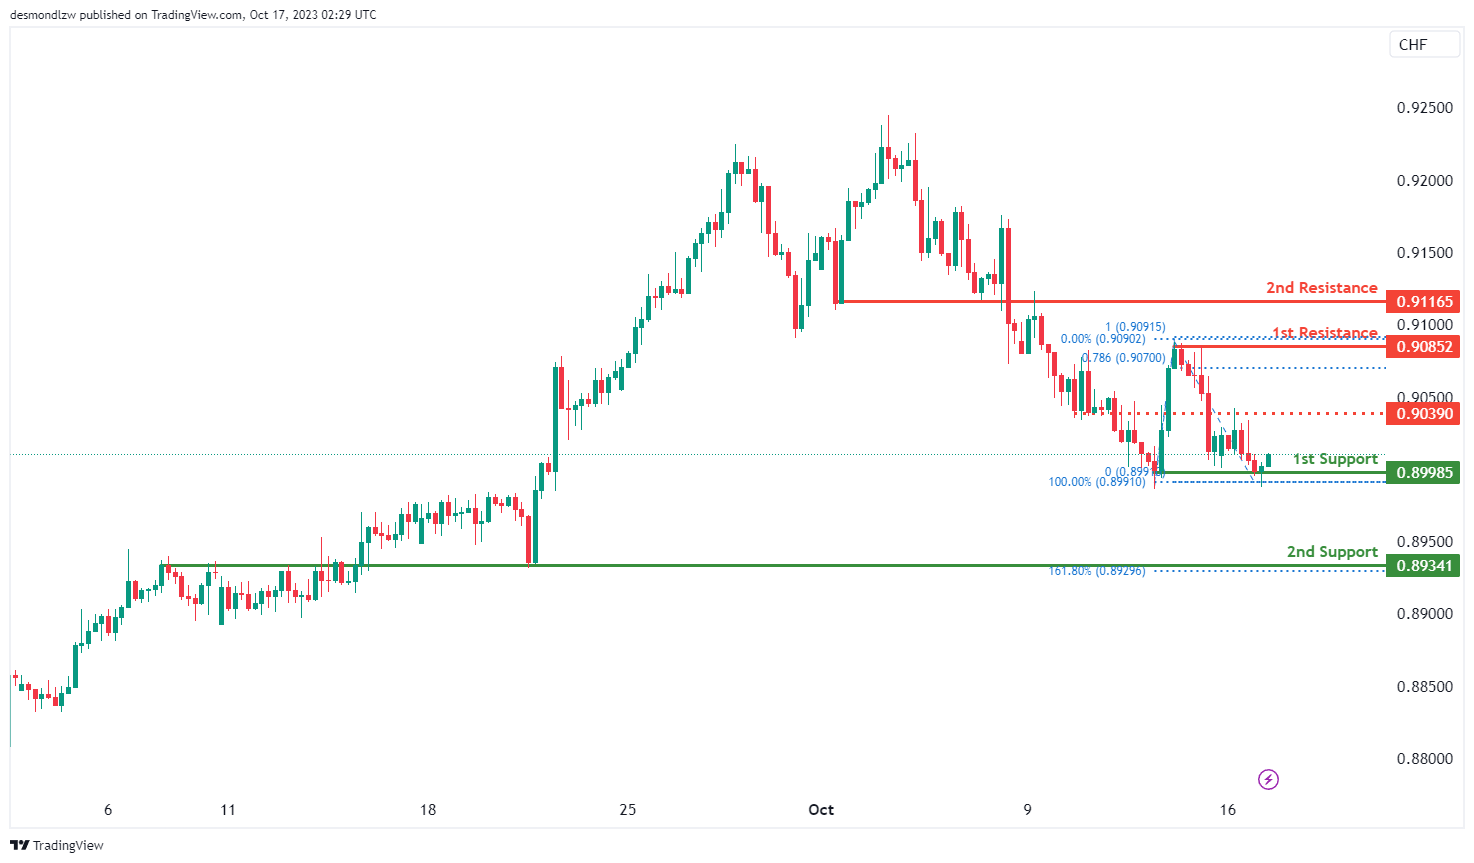
USD/CHF:
The USD/CHF chart currently exhibits bullish momentum, with the potential scenario of a bullish bounce off the 1st support level towards the 1st resistance.
The 1st support at 0.8998 is considered significant as it aligns with a swing low support level. Additionally, the 2nd support at 0.8934 is identified as an overlap support and coincides with the 161.80% Fibonacci Retracement level, providing a strong foundation of potential support.
On the resistance side, the 1st resistance at 0.9085 is characterized as a multi-swing high resistance level, and beyond this, the 2nd resistance at 0.9116 is identified as an overlap resistance. An intermediate resistance at 0.9039 is also noted as an overlap resistance.
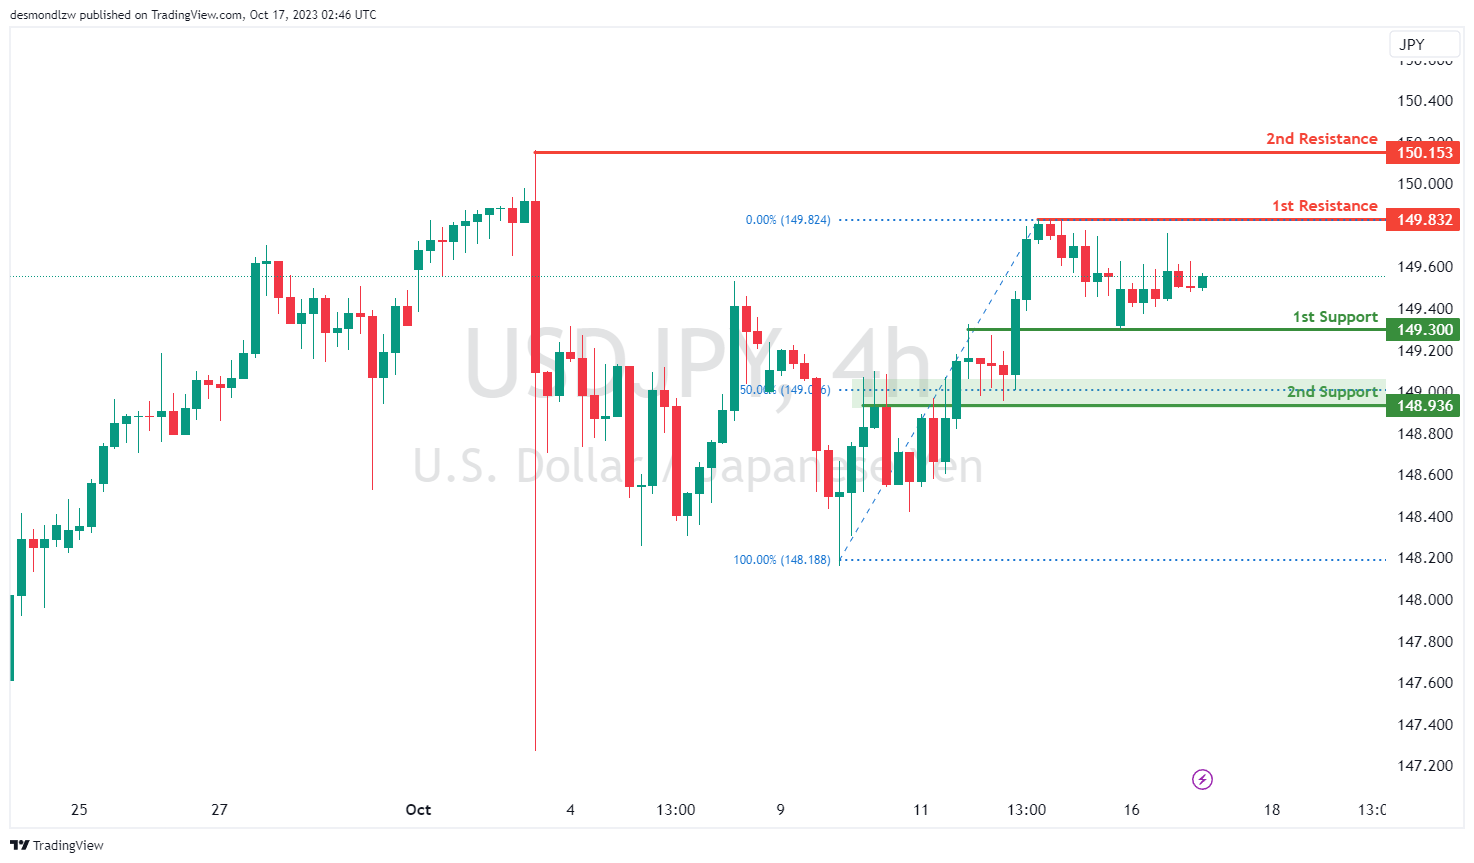
USD/JPY:
The USD/JPY chart currently displays bullish momentum, with the potential scenario of a bullish continuation towards the 1st resistance level.
The 1st support at 149.30 is considered significant, as it aligns with an overlap support level. Additionally, the 2nd support at 148.93 is identified as an overlap support and coincides with the 50% Fibonacci Retracement level, providing a strong foundation of potential support.
On the resistance side, the 1st resistance at 149.83 is characterized as a multi-swing high resistance level. Beyond this, the 2nd resistance at 150.15 is noted as a swing high resistance.
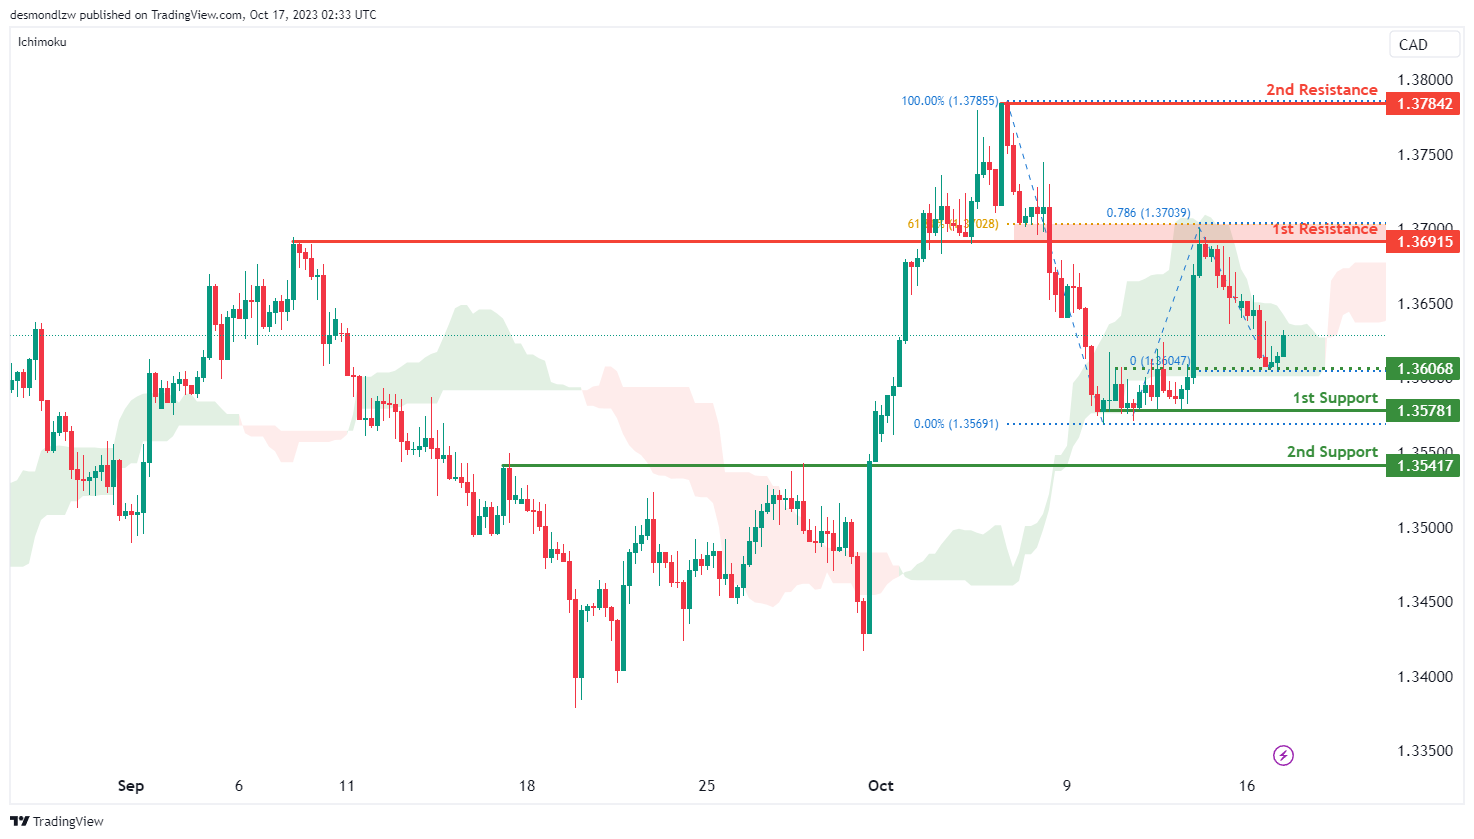
USD/CAD:
The USD/CAD chart currently exhibits a bullish momentum, with price finding support within the bullish Ichimoku cloud. There is a potential scenario for price to make a bullish continuation towards the 1st resistance level.
The 1st resistance level at 1.3692 is identified as an overlap resistance that aligns with a confluence of Fibonacci levels i.e. the 61.80% retracement and the 78.60% projection levels. Higher up, the 2nd resistance level at 1.3784 is noted as a swing-high resistance, potentially acting as a barrier to further bullish advances.
To the downside, the intermediate support level at 1.3607 is identified as an overlap support while the 1st support level at 1.3578 is marked as a pullback support. Additionally, the 2nd support level at 1.3542 is also noted as a pullback support, adding to its significance as a potential support zone.
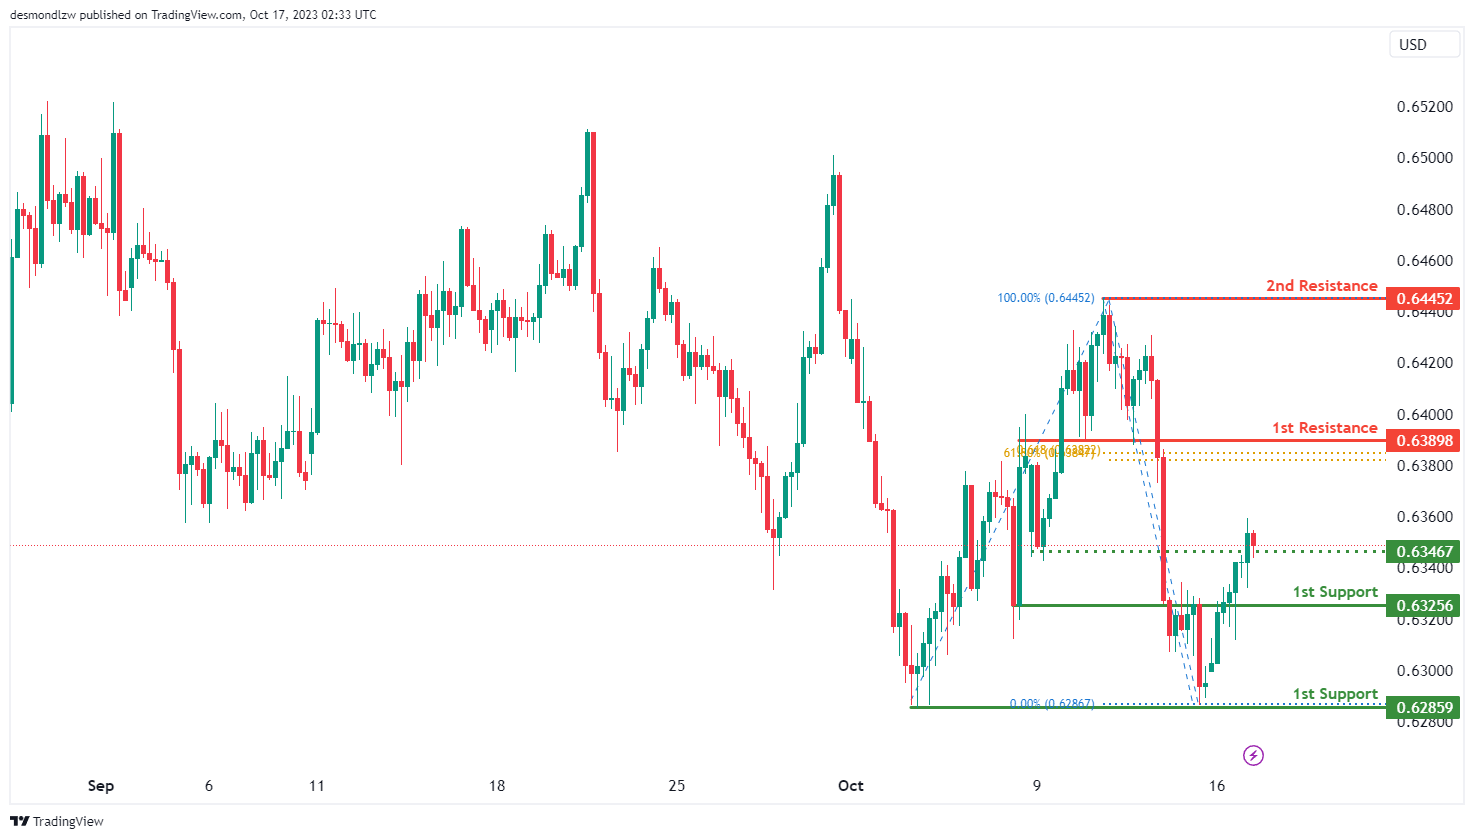
AUD/USD:
The AUD/USD chart currently exhibits a bullish momentum, indicating a potential scenario of a bullish continuation towards the 1st resistance level.
The 1st resistance level at 0.6389 is identified as an overlap resistance that aligns with a confluence of Fibonacci levels i.e. the 61.80% retracement and the 61.80% projection levels. Beyond this, the 2nd resistance level at 0.6445 is noted as a swing-high resistance, making it a potentially strong resistance level.
To the downside, the intermediate support level at 0.6347 is identified as a pullback support while the 1st support level at 0.6326 is noted as an overlap support. Additionally, the 2nd support level at 0.6286 is marked as a multi-swing-low support, further reinforcing its importance as a potential support area.
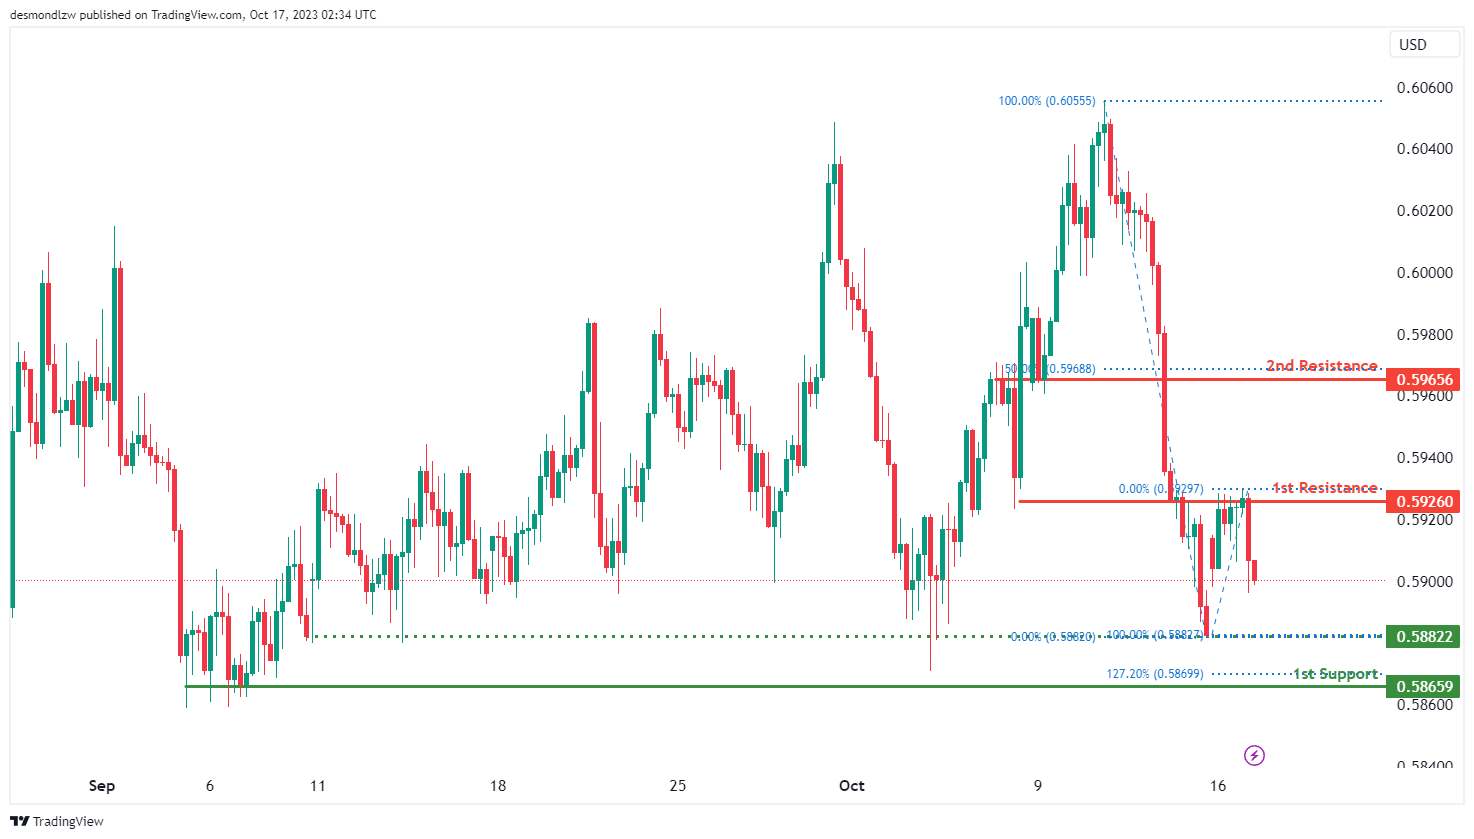
NZD/USD
The NZD/USD chart currently exhibits a bearish momentum, suggesting a potential scenario for price to make a bearish continuation towards the 1st support level should price break under the intermediate support.
The intermediate support level at 0.5882 is identified as a pullback support while the 1st support level at 0.5866 is also noted as pullback support that aligns close to the 127.20% Fibonacci extension level, indicating a potential support zone.
To the upside, the 1st resistance level at 0.5926 is identified as an overlap resistance. Beyond this, the 2nd resistance level at 0.5966 is also marked as an overlap resistance that aligns with the 50.00% Fibonacci retracement level, making it a potentially strong resistance level.
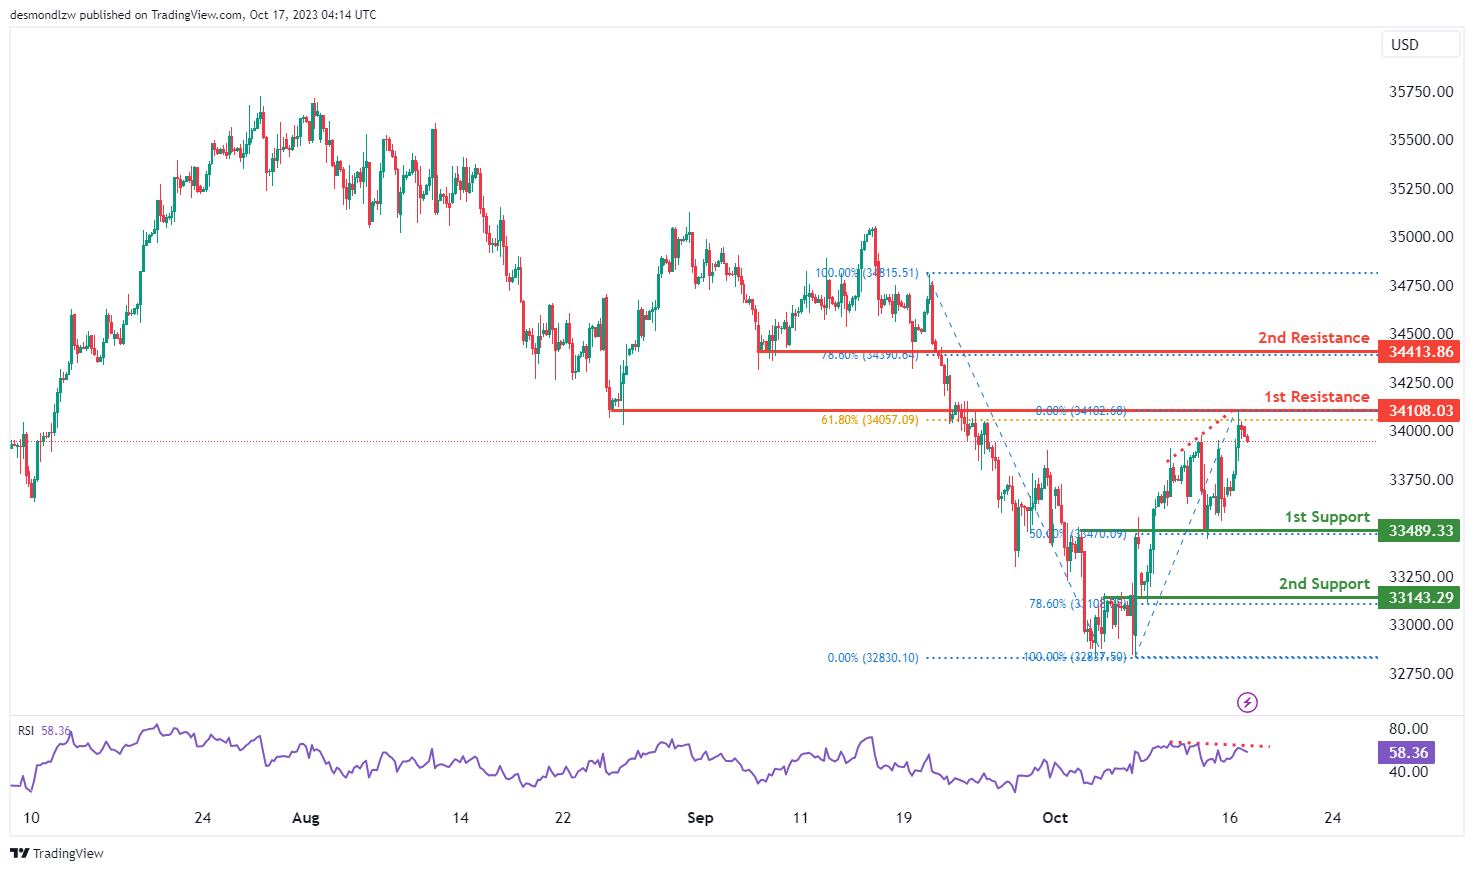
DJ30:
The instrument under analysis is DJ30, and the current overall momentum of its chart is bearish.
There is a potential scenario where the price could experience a bearish continuation towards the 1st support level, which is at 33489.33. This level is significant because it serves as an overlap support and corresponds to a 50% Fibonacci Retracement level, indicating a potential area of price support.
Additionally, there is a 2nd support level at 33143.29, which is also valuable as it functions as an overlap support and aligns with a 78.60% Fibonacci Retracement. This further enhances its significance in the analysis.
On the resistance side, the 1st resistance level at 34108.03 is considered important because it represents an overlap resistance and aligns with a 61.80% Fibonacci Retracement. This level may act as a barrier to further price increases.
Furthermore, there is a 2nd resistance level at 34413.86, which holds significance as it represents a pullback resistance and coincides with a 78.60% Fibonacci Retracement, potentially adding to its significance in the chart analysis.
Additionally, the Relative Strength Index (RSI) is displaying a bearish divergence versus the price. This divergence suggests that there is a discrepancy between the RSI’s behavior and the price movement, indicating a possible rapid decline in price. This bearish divergence adds to the overall bearish sentiment and suggests that the price may continue its downward trajectory.
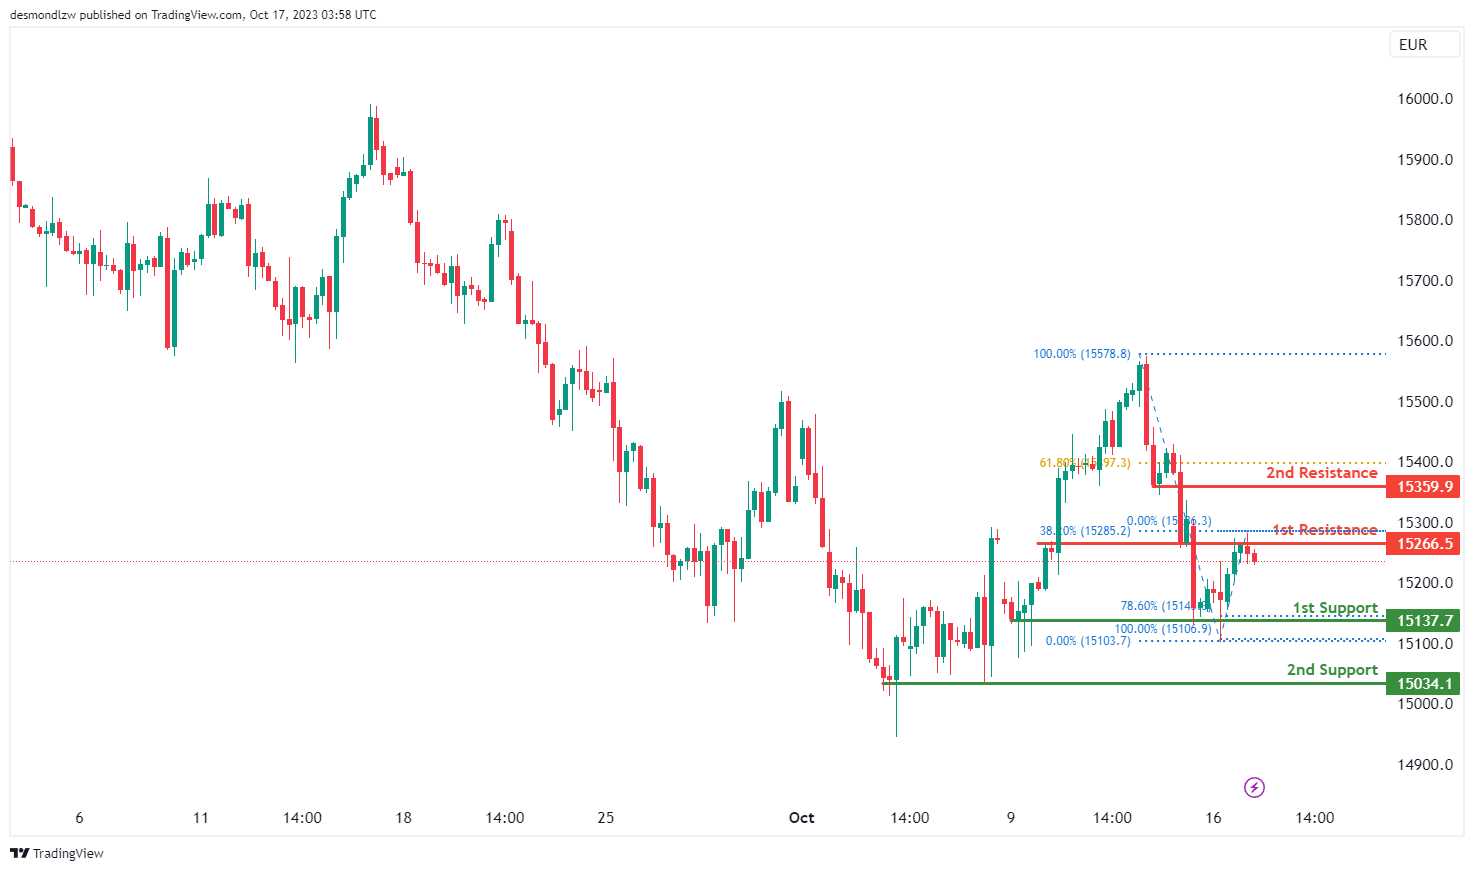
GER40:
The instrument being analyzed is GER40, and the current overall momentum of its chart is bearish.
There is a potential scenario where the price could make a bearish continuation towards the 1st support level, which is at 15137.70.
The 1st support at 15137.70 is considered significant because it represents a multi-swing low support and aligns with a 78.60% Fibonacci Retracement. This level provides a potential area of support for the price.
Additionally, there is a 2nd support level at 15034.10, which is also valuable as it functions as a multi-swing low support. This support level adds to the potential areas of price support.
On the resistance side, the 1st resistance level at 15266.50 is considered important because it represents an overlap resistance. This level coincides with a 38.20% Fibonacci Retracement, indicating that it might act as a barrier to further price increases.
Furthermore, there is a 2nd resistance level at 15359.90, which is also significant as it represents a pullback resistance. This resistance level aligns with a 61.80% Fibonacci Retracement, potentially adding to its significance in the chart analysis.
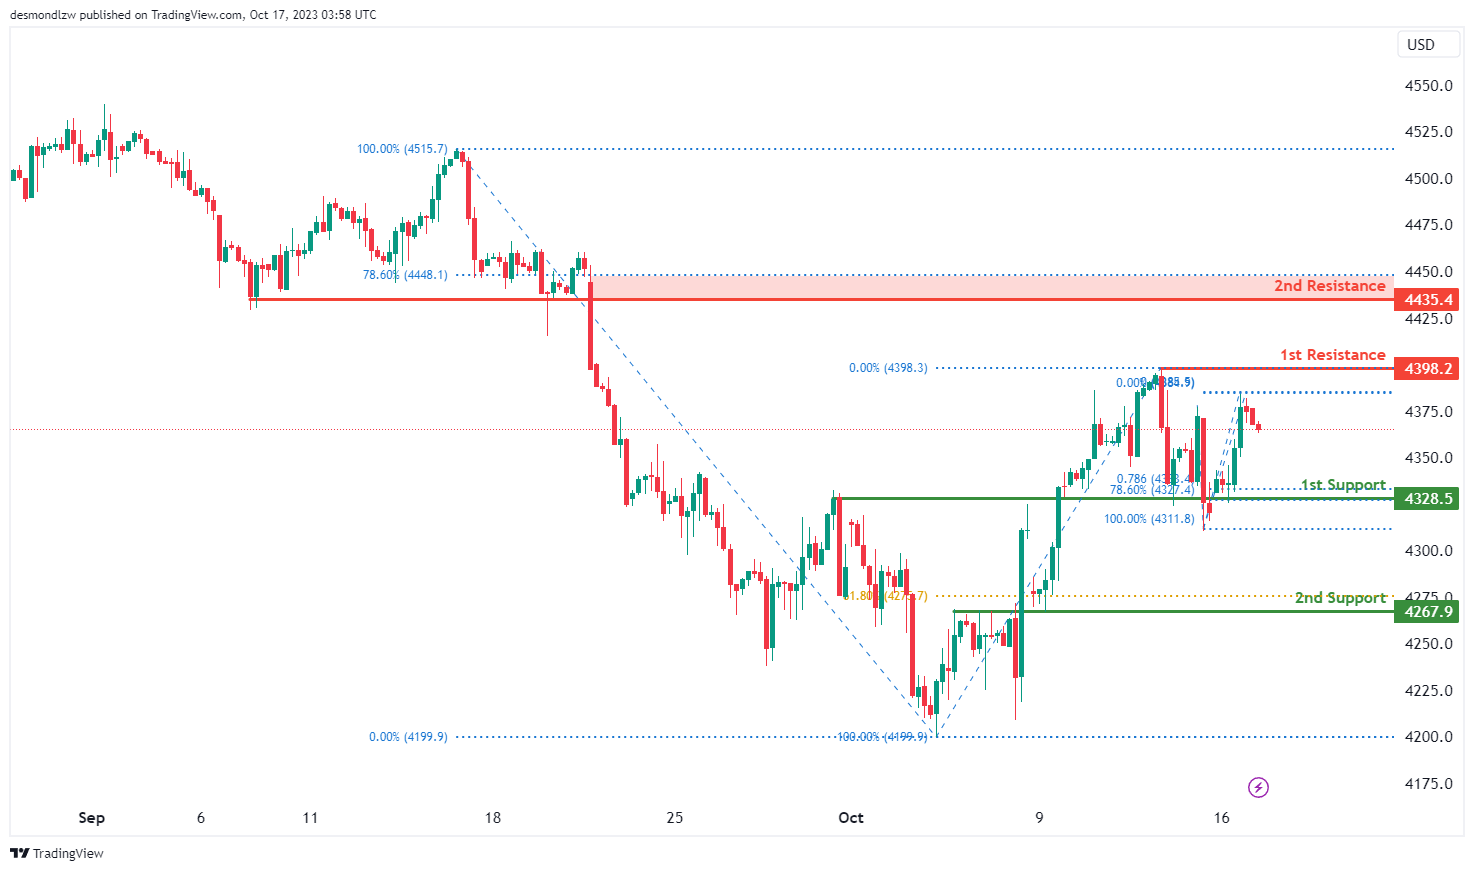
US500
The instrument being analyzed is US500, and the current overall momentum of its chart is bearish.
There is a potential scenario where the price could make a bearish continuation towards the 1st support level, which is at 4328.5.
The 1st support at 4328.5 is considered significant for several reasons. It acts as an overlap support, and, notably, it coincides with both a 78.60% Fibonacci Retracement and a 78.60% Fibonacci Projection. This confluence of Fibonacci levels adds to its significance in the analysis and indicates a strong potential area of price support.
In addition, there is a 2nd support level at 4267.9, which is also valuable as it functions as an overlap support and aligns with a 61.80% Fibonacci Retracement. This further enhances its importance in the analysis as a potential support level.
On the resistance side, the 1st resistance level at 4398.2 is considered important because it represents a swing high resistance, indicating a potential area where the price might encounter resistance.
Moreover, there is a 2nd resistance level at 4435.4, which is also significant as it represents a pullback resistance. This level aligns with a 78.60% Fibonacci Retracement, adding to its significance in the chart analysis.
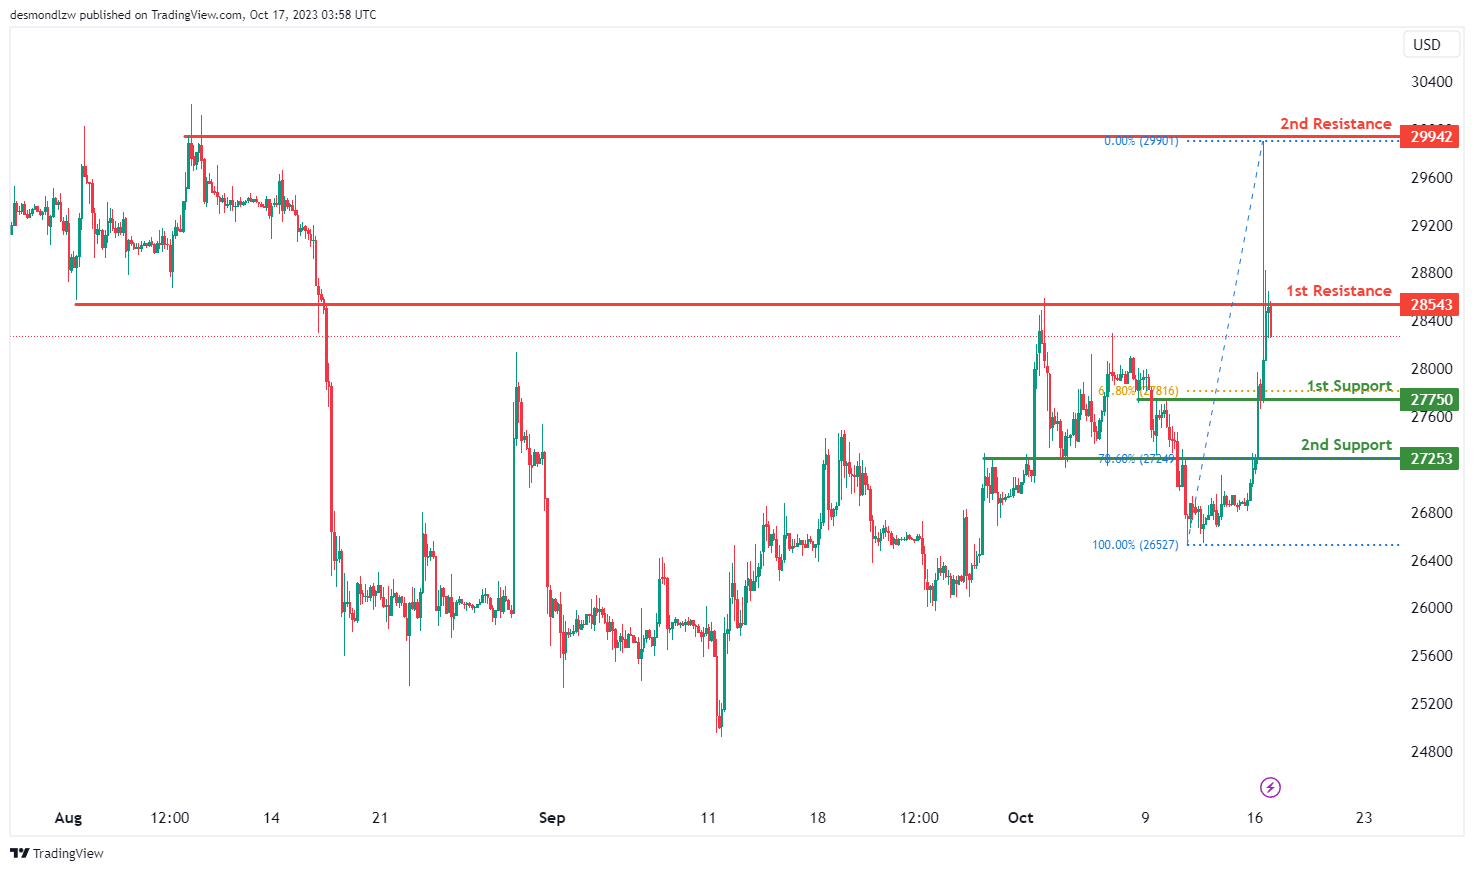
BTC/USD:
The instrument being analyzed is BTC/USD, and the current overall momentum of its chart is bearish.
There is a potential scenario where the price could make a bearish continuation towards the 1st support level, which is at 27750.
The 1st support at 27750 is considered significant because it acts as an overlap support and coincides with a 61.80% Fibonacci Retracement level, providing a potential level of price support.
In addition, there is a 2nd support level at 27253, which is also valuable because it functions as a pullback support and aligns with a 78.60% Fibonacci Retracement. This further enhances its significance in the analysis.
On the resistance side, the 1st resistance level at 28543 is considered important because it represents an overlap resistance, indicating a potential area where the price might encounter resistance.
Moreover, there is a 2nd resistance level at 29942, which is also significant as it represents a multi-swing high resistance in the chart analysis. This level may act as an additional barrier to price increases, contributing to the overall bearish outlook.
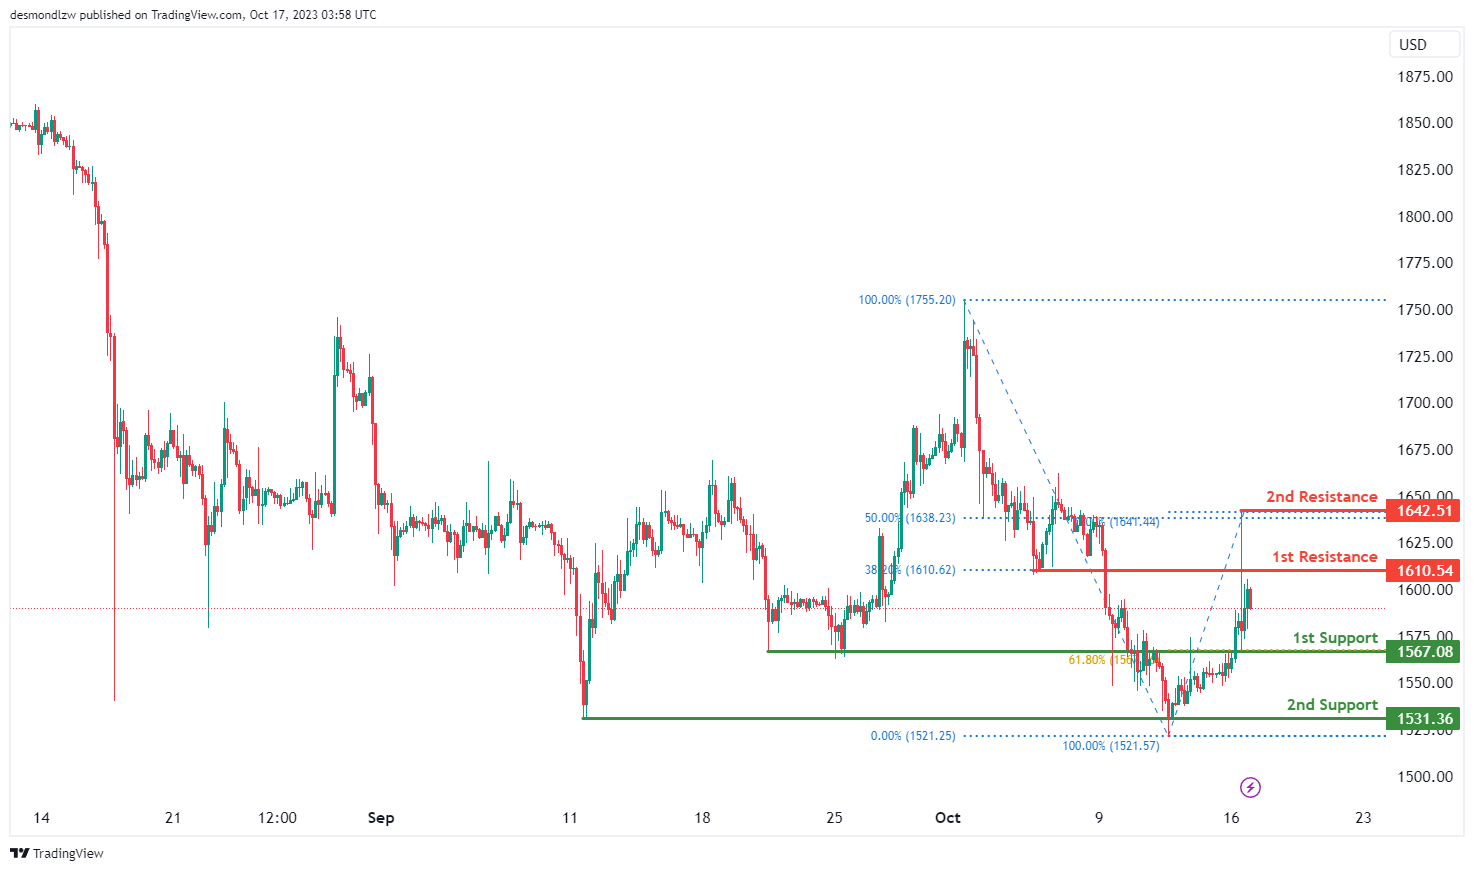
ETH/USD:
The instrument being analyzed is ETH/USD, and the current overall momentum of its chart is bearish.
There is a potential scenario where the price could make a bearish continuation towards the 1st support level, which is at 1567.08.
The 1st support at 1567.08 is considered significant because it acts as an overlap support and corresponds to a 61.80% Fibonacci Retracement level, providing a potential level of price support.
In addition, there is a 2nd support level at 1531.36, which is also valuable as it functions as a multi-swing low support. This level can provide additional support for the price in its bearish movement.
On the resistance side, the 1st resistance level at 1610.54 is considered important because it represents an overlap resistance. This level may act as a barrier to further price increases.
Moreover, there is a 2nd resistance level at 1642.51, which is also significant as it represents a swing high resistance and aligns with a 50% Fibonacci Retracement, potentially adding to its significance in the chart analysis.
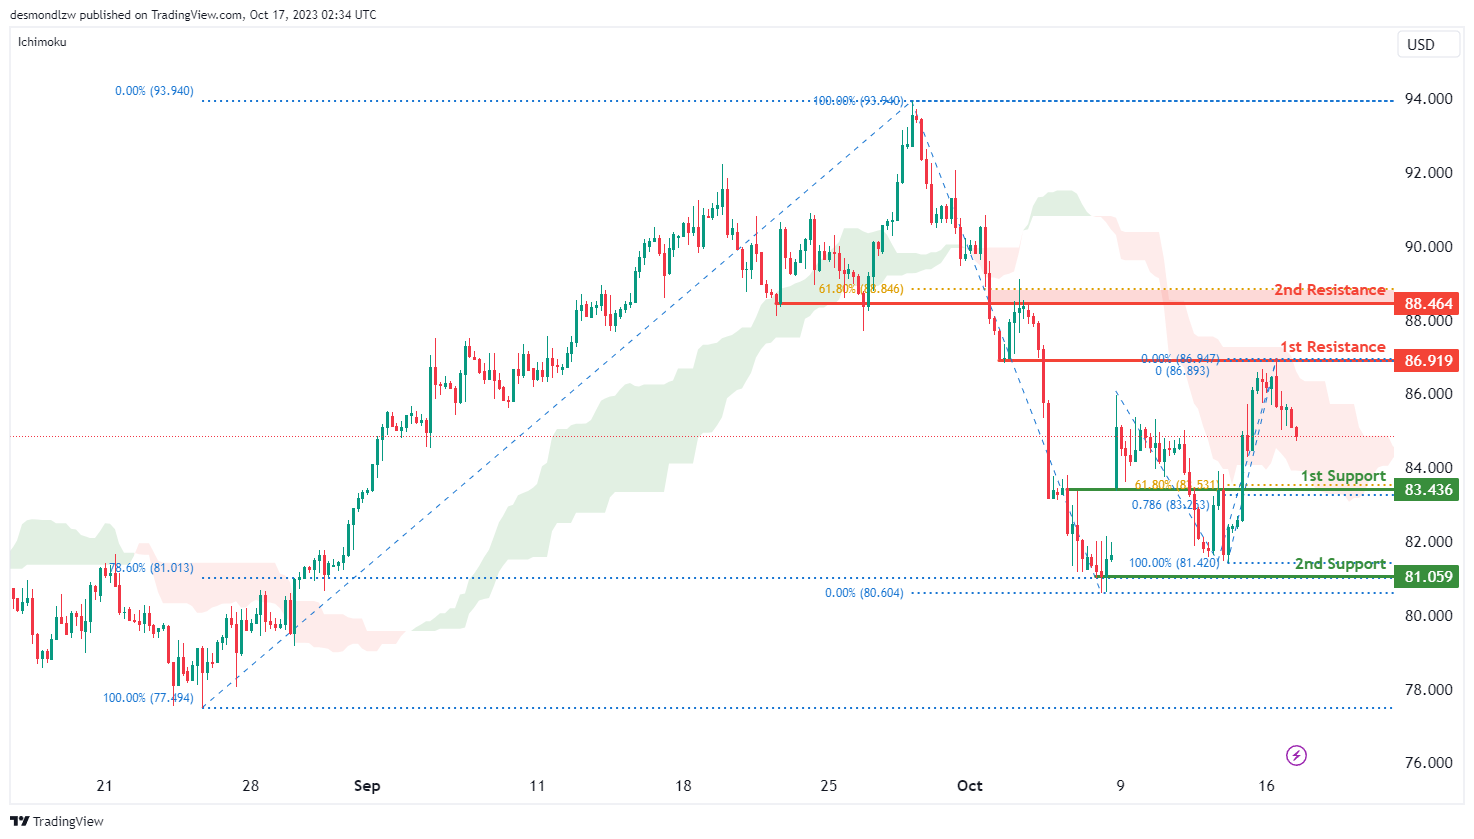
WTI/USD:
The WTI chart currently shows a bearish momentum with price running into resistance within the bearish Ichimoku cloud, indicating a potential scenario for price to make a bearish continuation towards the 1st support.
The 1st support level at 83.44 is identified as an overlap support level that aligns with a confluence of Fibonacci levels i.e. the 61.80% retracement and the 78.60% projection levels. Additionally, the 2nd support level at 81.06 is noted as pullback support that aligns with the 78.60% Fibonacci retracement level, further reinforcing its credibility as a potential support area.
To the upside, the 1st resistance level at 86.92 is identified as an overlap resistance. Beyond this, the 2nd resistance level at 88.46 is also marked as an overlap resistance level that aligns close to the 61.80% Fibonacci retracement level.
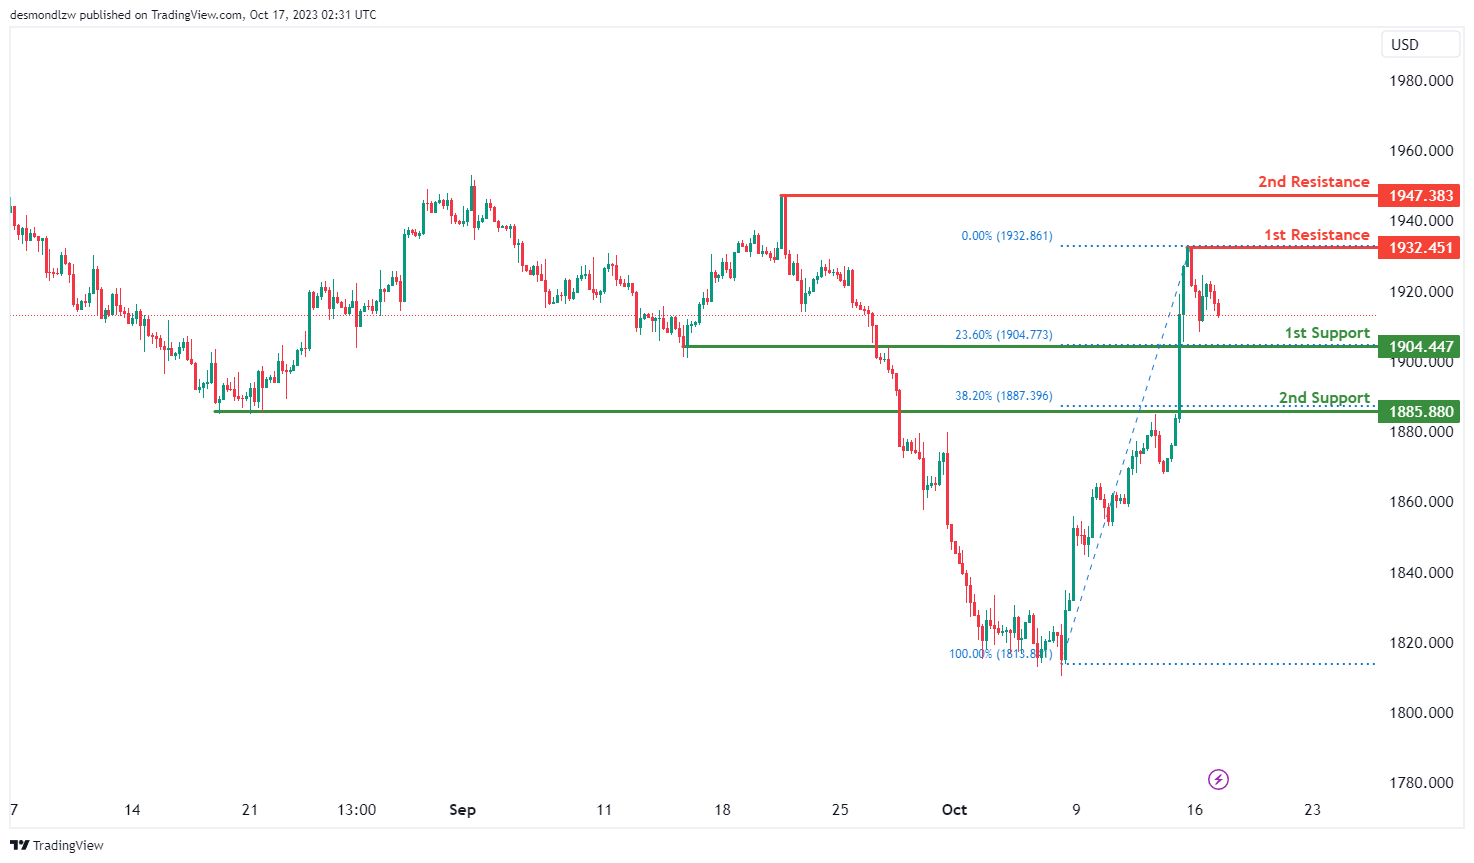
XAU/USD (GOLD):
The XAU/USD chart currently indicates bearish momentum, with the potential scenario of a bearish continuation towards the 1st support level.
The 1st support at 1904.44 is considered significant as it aligns with a pullback support level and corresponds to the 23.60% Fibonacci Retracement level. Additionally, the 2nd support at 1885.88 is identified as a pullback support and coincides with the 38.20% Fibonacci Retracement level, providing a strong foundation of potential support.
On the resistance side, the 1st resistance at 1932.45 is characterized as a swing high resistance level. Beyond this, the 2nd resistance at 1947.38 is noted as another swing high resistance.


