
DXY:
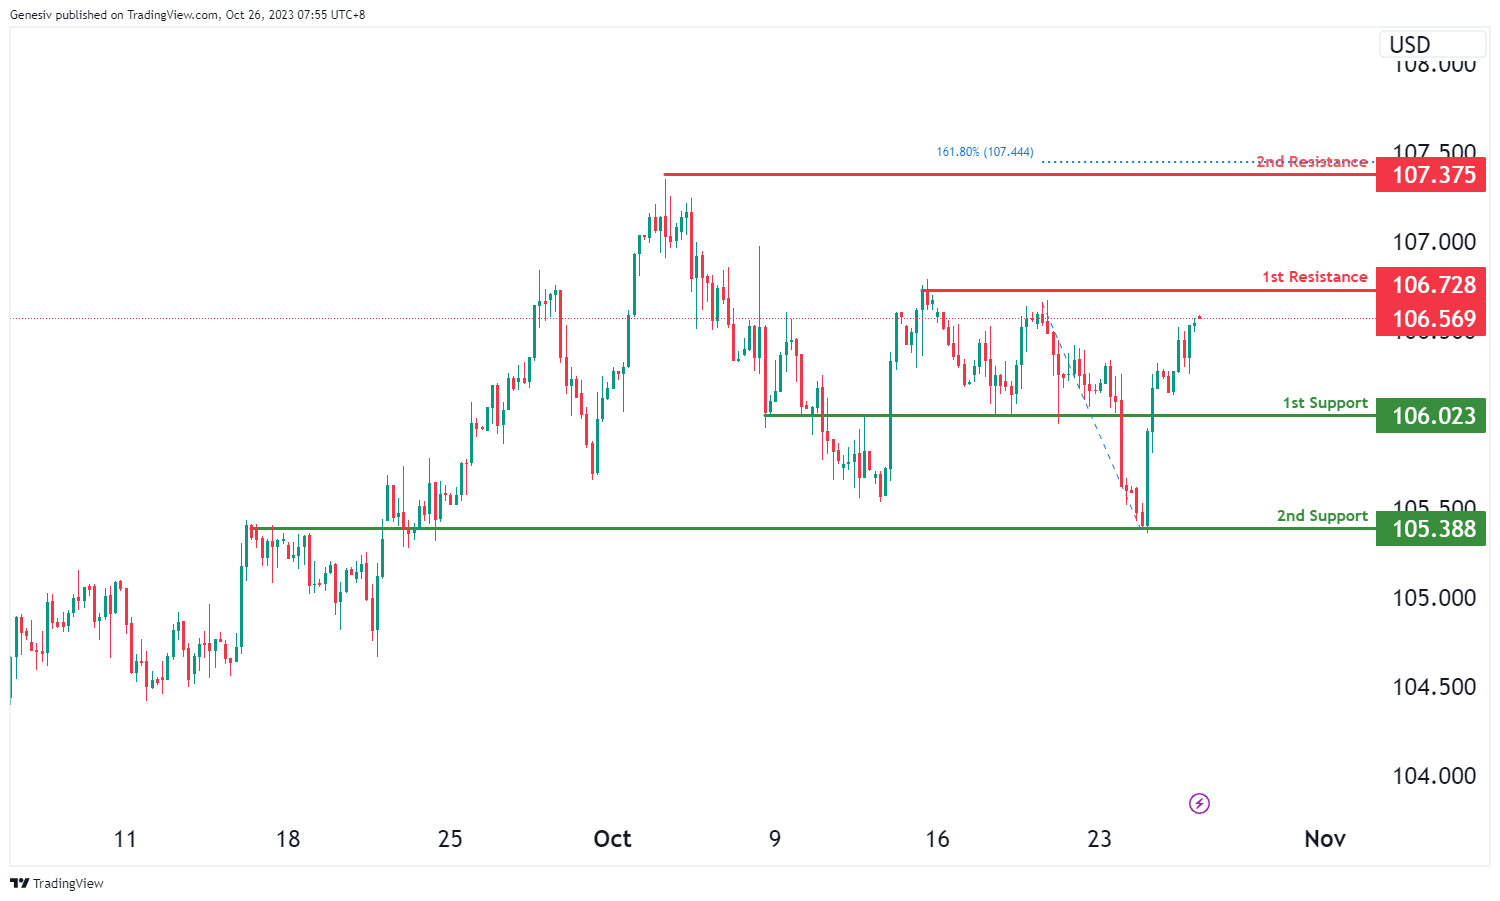
The DXY (US Dollar Index) chart currently exhibits a bullish overall momentum, indicating the potential for a bullish continuation towards the 1st resistance level.
The 1st support at 106.02 is considered a significant level as it aligns with a pullback support, suggesting it may provide a foundation of potential price support. Furthermore, the 2nd support at 105.38 is identified as an overlap support, reinforcing the potential for it to act as a support level.
On the resistance side, the 1st resistance at 106.72 is characterized as a swing high resistance level, indicating that it may serve as a notable barrier to upward price movement. Additionally, the 2nd resistance at 107.37 is identified as a swing high resistance and is associated with the 161.80% Fibonacci Extension level, further emphasizing its potential resistance significance.
EUR/USD:
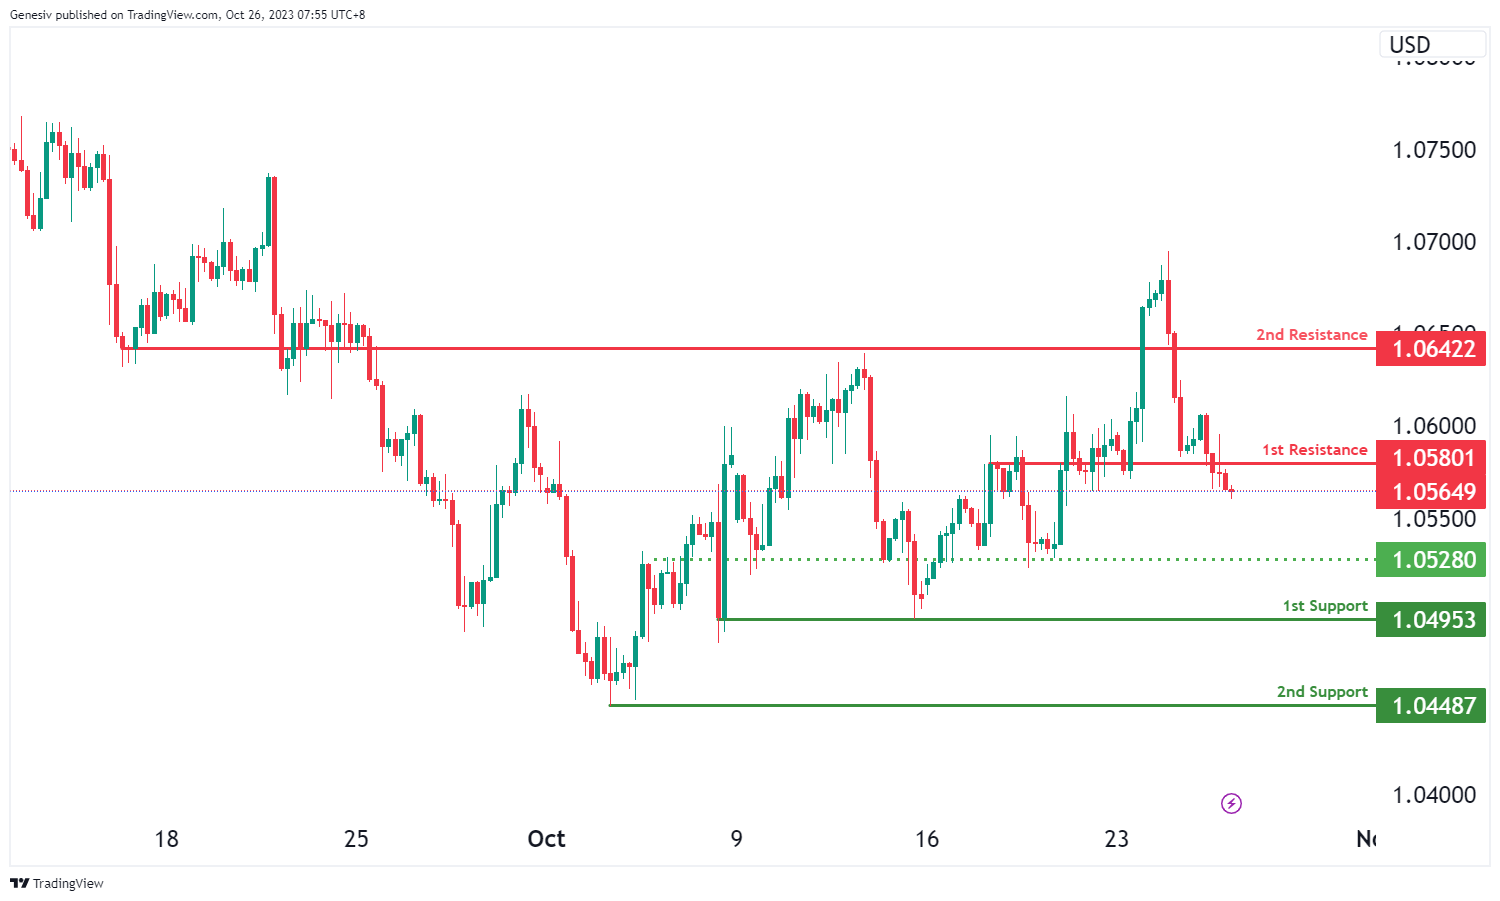
The EUR/USD chart currently shows a bearish overall momentum, and there is a potential scenario for a bearish continuation towards the 1st support level.
The 1st support at 1.0495 is considered significant as it aligns with a multi-swing low support level, indicating a strong potential area of price support. Additionally, the 2nd support at 1.0448 is identified as a swing low support, further reinforcing the potential for it to act as a support level.
On the resistance side, the 1st resistance at 1.0580 is characterized as an overlap resistance level, suggesting that it may serve as a notable barrier to upward price movement. Furthermore, the 2nd resistance at 1.0642 is identified as a pullback resistance level, indicating potential resistance significance.
An intermediate support level at 1.0528 is also mentioned as an overlap support, providing additional insights into potential price support zones.
EUR/JPY:
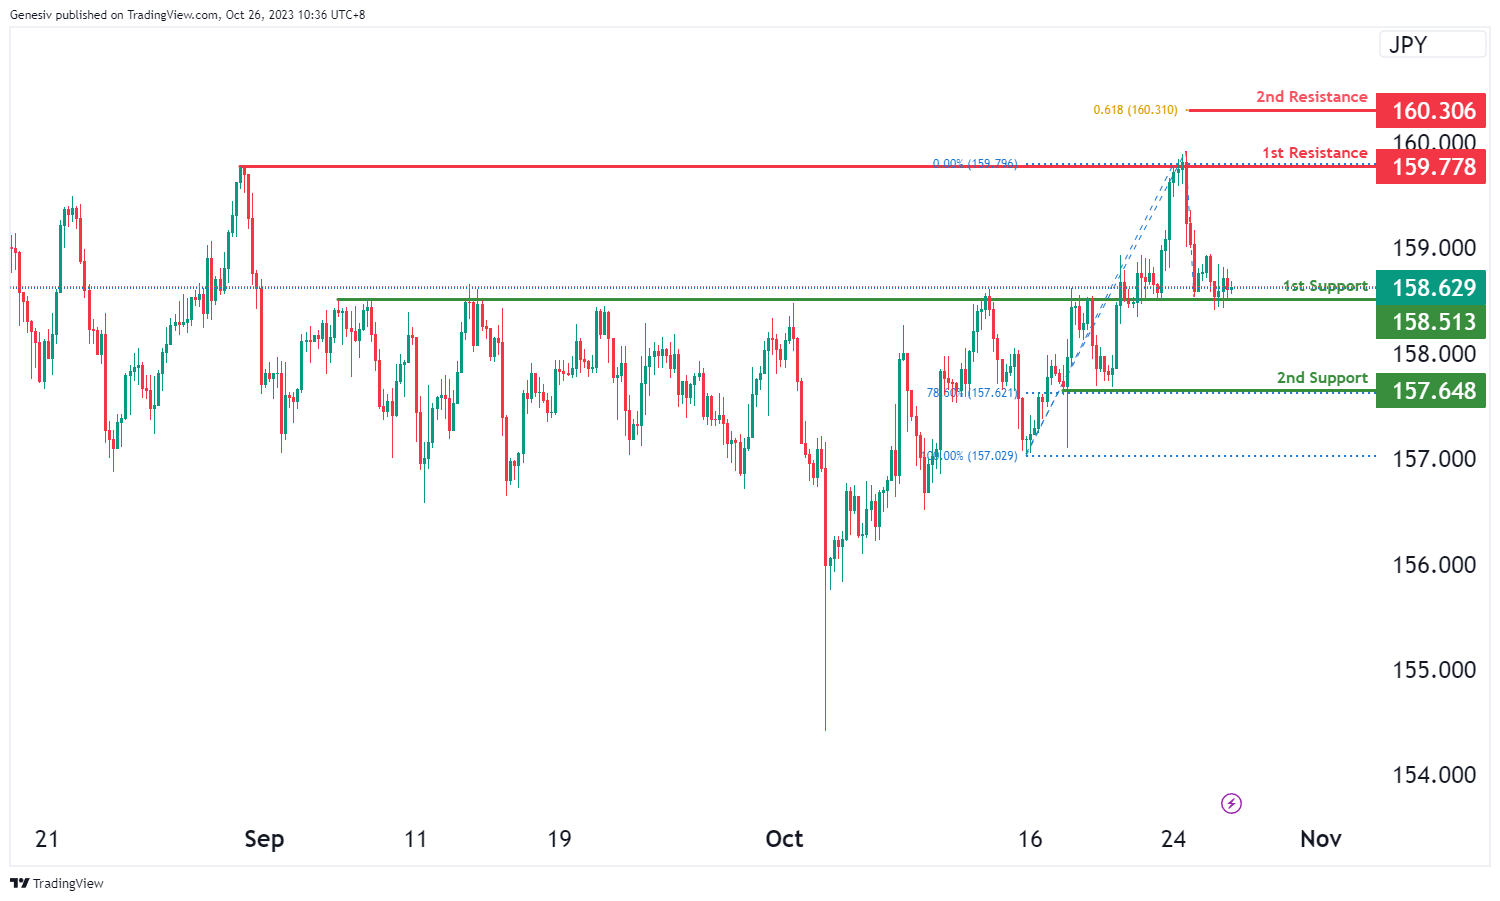
The EUR/JPY instrument is currently demonstrating a bullish overall momentum on the chart. There is potential for a bullish breakout through the first resistance at 159.77, with the expectation of the price rising to the second resistance at 160.30.
The first support at 158.51 is deemed strong due to its overlap support characteristics. The second support at 157.64 is significant as it features multi-swing low support and is also associated with the 78.60% Fibonacci Retracement.
Conversely, the first resistance at 159.77 is noteworthy for its multi-swing high resistance properties. The second resistance at 160.30 is significant due to the presence of the 61.80% Fibonacci Projection.
EUR/GBP:
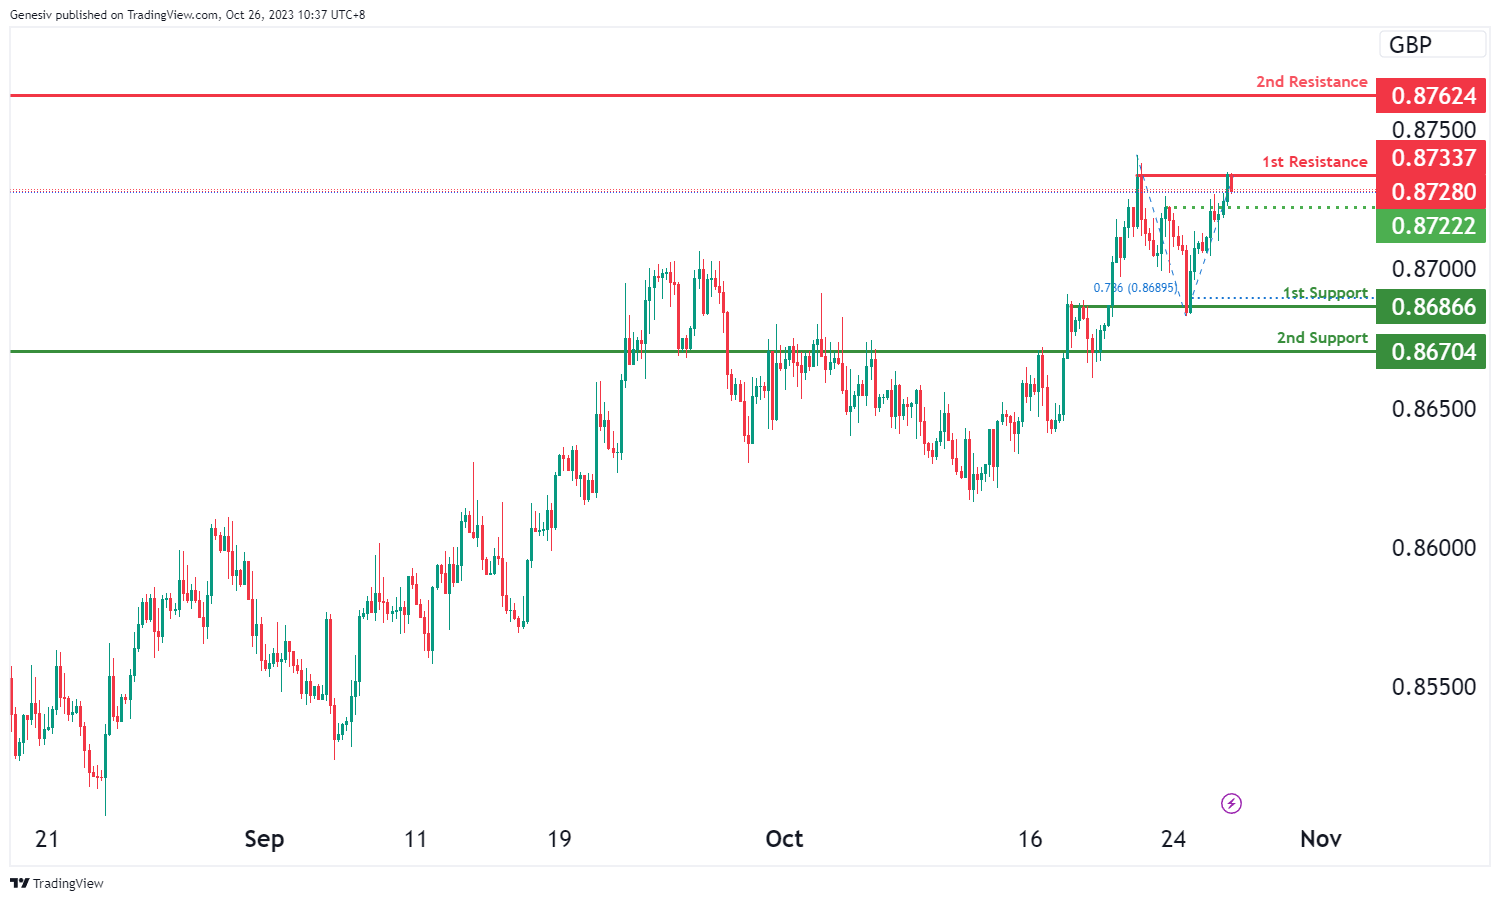
For the EUR/GBP instrument, the chart currently exhibits a bearish overall momentum, suggesting a potential bearish continuation in price movement towards the first support at 0.8686. This support level is notable for its overlap support characteristics and the presence of the 78.60% Fibonacci Projection, making it a strong potential level of support.
The second support at 0.8670 is also significant as it features overlap support.
On the resistance side, the first resistance at 0.8733 is marked by multi-swing high resistance characteristics. The second resistance at 0.8762 is noteworthy for its overlap resistance.
Additionally, there is an intermediate support level at 0.8722, which is supported by its pullback support attributes.
GBP/USD:
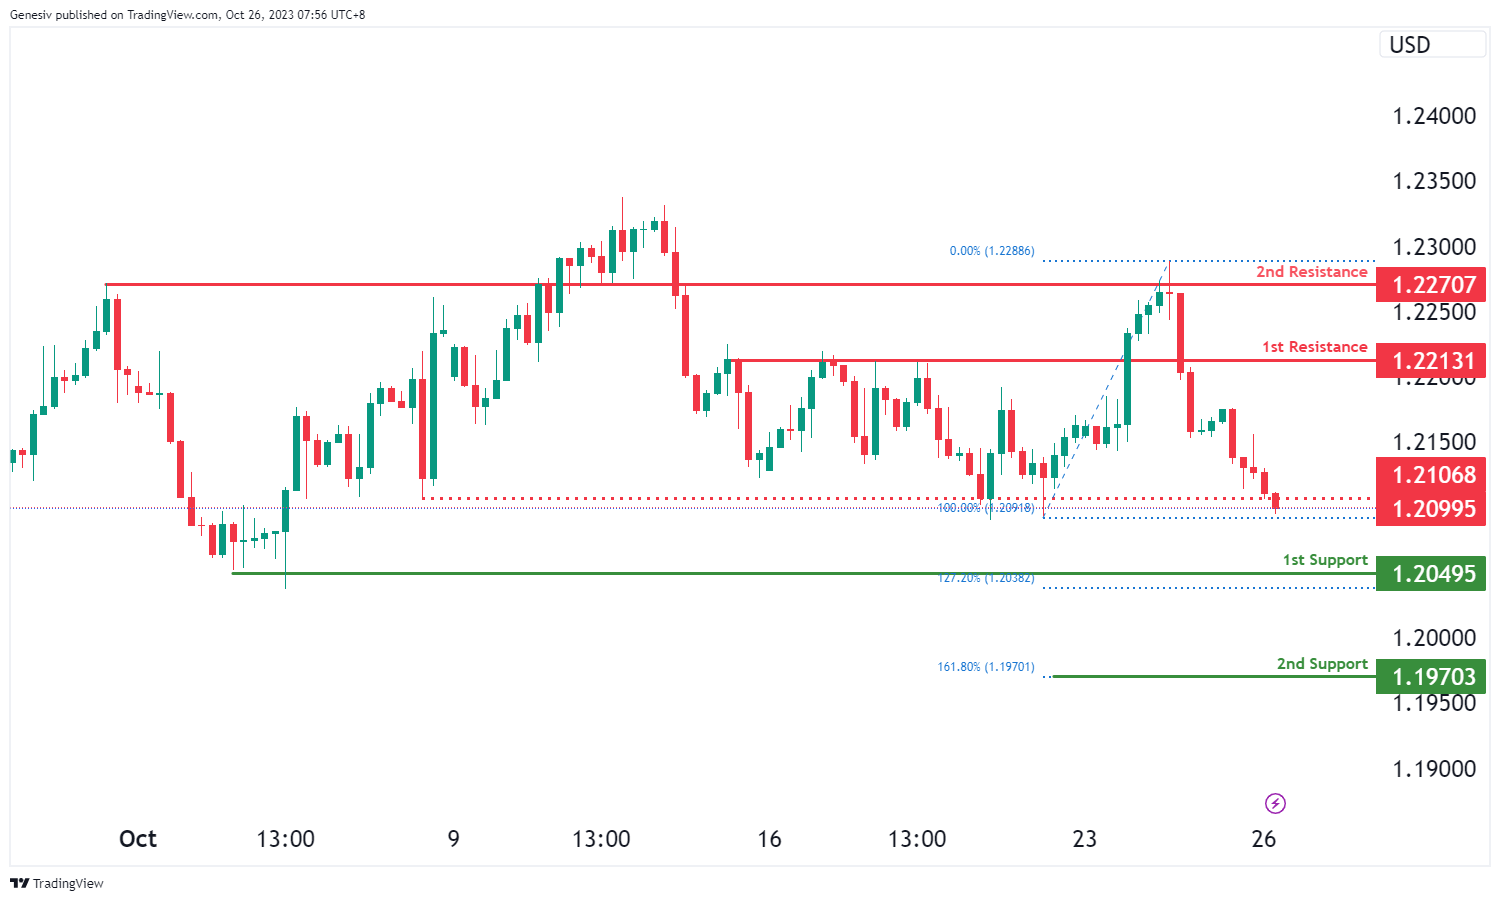
The GBP/USD chart currently exhibits a bearish overall momentum, and there is a potential scenario for a bearish continuation towards the 1st support level.
The 1st support at 1.2049 is considered significant as it aligns with a multi-swing low support level and coincides with the 127.20% Fibonacci Extension level, indicating a strong potential area of price support. Additionally, the 2nd support at 1.1970 is identified as a support level and coincides with the 161.80% Fibonacci Extension, further reinforcing its potential as a support zone.
On the resistance side, the 1st resistance at 1.2213 is characterized as a pullback resistance level, suggesting that it may act as a notable barrier to upward price movement. Furthermore, the 2nd resistance at 1.2270 and the intermediate resistance at 1.2106 are also identified as pullback resistance levels, indicating potential resistance significance at these levels.
GBP/JPY:
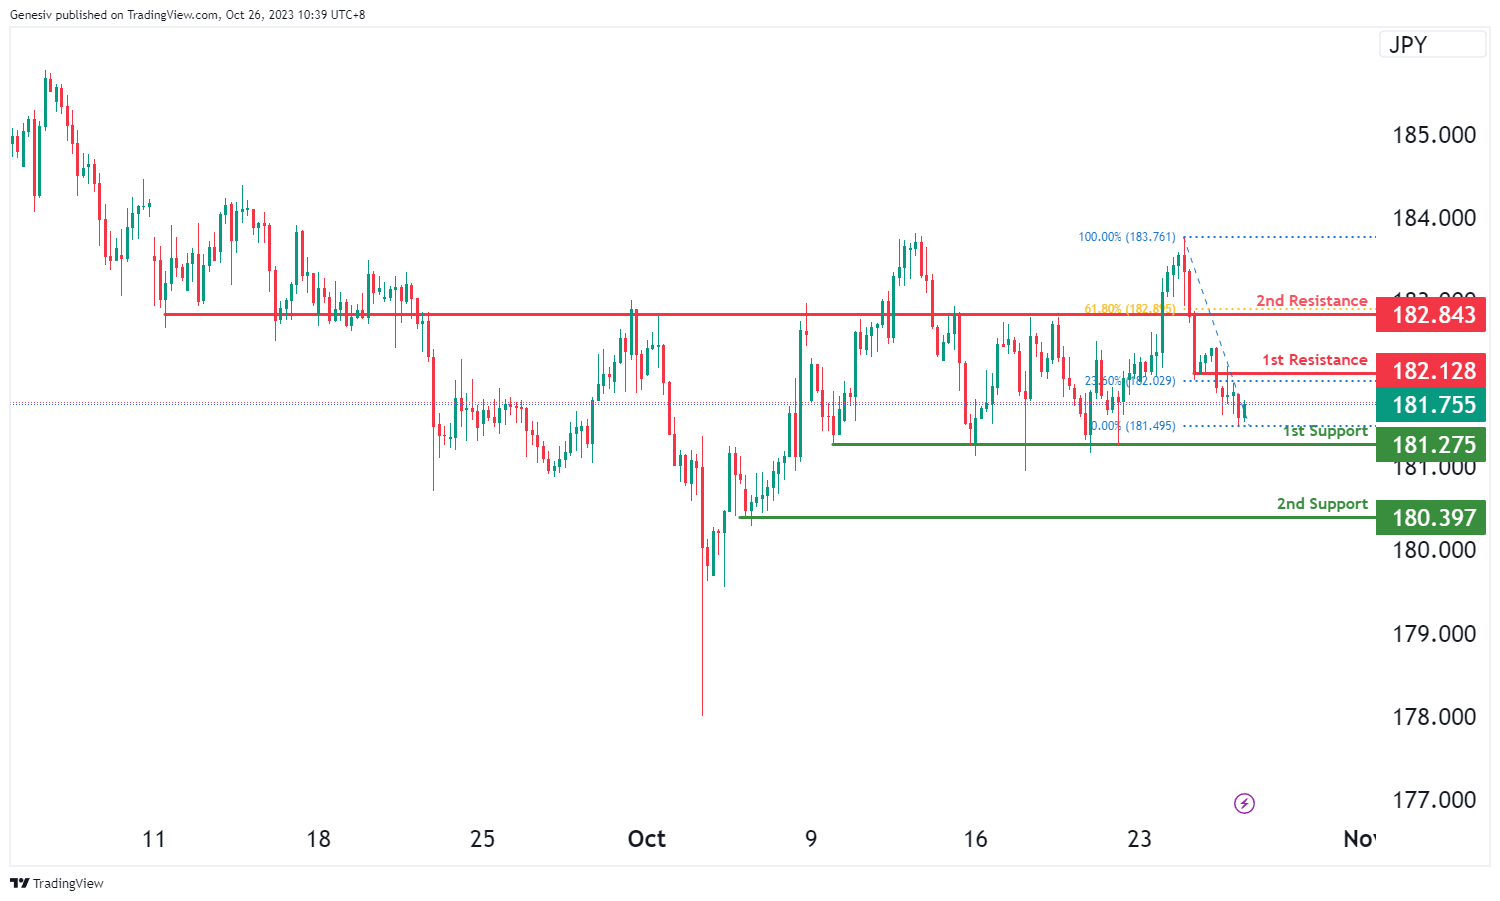
The GBP/JPY instrument is currently exhibiting a bullish overall momentum on the chart, indicating the potential for a bullish continuation in price movement towards the first resistance at 182.12.
The first support at 181.27 is considered strong due to its multi-swing low support characteristics. The second support at 180.39 is also significant as it features swing low support.
On the resistance side, the first resistance at 182.12 is noteworthy for its overlap resistance characteristics and the presence of the 23.60% Fibonacci Retracement, making it a substantial level of resistance. The second resistance at 182.84 is marked by pullback resistance and the presence of the 61.80% Fibonacci Retracement, making it another important level of resistance.
USD/CHF:
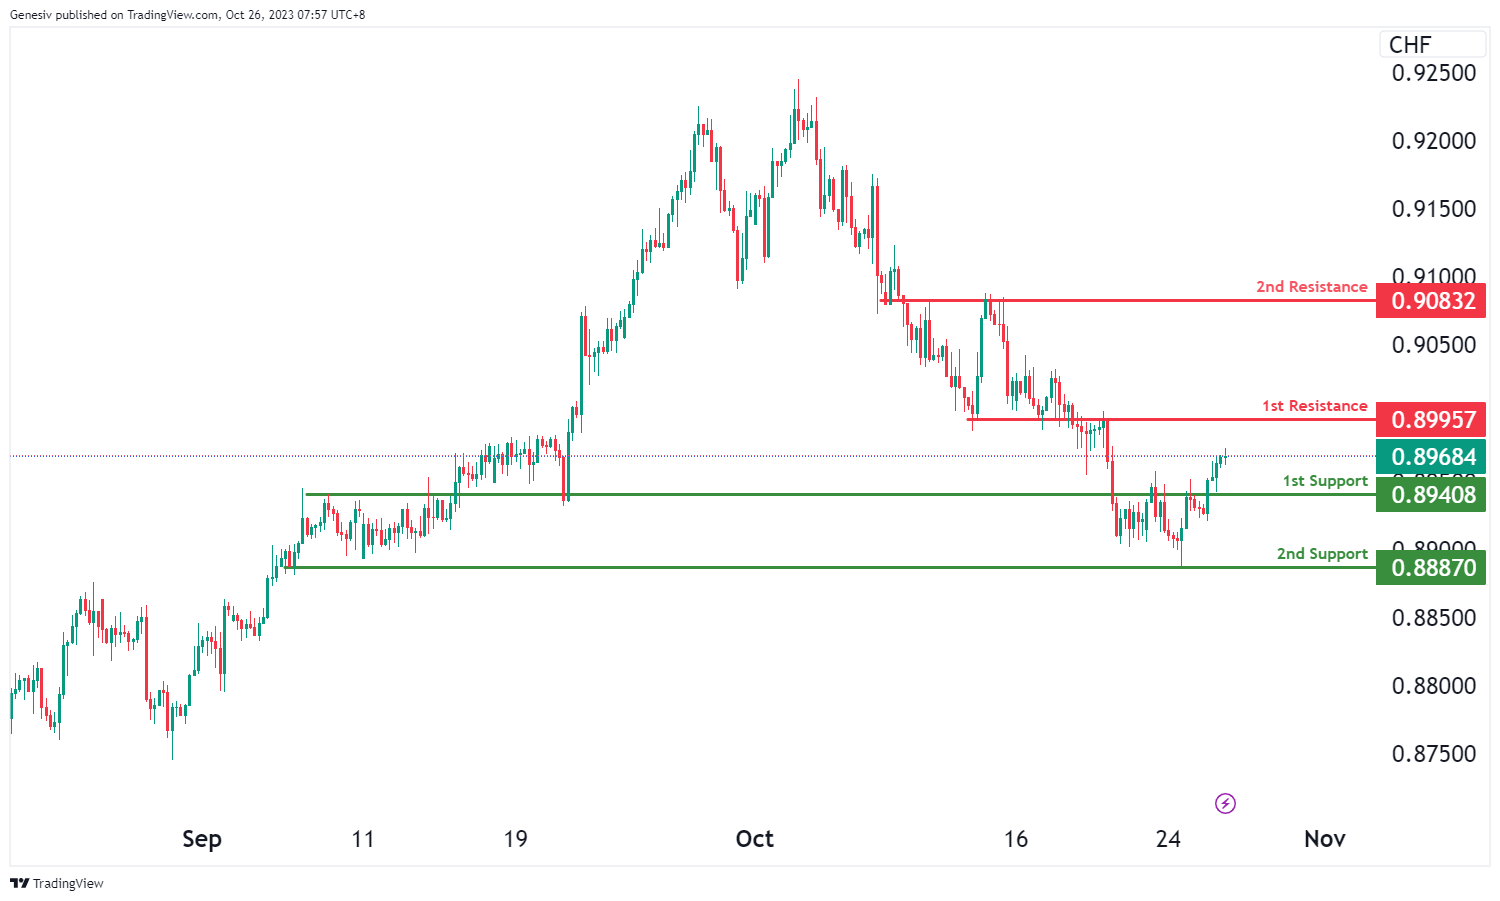
The USD/CHF chart currently displays bullish overall momentum, with the potential scenario of a bullish continuation towards the 1st resistance level.
The 1st support at 0.8940 is considered significant as it aligns with an overlap support level, indicating a potential area of price support. Additionally, the 2nd support at 0.8887 is identified as a swing low support, further reinforcing the potential for support at this level.
On the resistance side, the 1st resistance at 0.8995 is characterized as an overlap resistance level, suggesting potential resistance significance that price may encounter. Beyond this, the 2nd resistance at 0.9083 is also identified as an overlap resistance, indicating another potential barrier to further upward price movement.
USD/JPY:
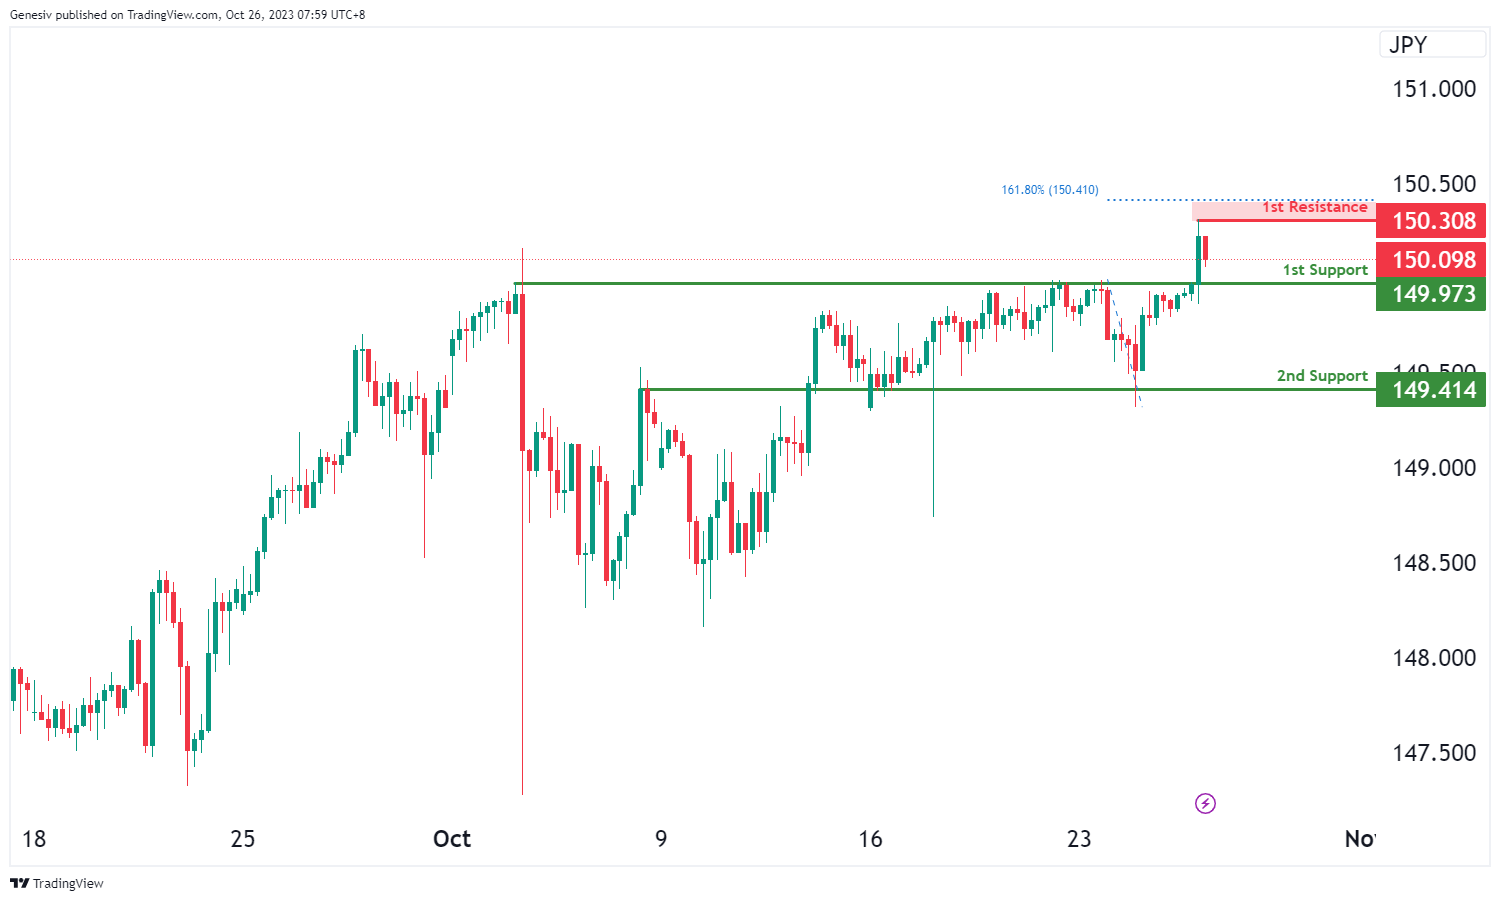
The USD/JPY chart currently exhibits bullish overall momentum, with the potential scenario of a bullish bounce off the 1st support level towards the 1st resistance.
The 1st support at 149.97 is considered significant as it aligns with a pullback support level, indicating a potential area of price support. Additionally, the 2nd support at 149.41 is identified as an overlap support, further reinforcing the potential for support at this level.
On the resistance side, the 1st resistance at 150.30 is characterized as a multi-swing high resistance level, suggesting potential resistance significance that price may encounter as it attempts to move higher.
USD/CAD:
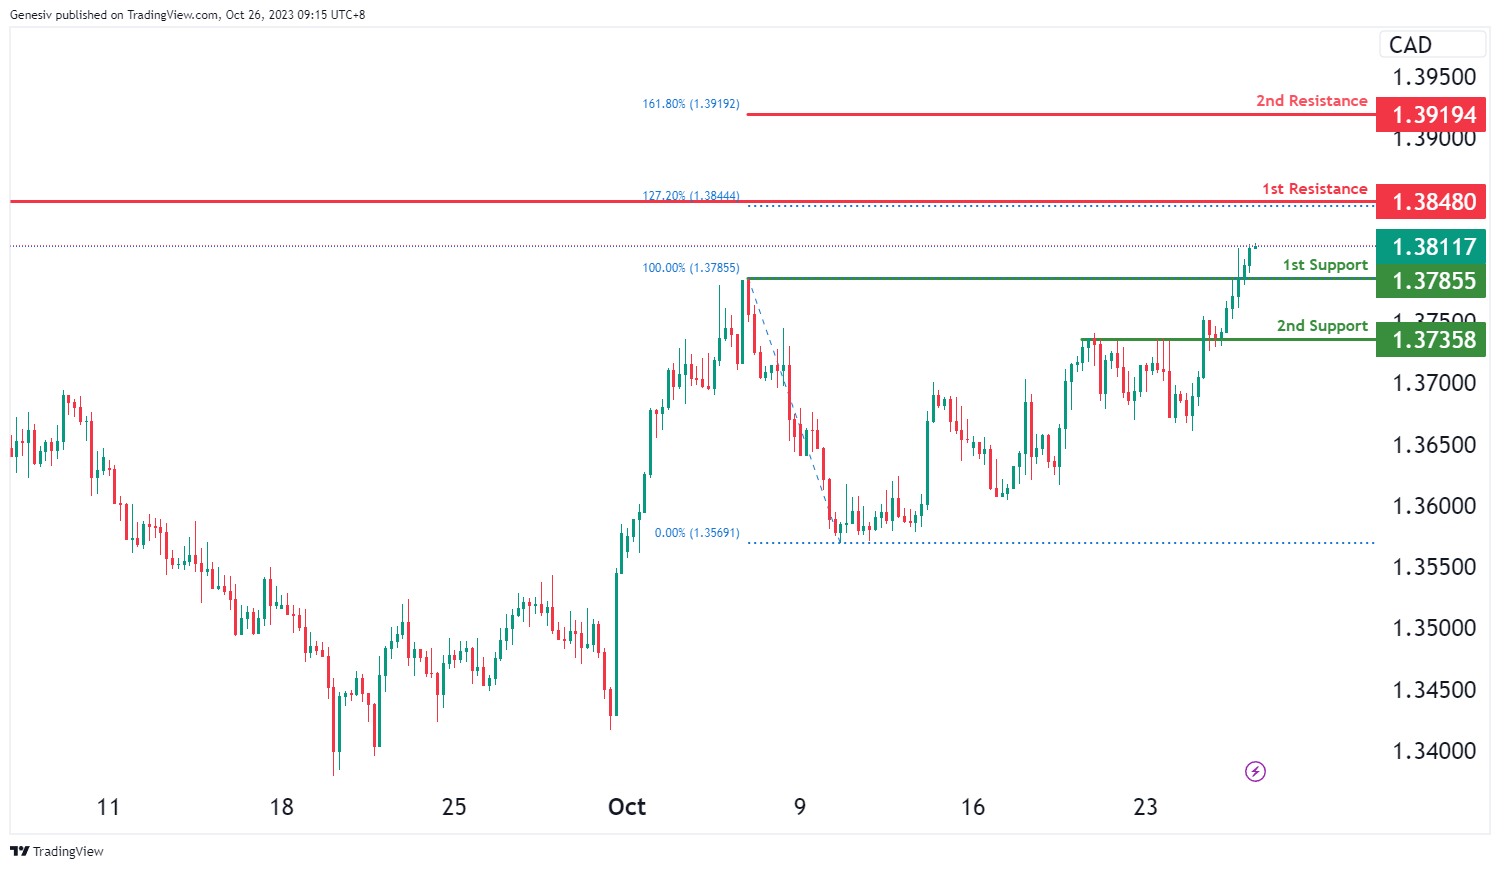
The USD/CAD chart currently exhibits an overall bullish momentum indicating the likelihood of a bullish continuation towards the 1st resistance level, especially after breaking above the significant swing-high resistance at 1.3786.
The 1st resistance level at 1.3848 is identified as a swing-high resistance that aligns with the 127.20% Fibonacci extension level. Higher up, the 2nd resistance level at 1.3919 is marked as a resistance level that aligns with the 161.80% Fibonacci extension level, potentially acting as a barrier to further bullish advances.
To the downside, the 1st support level at 1.3786 is identified as a pullback support. Further below, the 2nd support level at 1.3736 is noted as an overlap support, potentially acting as a strong support zone.
AUD/USD:
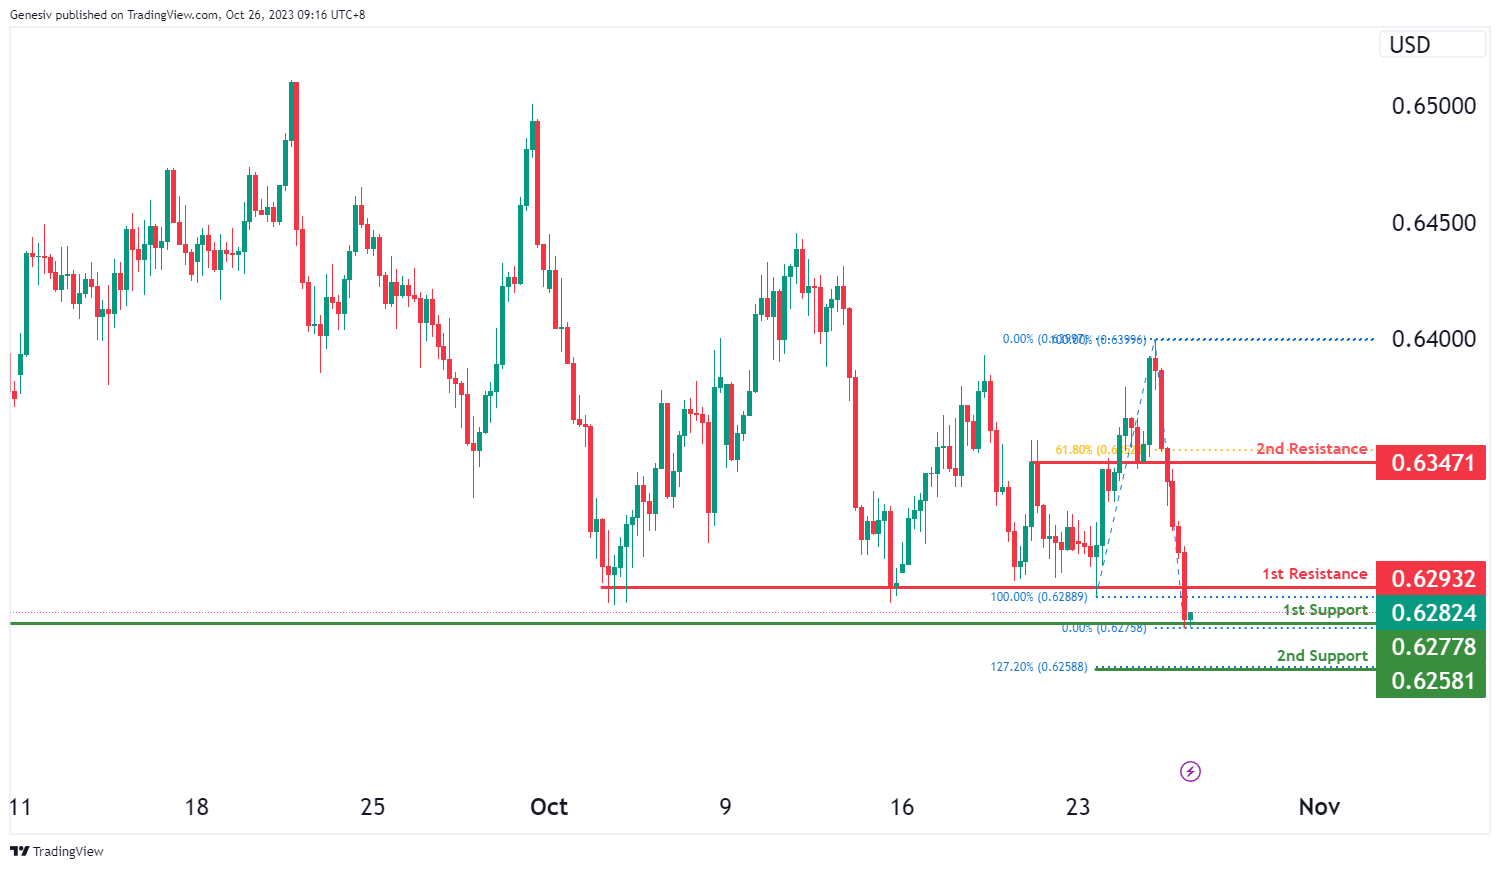
The AUD/USD chart currently exhibits an overall bearish momentum with price potentially making a bearish reaction off the 1st resistance level to drop lower towards the 1st support level.
The 1st resistance level at 0.6293 is identified as a pullback resistance. Higher up, the 2nd resistance level at 0.6347 is marked as an overlap resistance that aligns close to the 61.80% Fibonacci retracement level, making it a potentially strong resistance level.
To the downside the 1st support level at 0.6278 is identified as a multi-swing-low support. Additionally, the 2nd support level at 0.6258 is noted as a support level that aligns with the 127.20% Fibonacci extension level, further reinforcing its importance as a potential support area.
NZD/USD
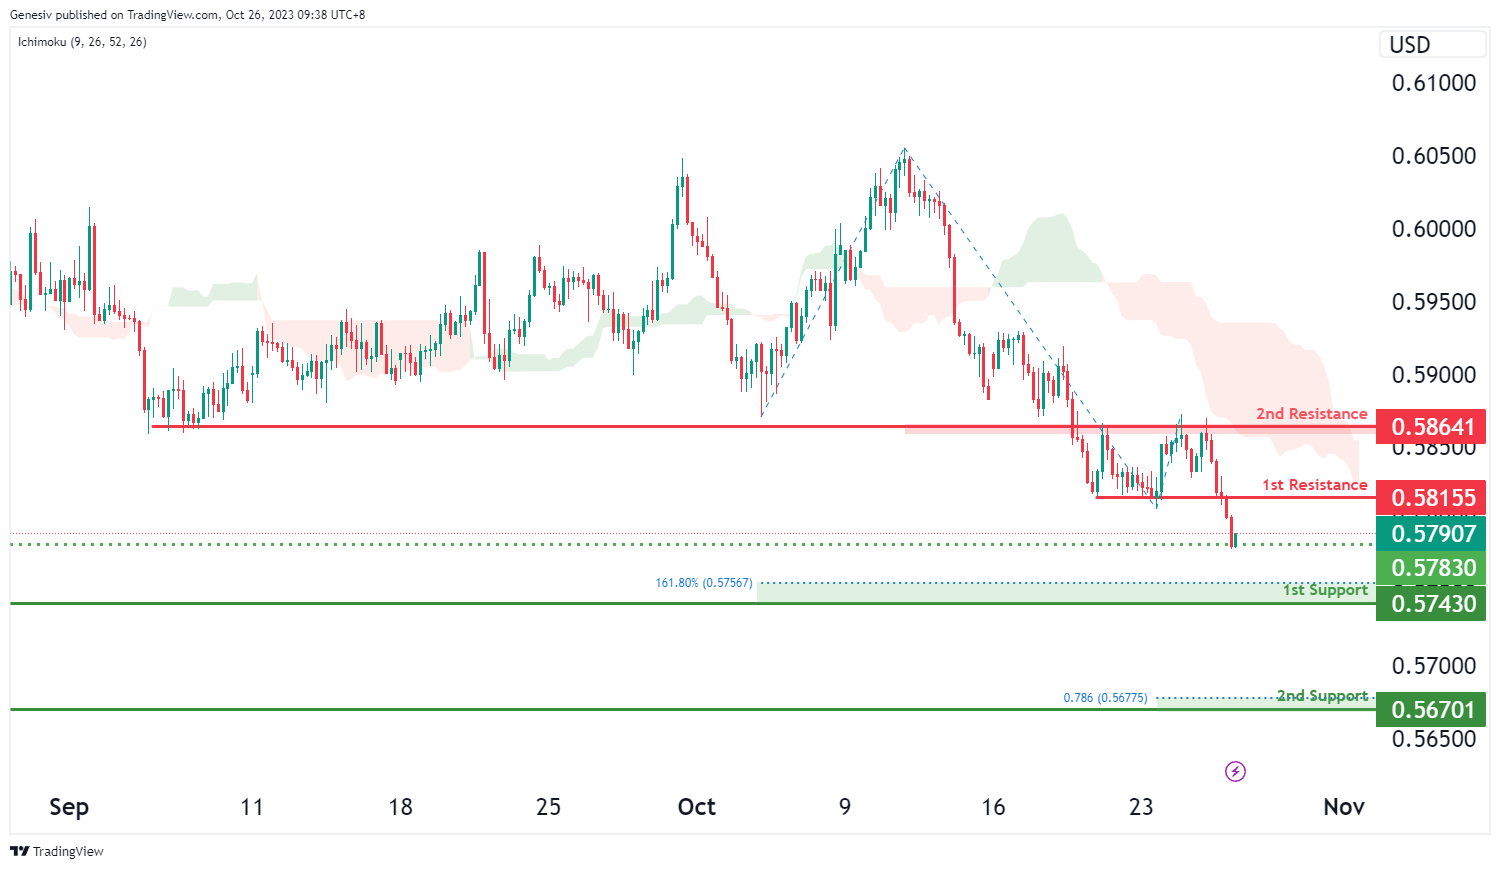
The NZD/USD chart currently exhibits an overall bearish momentum with price potentially making a bearish continuation towards the 1st support level, especially if price breaks below the intermediate support level.
The intermediate support at 0.5783 is identified as an overlap support while the 1st support level at 0.5743 is marked as a swing-low support that aligns close to the 161.80% Fibonacci extension level. Additionally, the 2nd support level at 0.5670 is noted as a pullback support that aligns close to the 78.60% Fibonacci projection level, further reinforcing its importance as a potential support area.
To the upside, the 1st resistance level at 0.5816 is identified as a pullback resistance. Higher up, the 2nd resistance level at 0.5864 is marked as an overlap resistance, making it a potentially strong resistance level.
DJ30:
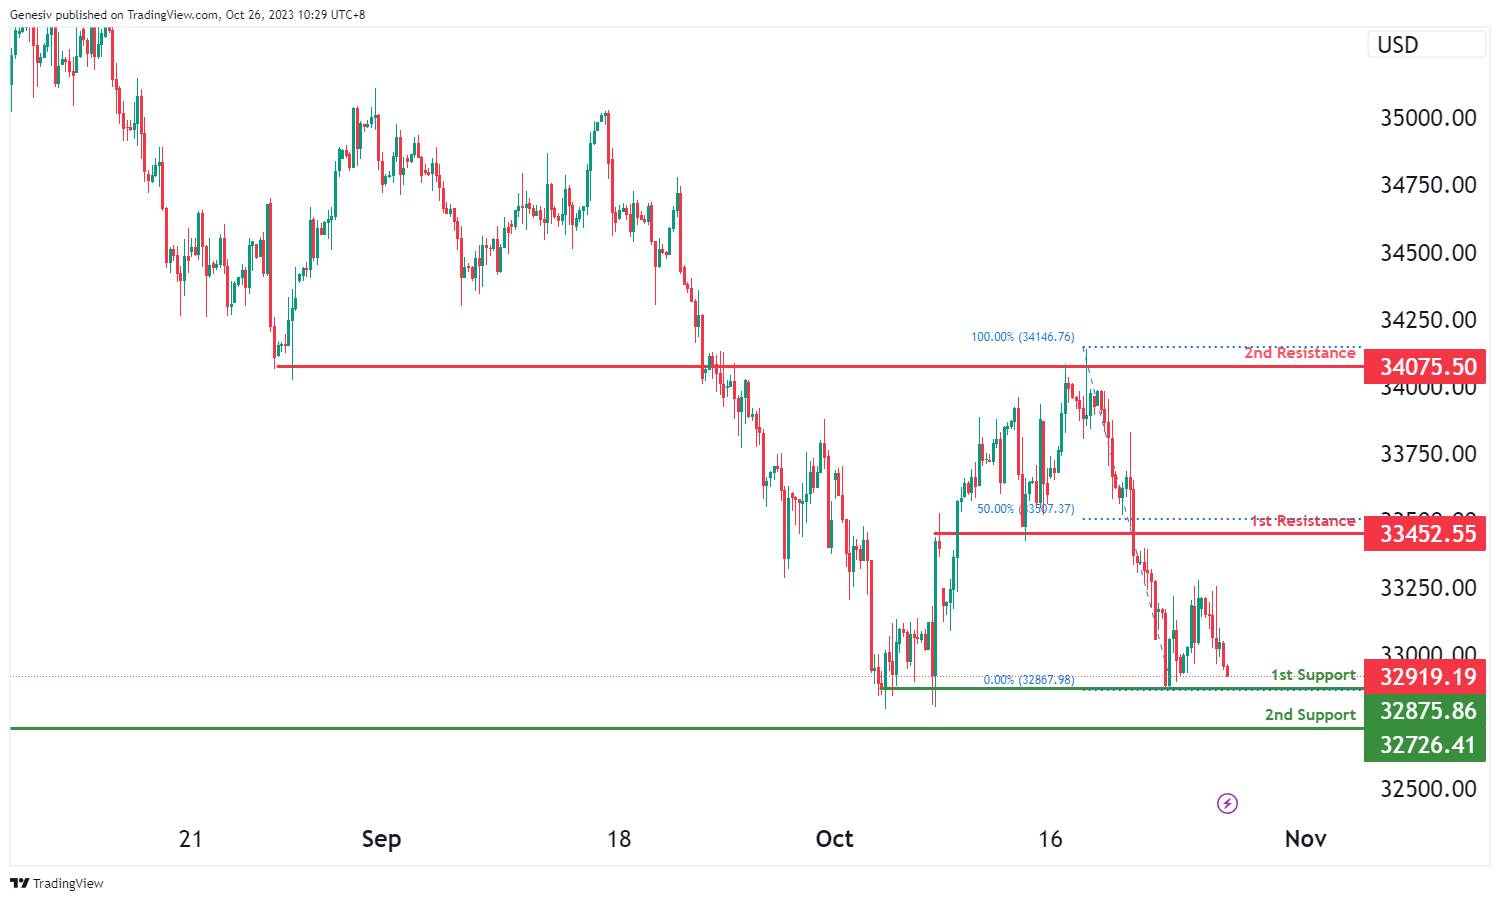
The instrument DJ30 currently exhibits a bullish overall momentum on its chart. The price may potentially drop further to the first support level at 32875.86 in the short term before bouncing from there and rising towards the first resistance at 33452.55.
The first support at 32875.86 is considered a strong level due to its multi-swing low support characteristics, while the second support at 32726.41 shares the same attribute.
On the other hand, the first resistance at 33452.55 is noteworthy for its pullback resistance, and the second resistance at 34075.50 is significant due to an overlap resistance.
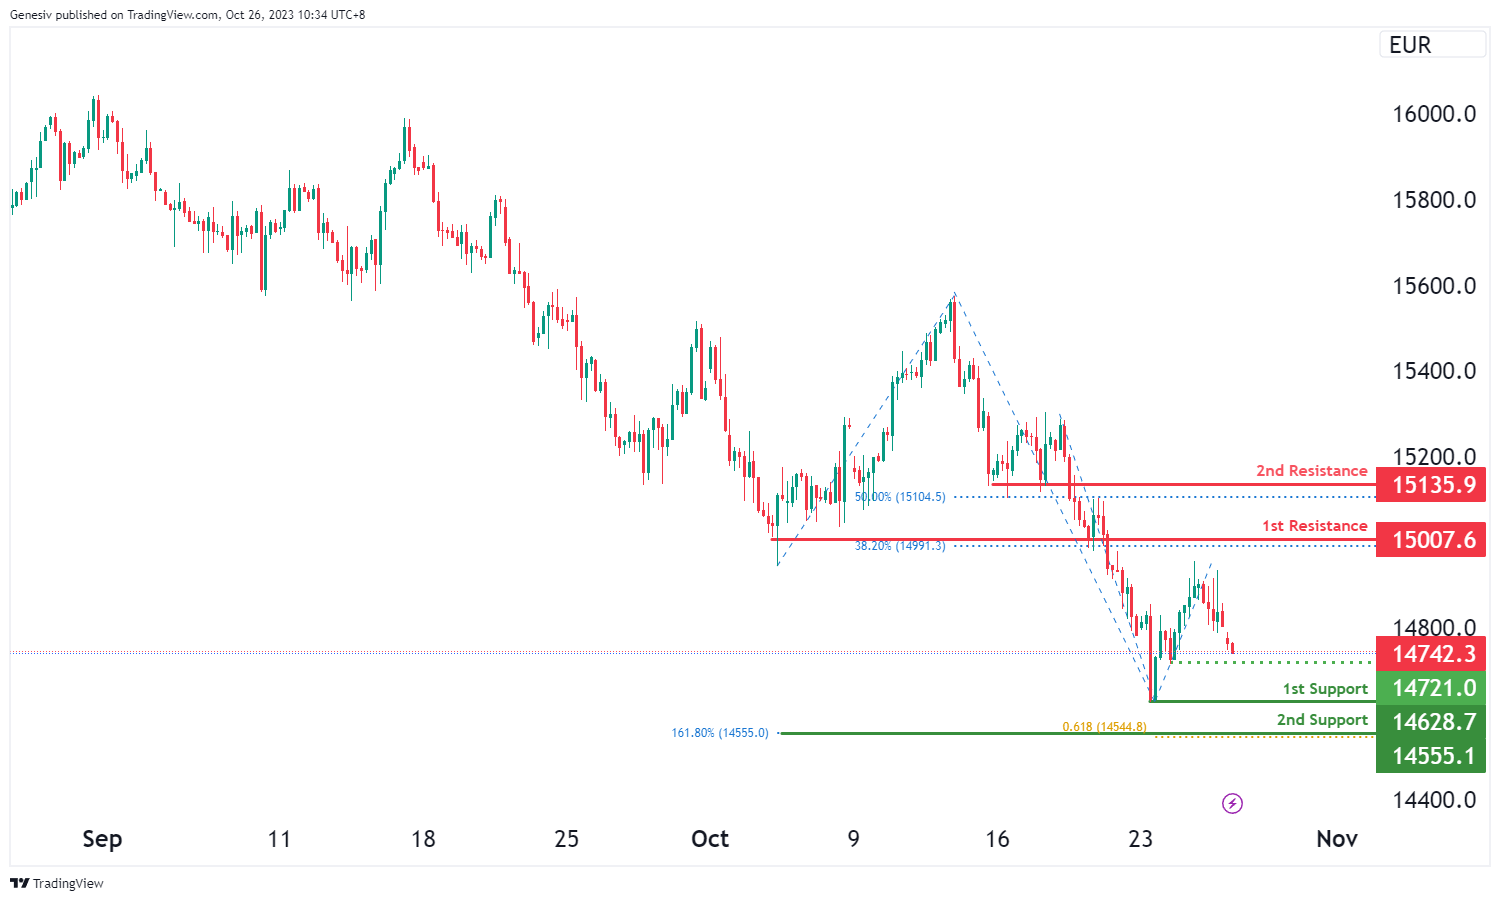
GER40:
For the GER40 instrument, the chart is currently showing a bearish overall momentum. Price is expected to potentially continue in a bearish direction, heading towards the first support at 14628.70, which is considered a robust level due to its swing low support characteristics. The second support at 14555.10 is also significant, attributed to the 161.80% Fibonacci Extension.
On the other hand, the first resistance at 15007.60 is noteworthy for its pullback resistance and the presence of the 38.20% Fibonacci Retracement, while the second resistance at 15135.90 is marked by pullback resistance and the 50% Fibonacci Retracement. Additionally, there is an intermediate support level at 14721.00, which is supported by its swing low support characteristics.
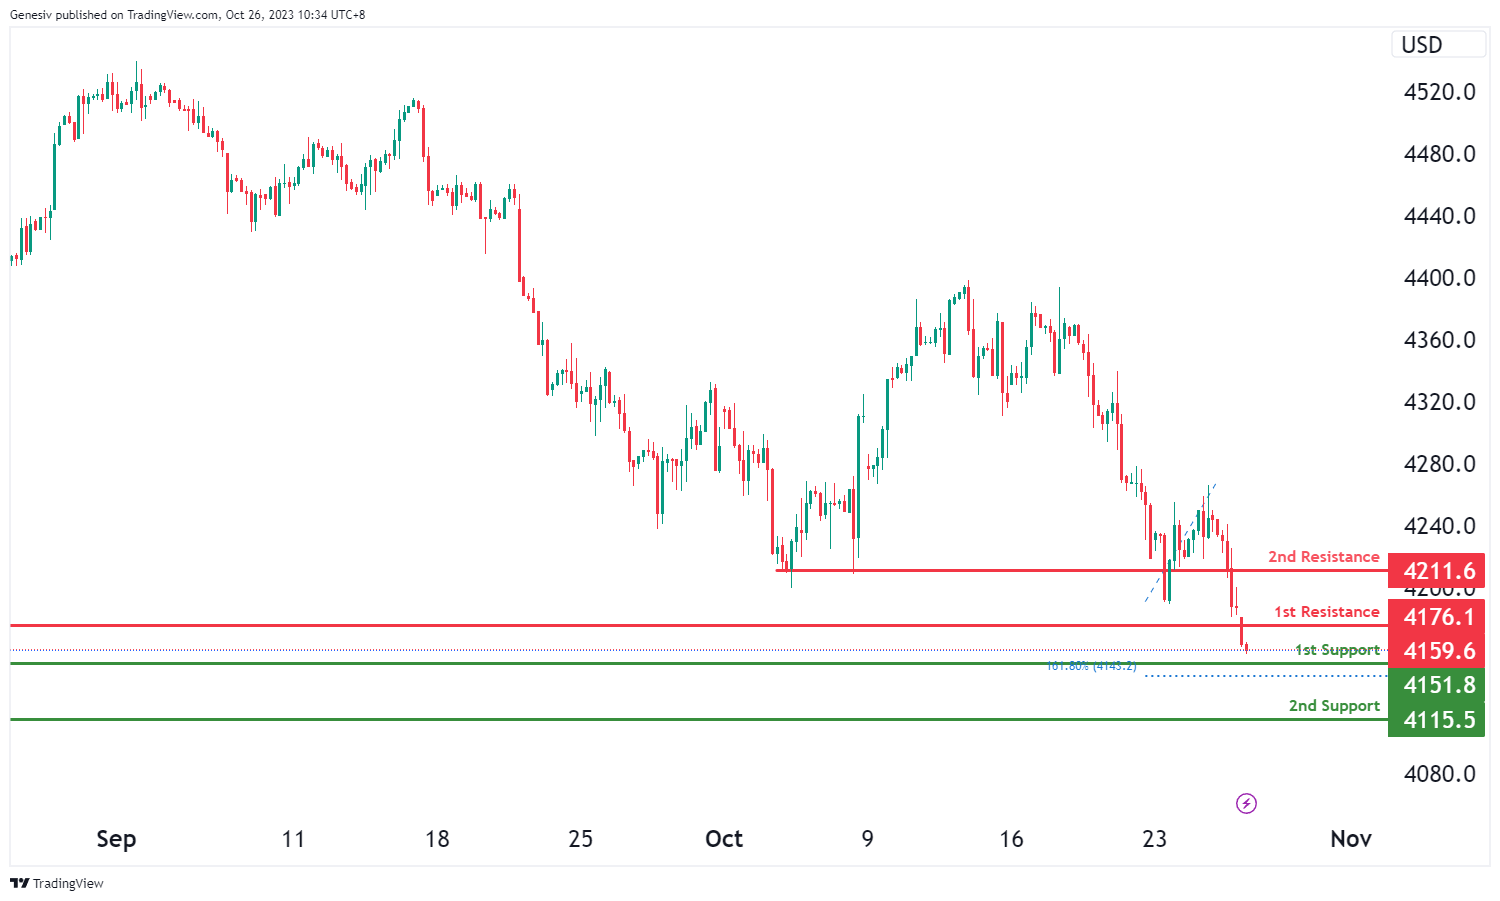
US500
The US500 instrument currently displays a bullish overall momentum on the chart. It’s anticipated that the price may potentially experience a short-term drop to the first support level at 4151.8 before bouncing from there and rising towards the first resistance at 4176.1.
The first support at 4151.8 is considered a strong level due to its pullback support characteristics and the presence of the 161.80% Fibonacci Extension. The second support at 4115.5 is significant because of its swing low support features and the 61.80% Fibonacci Projection.
Conversely, the first resistance at 4176.1 is noteworthy for its pullback resistance. The second resistance at 4211.6 is also significant due to its pullback resistance properties.
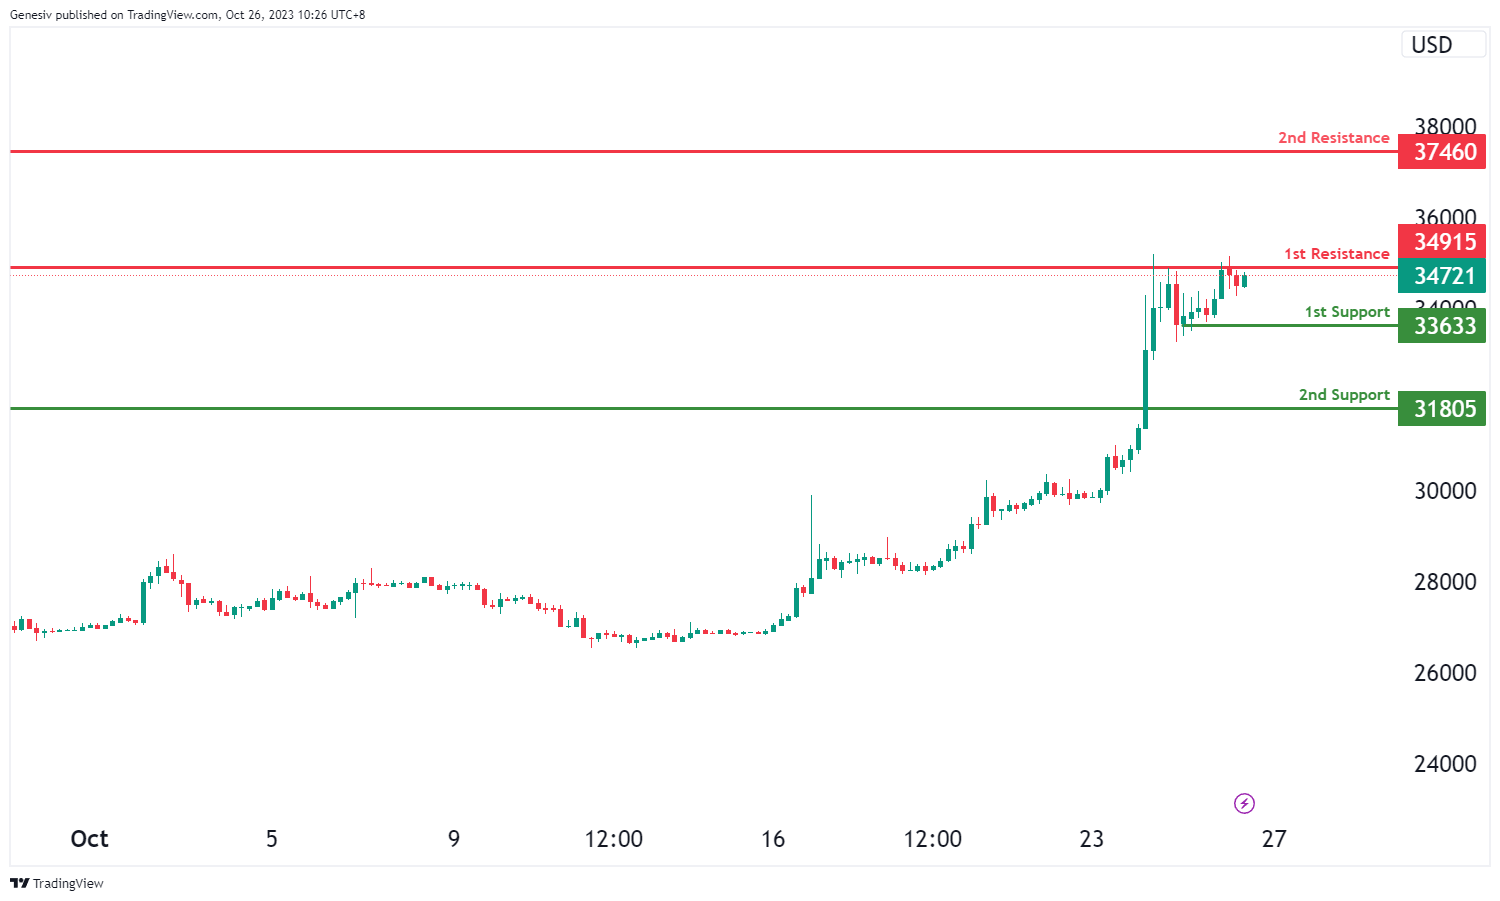
BTC/USD:
In the analysis of BTC/USD, the overall momentum of the chart indicates a bullish trend.
It is anticipated that the price may continue to move in a bullish direction, potentially heading towards the first resistance level.
The first support level is at 33,633, which is considered significant as it represents a swing low support.
The second support level is at 31,805, and it is also of importance as it denotes a pullback support.
On the resistance side, the first resistance level is at 34,915, which is notable because it marks a pullback resistance.
The second resistance level is at 37,460, and it is significant as well as it represents another pullback resistance level.
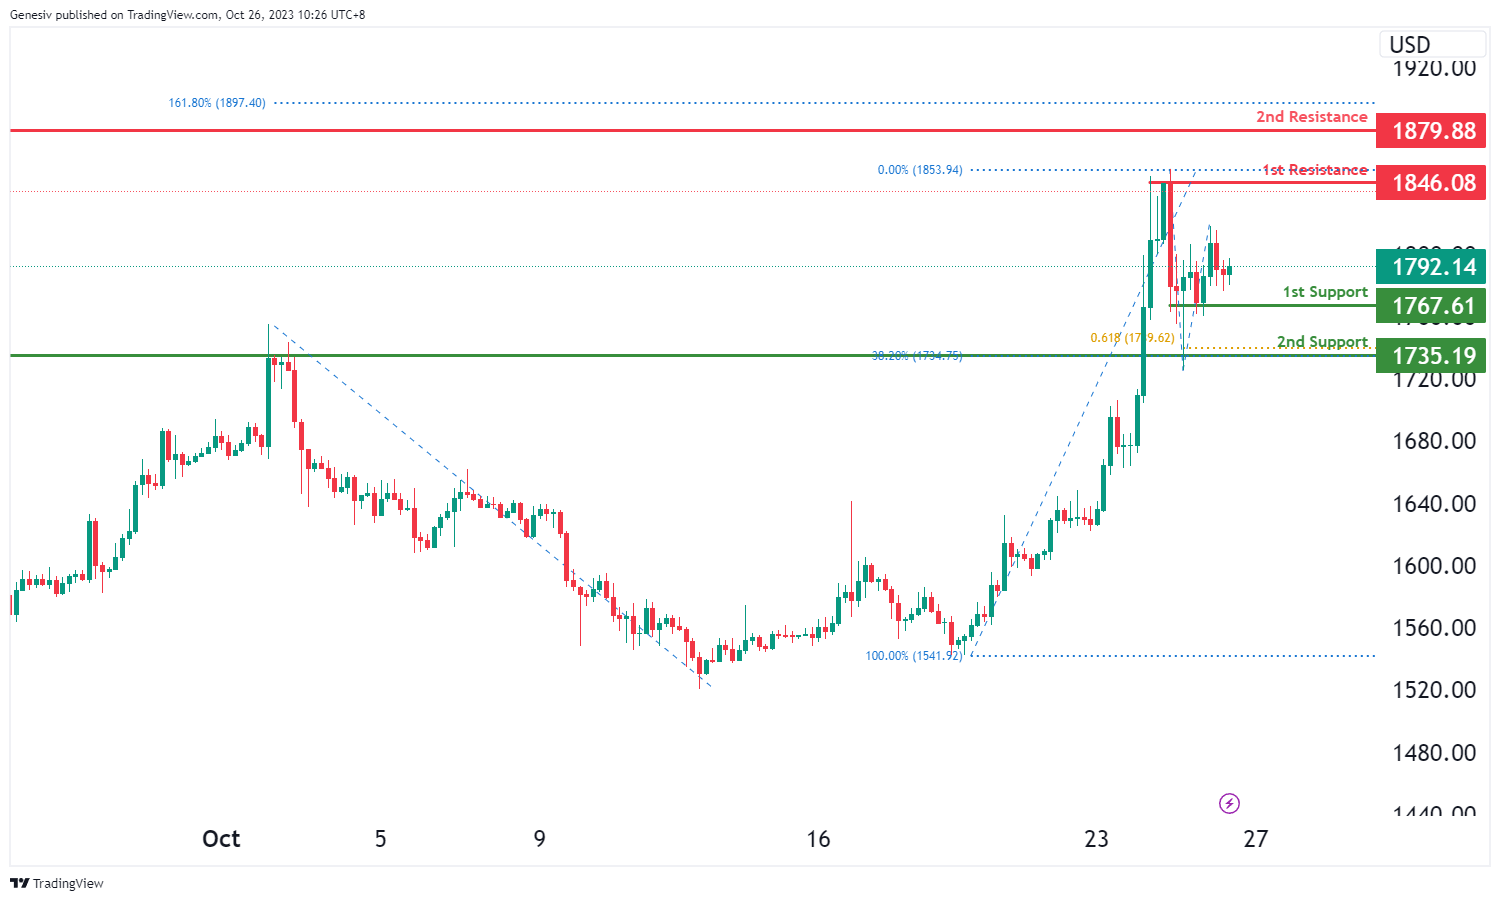
ETH/USD:
In the analysis of ETH/USD, the overall momentum of the chart indicates a bullish trend.
It is anticipated that the price may continue to move in a bullish direction, potentially heading towards the first resistance level.
The first support level is at 1,767.61, which is considered significant as it represents a multi-swing low support.
The second support level is at 1,735.19, and it is also of importance as it denotes a pullback support, along with confluence from the 38.20% Fibonacci Retracement and the 61.80% Fibonacci Projection.
On the resistance side, the first resistance level is at 1,846.08, which is notable because it marks a multi-swing high resistance.
The second resistance level is at 1,879.88, and it is significant as well as it represents another multi-swing high resistance with the added confluence of the 161.80% Fibonacci Extension. This indicates a potential bullish continuation in the chart.
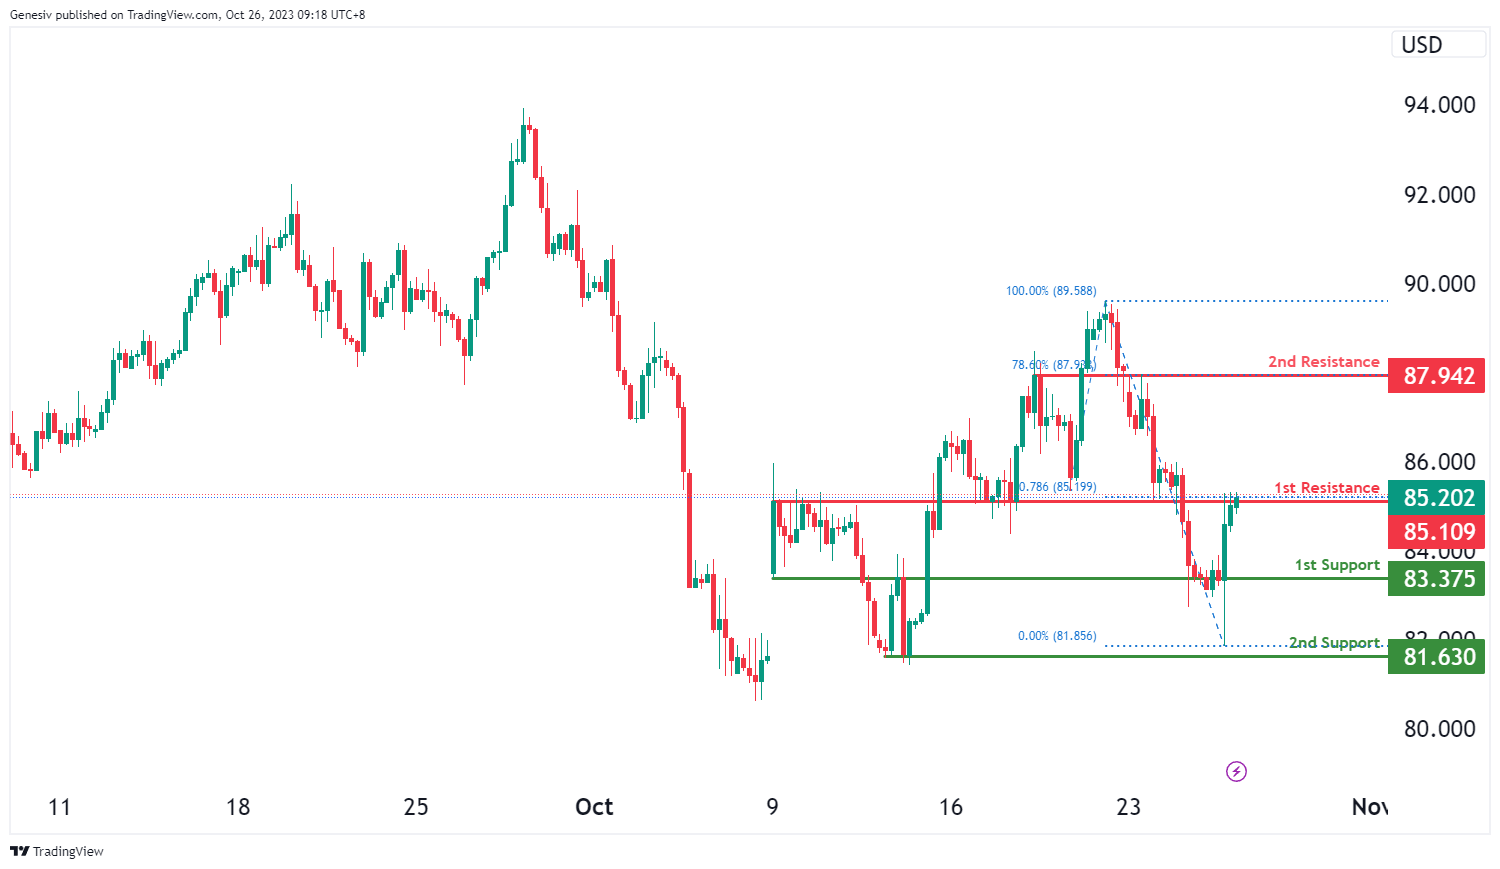
WTI/USD:
The WTI chart currently exhibits an overall bullish momentum, indicating a potential scenario for price to make a bullish continuation towards the 2nd resistance level should it break above the 1st resistance level.
The 1st resistance level at 85.11 is identified as an overlap resistance that aligns with the 78.60% Fibonacci projection level. Beyond this, the 2nd resistance level at 87.94 is noted as an overlap resistance that aligns with the 78.60% Fibonacci retracement level, making it a potentially strong resistance level.
To the downside, the 1st support level at 83.38 is identified as an overlap support. Further below, the 2nd support level at 81.63 is also marked as a swing-low support, indicating a potential support zone.
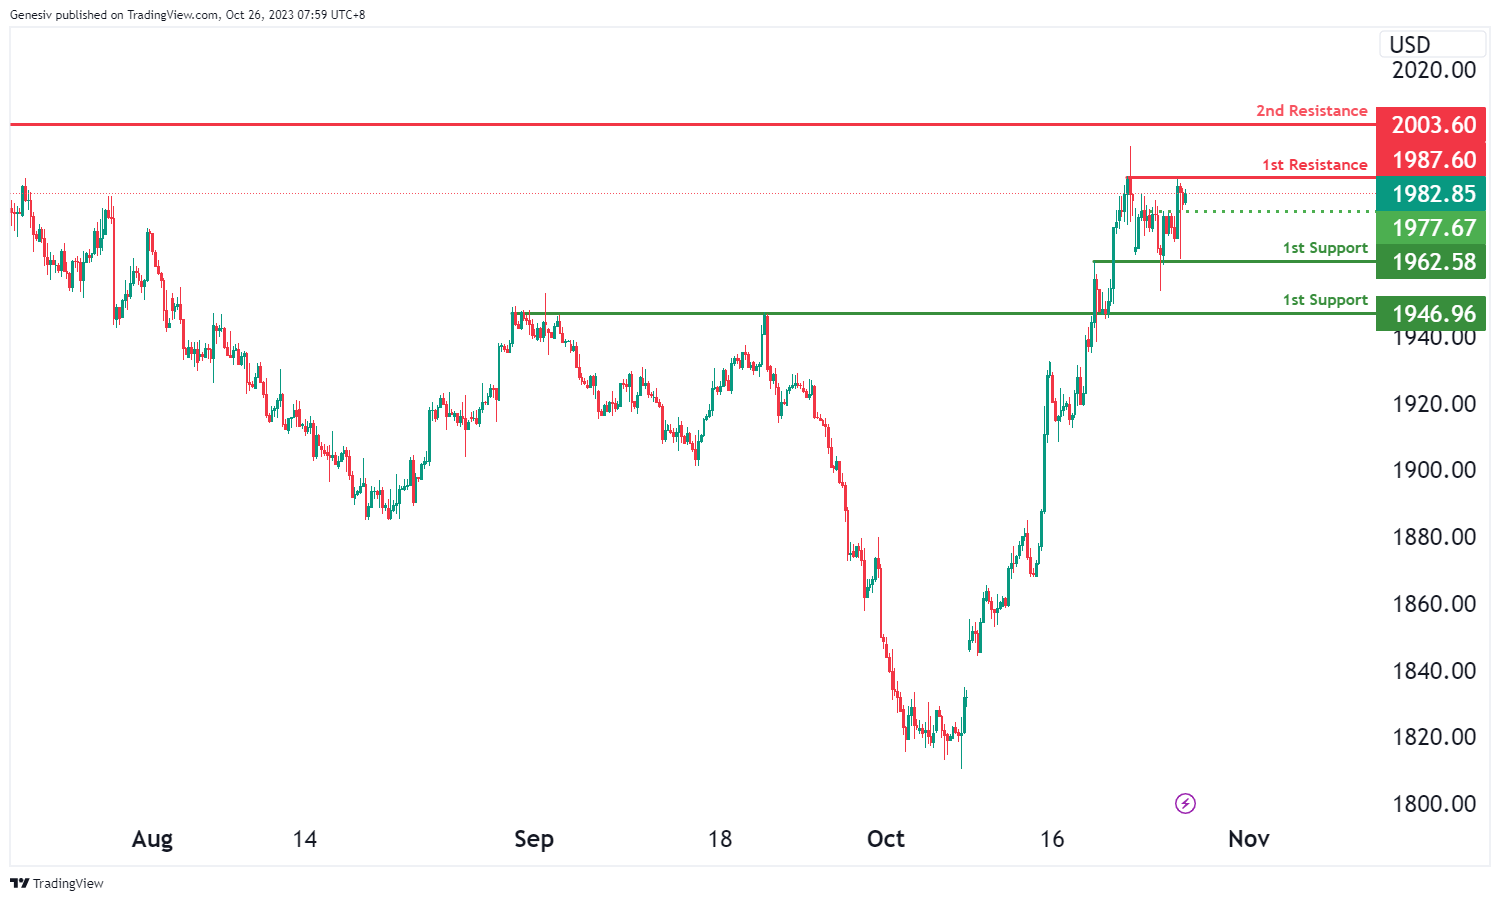
XAU/USD (GOLD):
The XAU/USD chart currently exhibits bearish overall momentum, with the potential scenario of a bearish continuation towards the 1st support level.
The 1st support at 1962.58 is considered significant as it aligns with an overlap support level, indicating a potential area of price support. Additionally, the 2nd support at 1946.96 is also identified as an overlap support, further reinforcing the potential for support at this level.
On the resistance side, the 1st resistance at 1987.60 is characterized as a multi-swing high resistance level, suggesting potential resistance significance that price may encounter as it attempts to move higher. Beyond this, the 2nd resistance at 2003.60 is identified as a swing high resistance, which can act as a significant barrier to upward price movement.
An intermediate support level at 1977.67 is also noted as a pullback support, adding another layer of potential support for price action.


