
- Daily MACD indicator has exhibited a potential medium-term trend change behaviour from bearish to bullish.
- Recent price actions have shaped a minor bullish “Double Bottom” breakout and traded above the 20-day moving average.
- Watch the short-term key support at 17,540.
In the past two weeks, the price actions of the Hong Kong 33 Index (a proxy of the Hang Seng Index futures) have started to exhibit short-term to medium-term bullish bottoming configurations.
Daily MACD continues to show a persistent slow-down in downside momentum
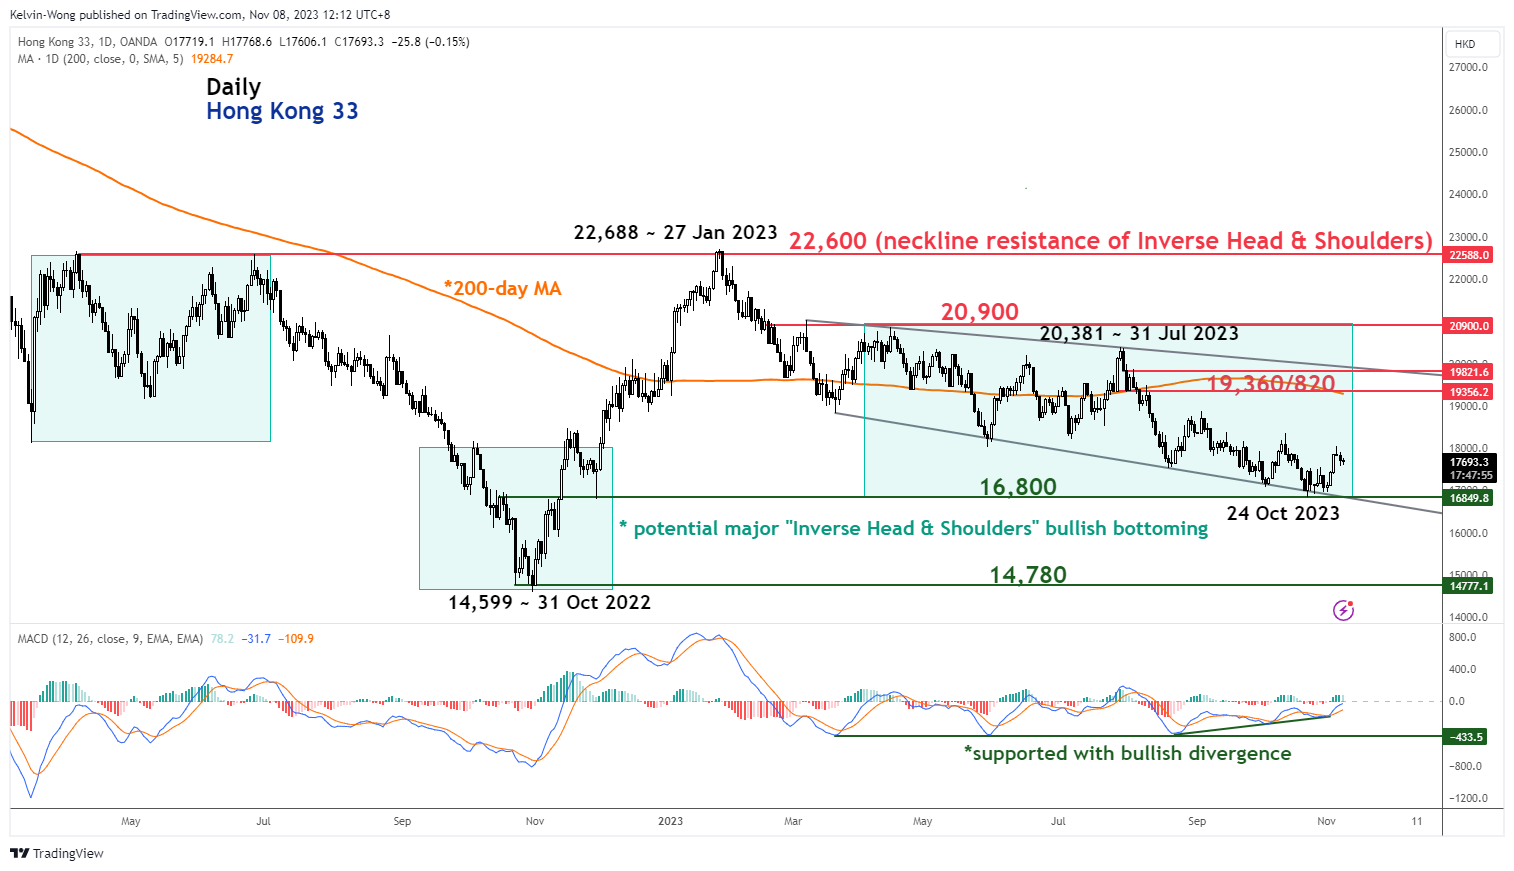
Fig 1: Hong Kong 33 medium-term trend as of 8 Nov 2023 (Source: TradingView, click to enlarge chart)
The medium-term downtrend phase in place since the 27 January 2023 high of 22,688 of the Hong Kong 33 Index has continued to trace out a series of “lower swing lows” attributed to fears of the deflationary spiral in China, geopolitical tensions between the US and China, and lack of ample stimulus measures from China top policymakers.
In the lens of technical analysis, our primary focus lies more on price actions and their reactions from news flows (analysis of how much has been priced into the tradable instruments from either positive or negative related news flow). For example, if market participants are fully aware of the available negative news flows that drive down the tradable price of a highly liquid transacted financial instrument in the current state, a tiny subtle infusion of positive news flow is likely to see a positive reversal in price actions as these negative news flows have been almost fully priced in.
Relative strength study (rate of change or momentum) is one of the major focuses in technical analysis to decipher potential reversal zones of highly liquid transacted financial instruments and also act as a gauge of the strength of trending behaviours as market participants digest and react to the related news flows.
The daily MACD indicator of the Hong Kong 33 Index has started to flash out a series of “higher lows” since 5 October 2023, a bullish divergence condition in contrast with the “lower lows” seen in the price actions of the Index over the same period (relative over here as the MACD is a momentum indicator as well on top of its trend-following elements).
This observation suggests the strength of the medium-term downtrend phase has started to ease which in turn suggests any subtle new positive news flow may trigger a potential sustainable upmove or bullish reversal in the price actions of the Index going forward.
Minor “Double Bottom” bullish breakout, watch the 17,540 key short-term support
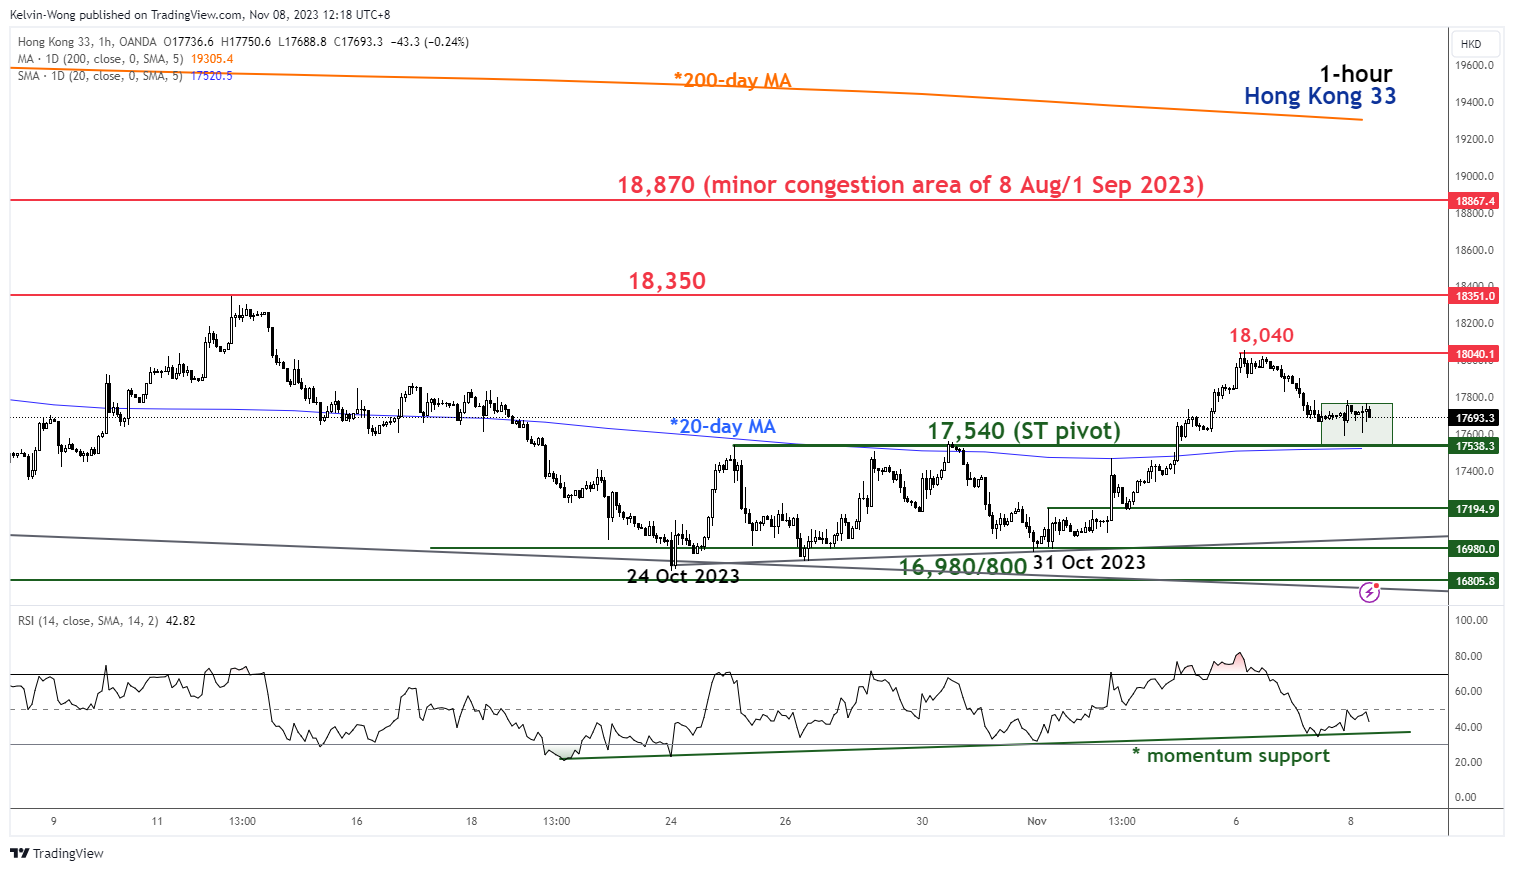
Fig 2: Hong Kong 33 minor short-term trend as of 8 Nov 2023 (Source: TradingView, click to enlarge chart)
In the short-term as seen on its hourly chart, the Index has traced out a minor bullish “Double Bottom” bullish reversal configuration via its recent price actions from 24 October to 31 October 2023.
It has staged a bullish breakout of the neckline resistance of the minor “Double Bottom” and 20-day moving average and price actions since Monday, 6 November have retraced/pull-backed towards these elements now acting as confluence support of 17,540.
In addition, the hourly RSI momentum indicator has managed to stage a rebound from its ascending support yesterday, 7 November which suggests a revival of short-term bullish momentum.
A clearance above 18,040 near-term resistance (6 November minor swing high) may see a further potential push-up towards the next immediate resistance at 18,350 in the first step.
On the flip side, failure to hold at the 17,540 short-term pivotal support negates the bullish tone for a slide to retest the 16,980/16,800 key medium-term support zone.


 have started to exhibit short-term to medium-term bullish bottoming configurations.)