
DXY:
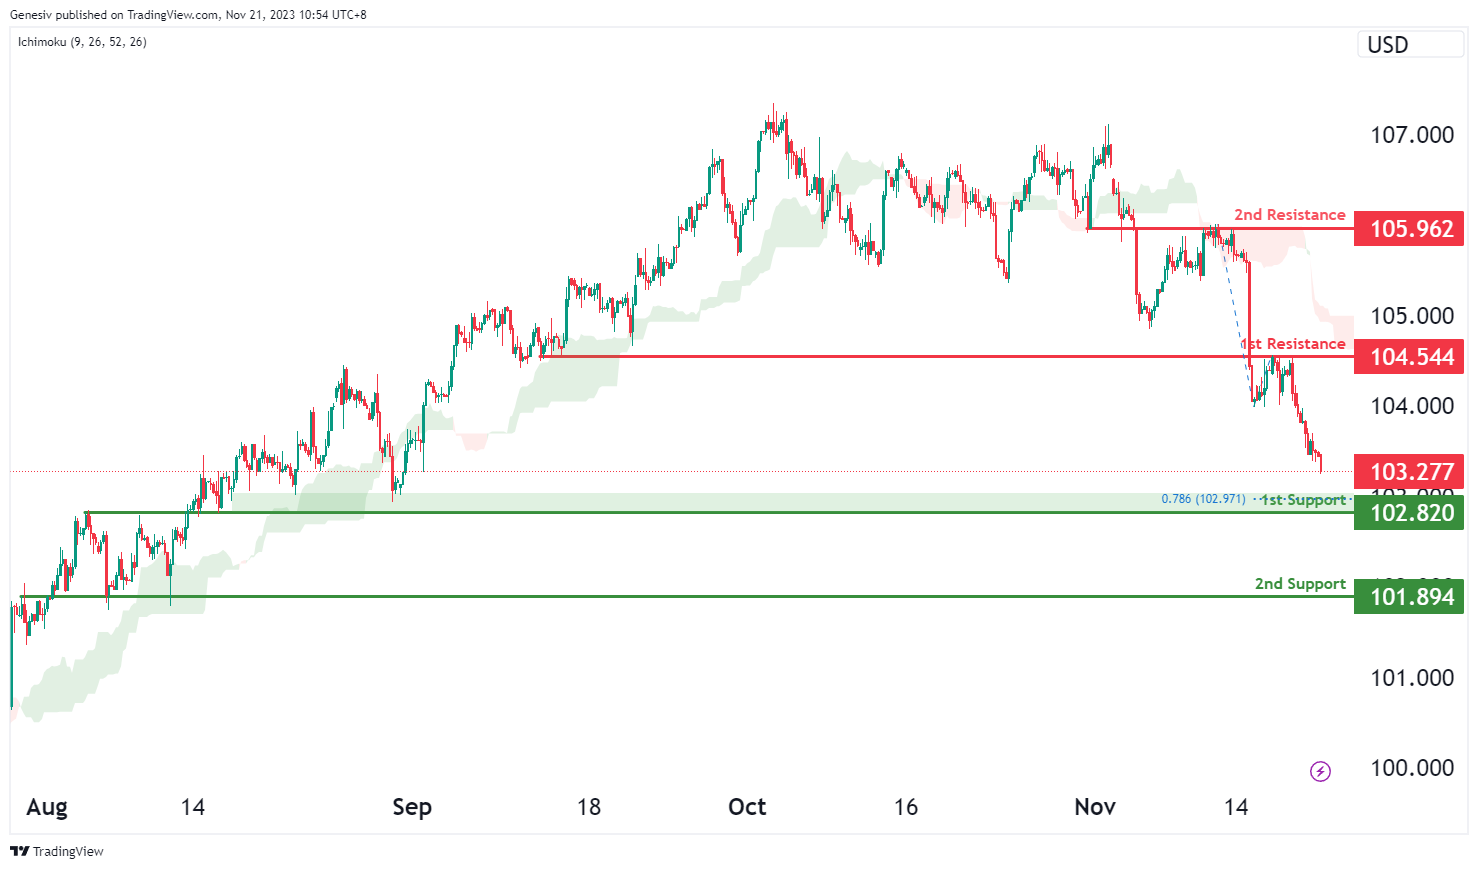
The DXY (US Dollar Index) chart currently has an overall bearish overall momentum, suggesting the potential for a bearish continuation towards the 1st support.
The 1st support level at 102.82 is identified as an overlap support that coincides with the 78.60% Fibonacci projection level. Further below, the 2nd support level at 101.89 is also marked an overlap support, further reinforcing its potential as a support level.
On the resistance side, the 1st resistance level at 104.54 is categorized as an overlap resistance. Higher up, the 2nd resistance level at 105.96 is also noted as an overlap resistance, potentially acting as a barrier to further upward movement.
EUR/USD:
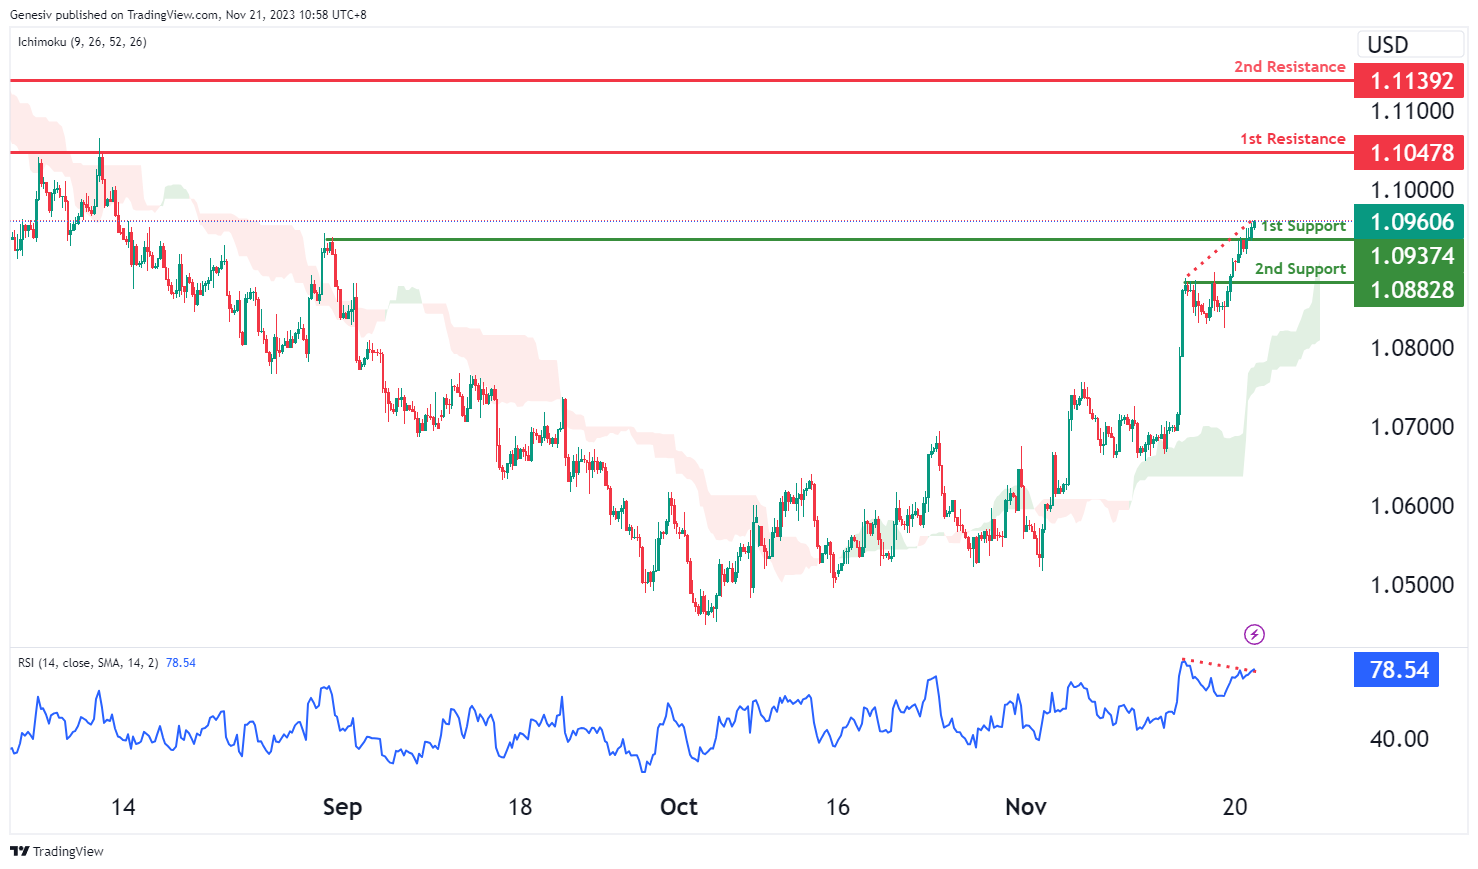
The EUR/USD chart currently has an overall bullish momentum, suggesting a potential for a bullish continuation towards the 1st resistance. However, the Relative Strength Index (RSI) is showing a bearish divergence versus the price, suggesting a potential scenario for price to reverse and fall lower.
The 1st support level at 1.0937 is identified as a pullback support. Further below, the 2nd support level at 1.0883 is also marked as a pullback support, indicating a level where the bearish movement could be halted.
On the resistance side, the 1st resistance level at 1.1048 is identified as a pullback resistance. Higher up, the 2nd resistance level at 1.1139 is also marked as a pullback resistance, further reinforcing its potential as a resistance zone.
EUR/JPY:
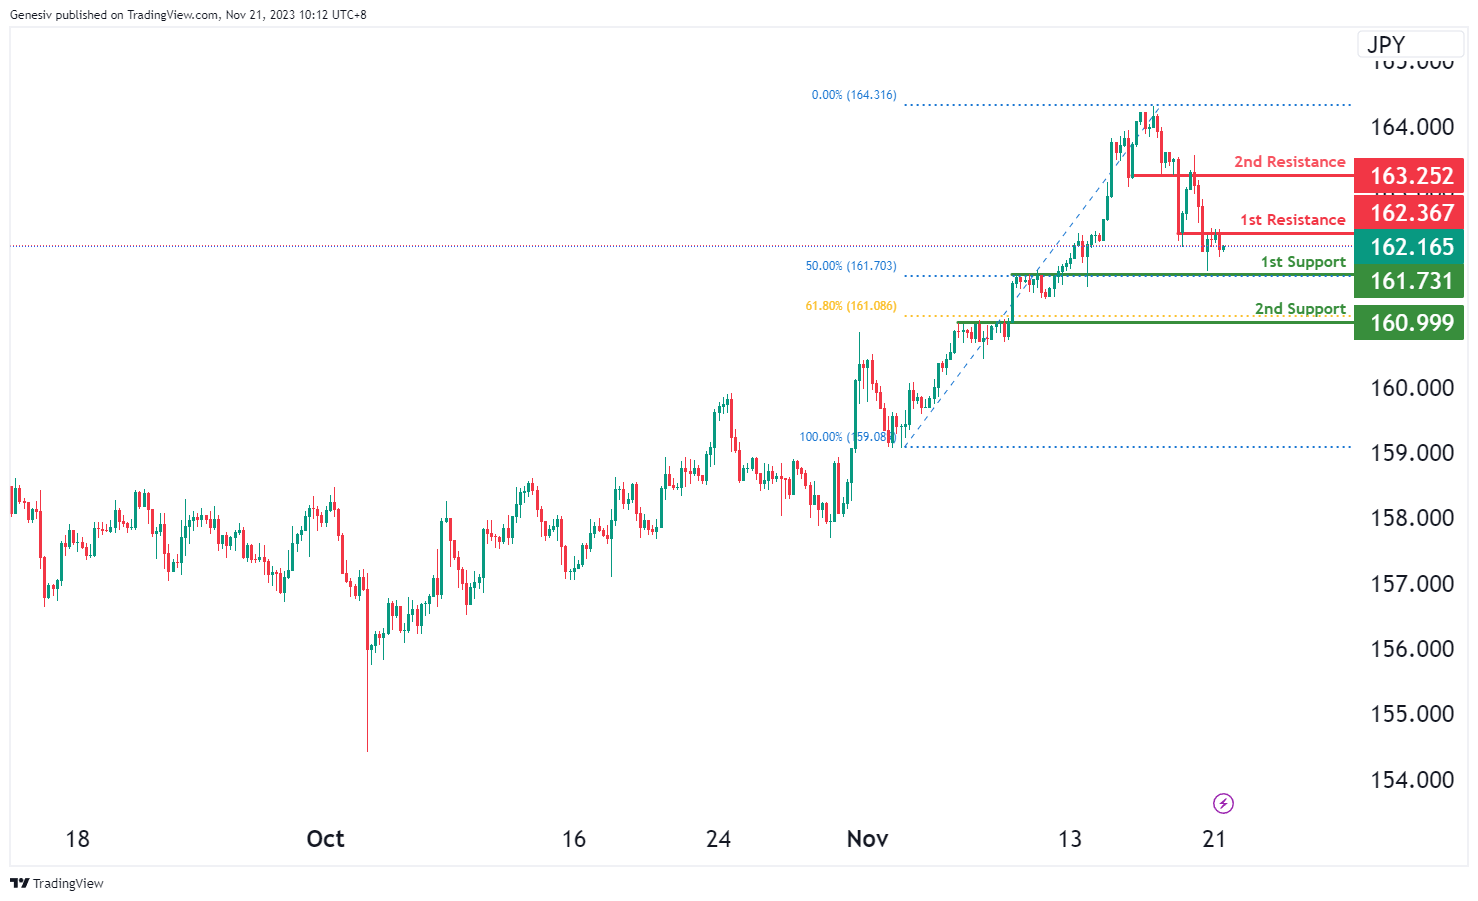
The EUR/JPY chart currently suggests a bearish momentum, indicating a potential bearish continuation towards the first support at 161.73.
The first support at 161.73 is identified as a pullback support, coinciding with the 50% Fibonacci Retracement. This suggests a strong level of potential support, indicating an area where the price might find buying interest.
Additionally, the second support at 160.99 is recognized as another pullback support, reinforcing the potential strength of the support zone with the 61.80% Fibonacci Retracement.
On the resistance side, the first resistance at 162.36 is significant due to its overlap resistance, marking a crucial level where the price might face selling pressure or potential reversals within its bearish movement. Furthermore, the second resistance at 163.25 is identified as another overlap resistance, emphasizing its importance as a potential hurdle for the price and a point where it might encounter obstacles in its bearish continuation.
EUR/GBP:
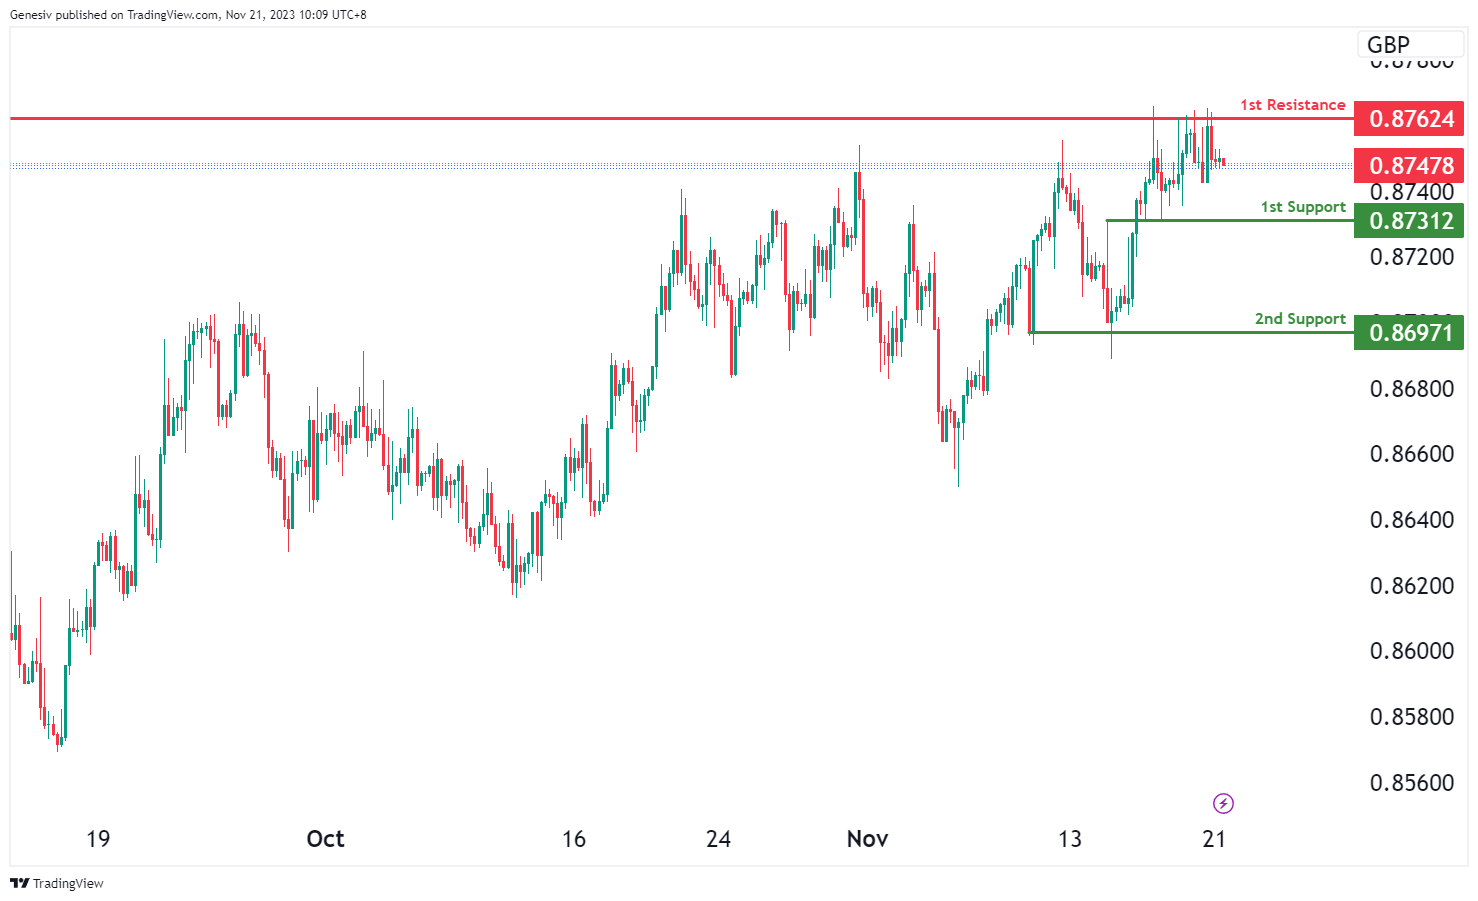
The EUR/GBP chart currently indicates a bearish momentum, suggesting a potential bearish continuation towards the first support at 0.8731.
The first support at 0.8731 is identified as a pullback support, indicating a level where the price might find buying interest. Additionally, the second support at 0.8697 is recognized as a multi-swing low support, reinforcing the potential strength of the support zone.
On the resistance side, the first resistance at 0.8762 is significant due to its overlap resistance, marking a crucial level where the price might face selling pressure or potential reversals within its downward movement.
GBP/USD:
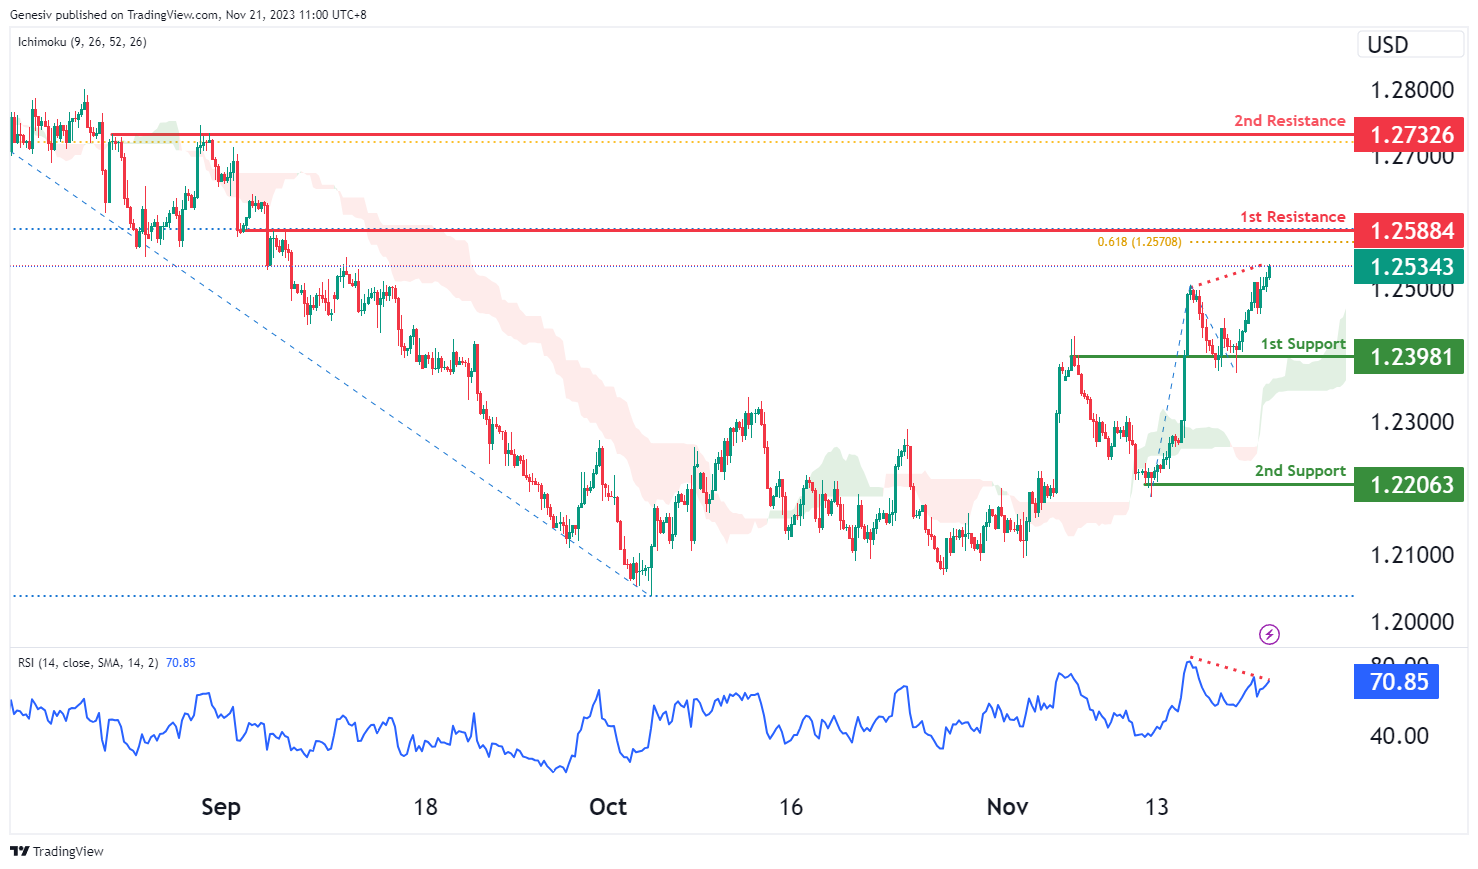
The GBP/USD chart currently has an overall bullish momentum, suggesting a potential for a bullish continuation towards the 1st resistance. However, the Relative Strength Index (RSI) is showing a bearish divergence versus the price, suggesting a potential scenario for price to reverse and fall lower.
The 1st support level at 1.2398 is identified as an overlap support. Further below, the 2nd support level at 1.2206 is marked as a pullback support, indicating a level where the bearish movement could be halted.
On the resistance side, the 1st resistance level at 1.2588 is identified as an overlap resistance that aligns with a confluence of Fibonacci levels i.e. the 50.00% retracement and the 61.80% projection levels. Higher up, the 2nd resistance level at 1.2733 is marked as a pullback resistance that aligns with the 61.80% Fibonacci retracement level, further reinforcing its potential as a resistance level.
GBP/JPY:
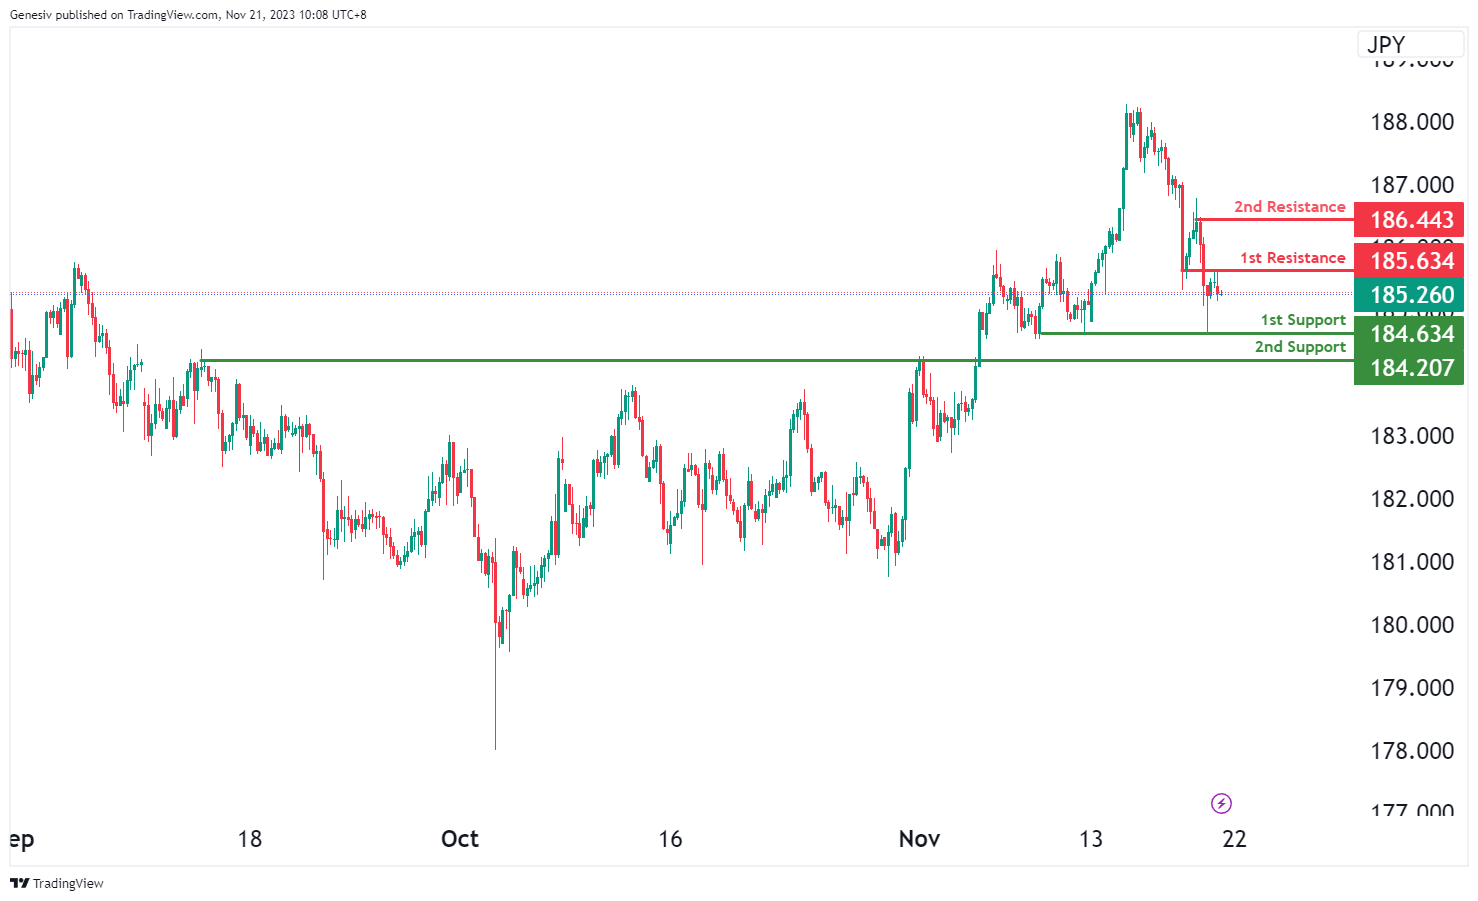
The GBP/JPY chart currently indicates a bearish momentum, suggesting a potential bearish continuation towards the first support at 184.63.
The first support at 184.63 is identified as a multi-swing low support, indicating a level where the price might find buying interest. Additionally, the second support at 184.20 is recognized as a pullback support, reinforcing the potential strength of the support zone.
On the resistance side, the first resistance at 185.63 is significant due to its overlap resistance, marking a crucial level where the price might face selling pressure or potential reversals within its downward movement. Furthermore, the second resistance at 186.44 is identified as a swing high resistance, emphasizing its importance as a potential hurdle for the price and a point where it might encounter obstacles in its bearish continuation.
USD/CHF:
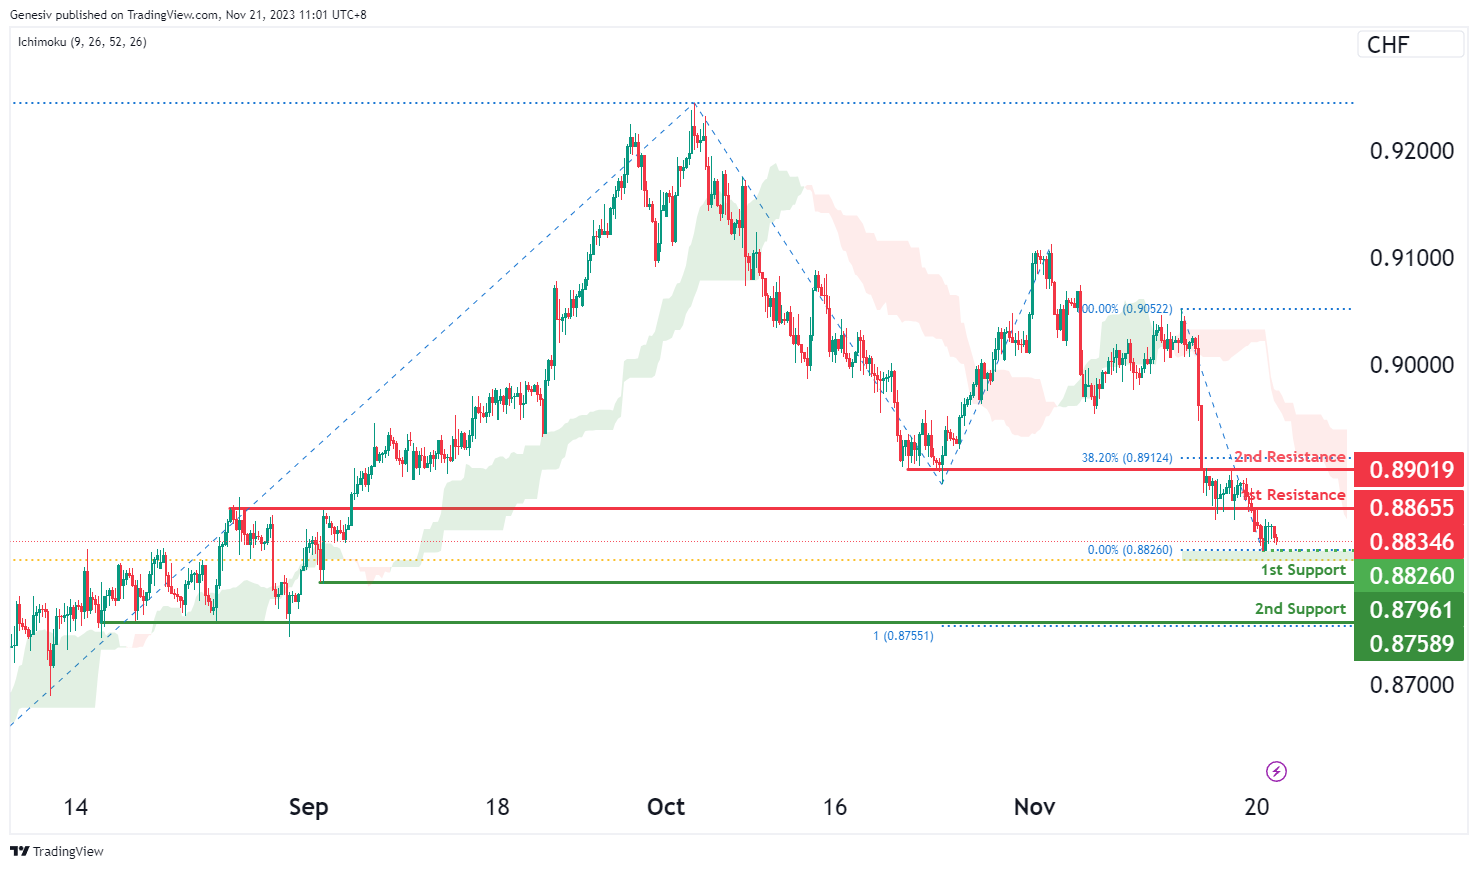
The USD/CHF chart currently has an overall bearish momentum, suggesting the potential for price to make a bearish continuation towards the 1st support should price break below the intermediate support.
The intermediate support level at 0.8826 is identified as a pullback support that aligns close to the 61.80% Fibonacci retracement level while the 1st support level at 0.8796 is also identified as a pullback support. Further below, the 2nd support level at 0.8759 is marked as a pullback support that aligns with the 100.00% Fibonacci projection level, suggesting a significant level of support.
To the upside, the 1st resistance level at 0.8866 is categorized as an overlap resistance. Higher up, the 2nd resistance level at 0.8902 is also marked as an overlap resistance that aligns close to the 38.20% Fibonacci retracement level, indicating a potential area where price could halt its bullish momentum.
USD/JPY:
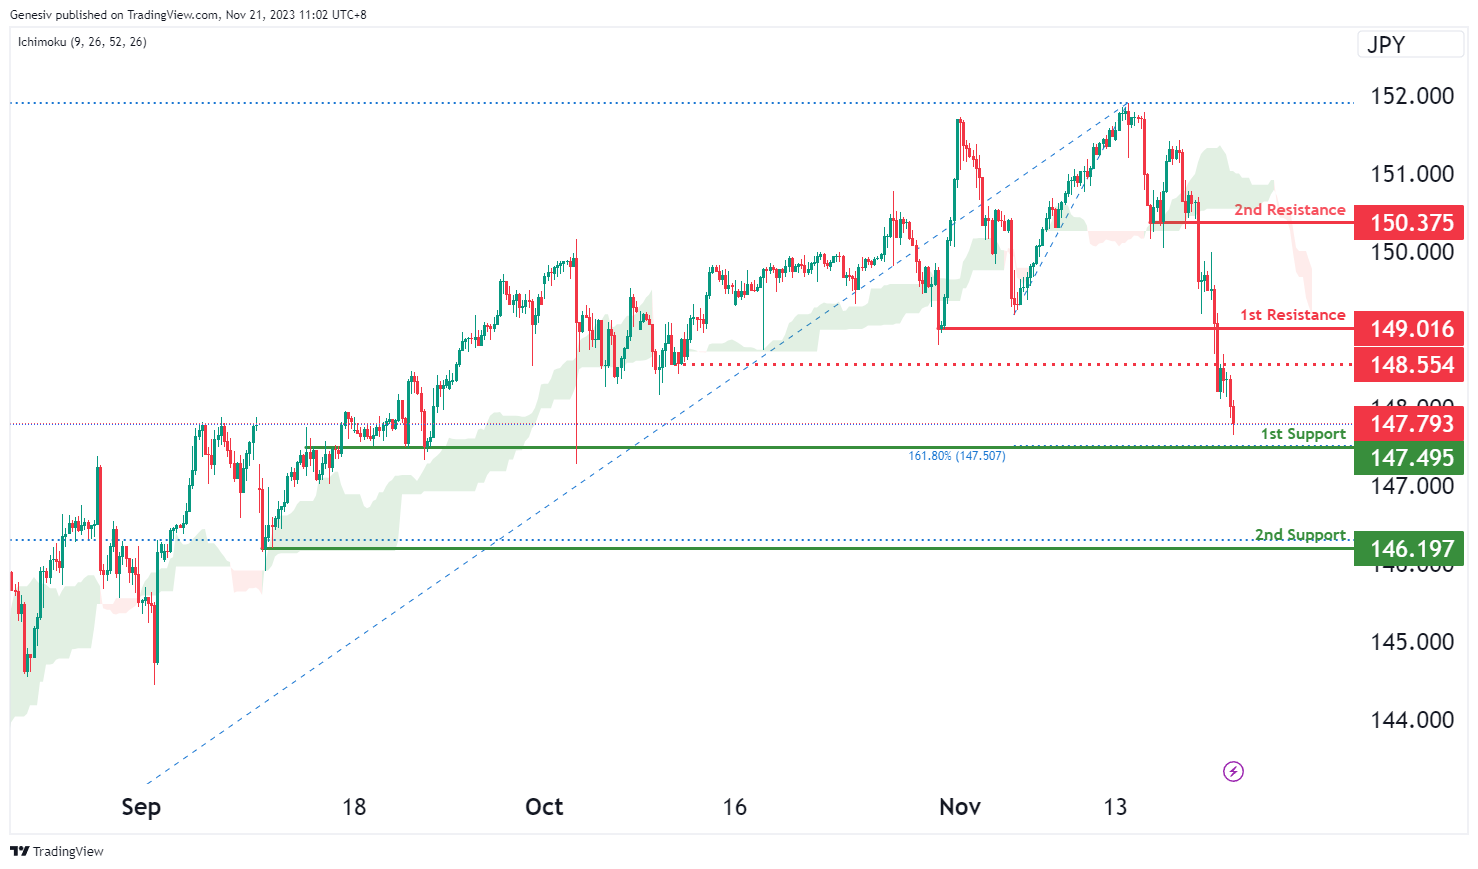
The USD/JPY chart currently has an overall bearish momentum, suggesting the potential for a bearish continuation towards the 1st support.
The 1st support level at 147.49 is identified as an overlap support that coincides with the 161.80% Fibonacci extension level. Further below, the 2nd support level at 146.19 is noted as a pullback support that aligns with the 38.20% Fibonacci retracement level, potentially acting as a strong barrier against further bearish momentum.
On the resistance side, the intermediate resistance level at 148.55 is identified as a pullback resistance while the 1st resistance level at 149.02 is also categorized as a pullback resistance.Higher up, the 2nd resistance level at 150.38 is noted as a pullback resistance, potentially acting as a barrier to further upward movement.
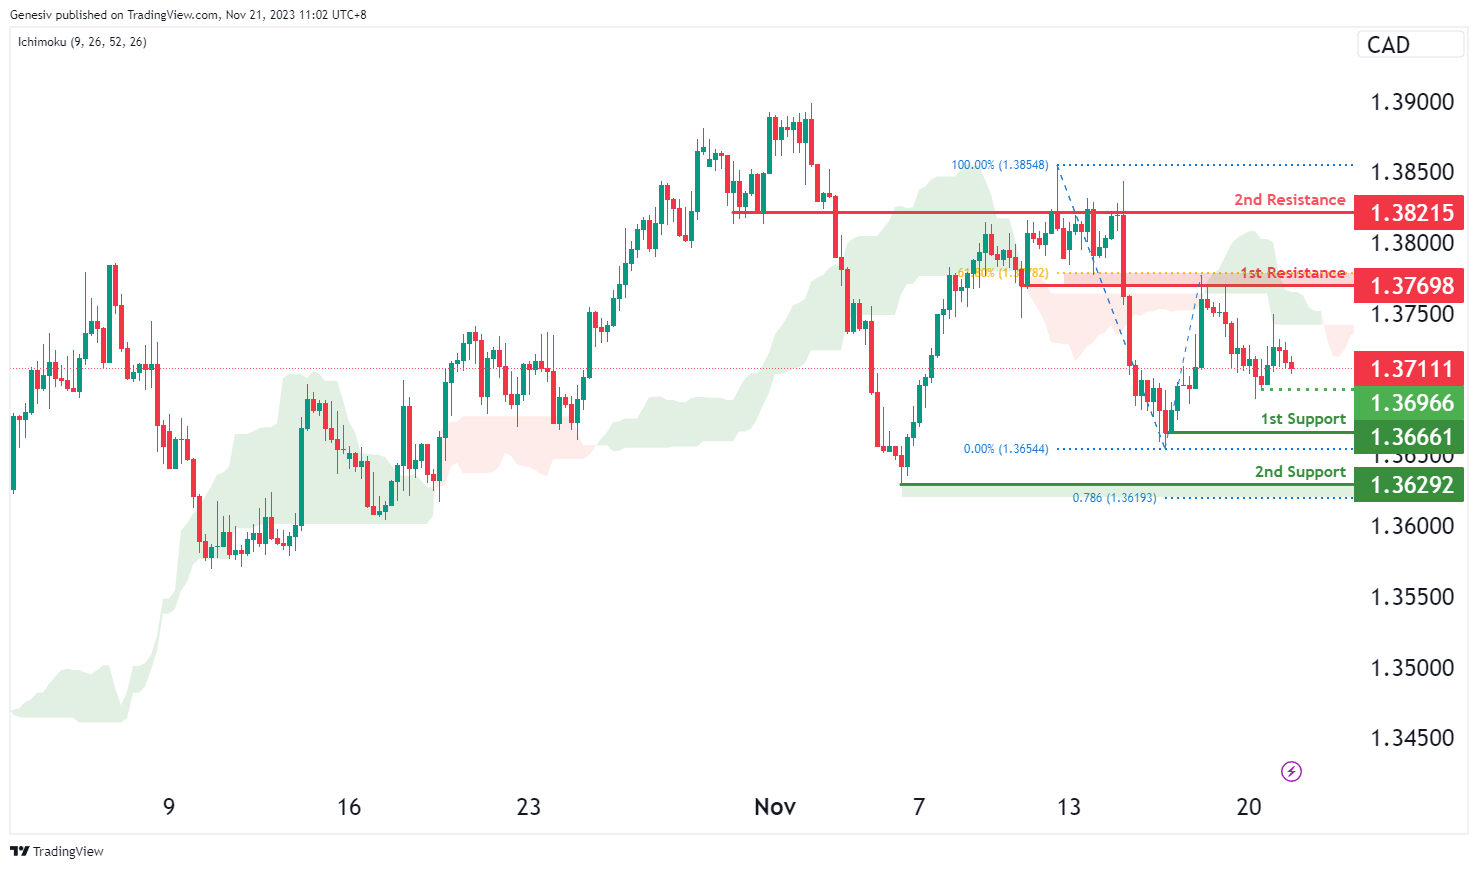
USD/CAD:
The USD/CAD chart currently exhibits an overall bearish momentum, indicating the potential for a bearish continuation towards the 1st support should price break below the intermediate support.
The intermediate support level at 1.3697 is identified as a pullback support while the 1st support level at 1.3666 is also considered as a pullback support. Further below, the 2nd support level at 1.3629 is identified as a swing-low support that aligns with the 78.60% Fibonacci projection level, further reinforcing the potential for price to find support in this region.
On the resistance side, the 1st resistance level at 1.3769 is categorized as an overlap resistance that aligns close to the 61.80% Fibonacci retracement level. Higher up, the 2nd resistance level at 1.3822 is also noted as an overlap resistance, potentially acting as a barrier to further upward movement.
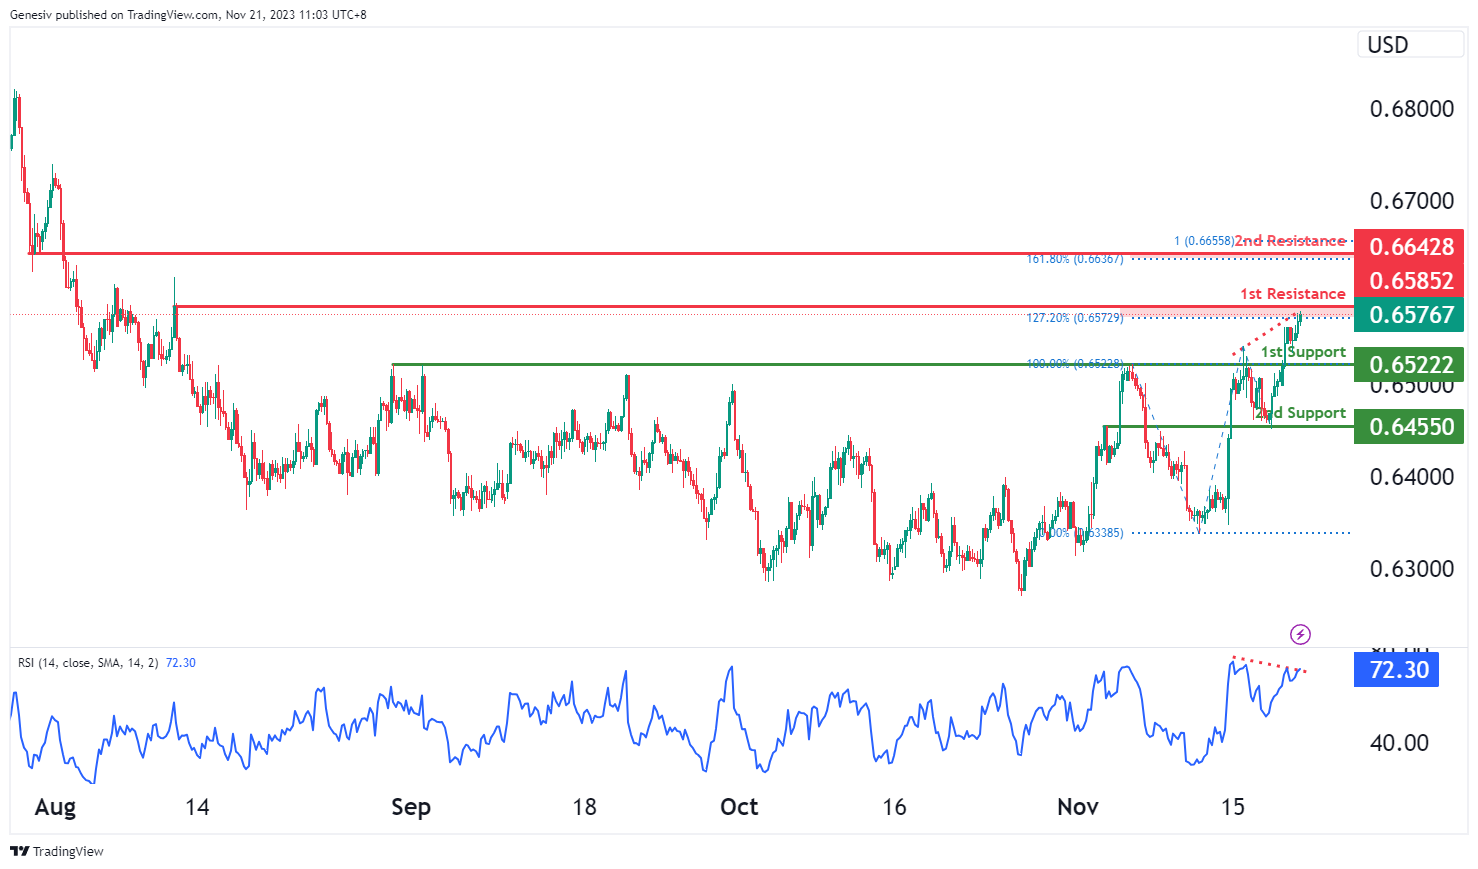
AUD/USD:
The AUD/USD chart currently has overall bullish momentum, suggesting the potential for a bullish continuation towards the 1st resistance. However, the Relative Strength Index (RSI) is showing a bearish divergence versus the price, suggesting a potential scenario for price to reverse and fall lower.
The 1st resistance level at 0.6585 is categorized as a pullback resistance that coincides with the 127.20% Fibonacci extension level. Higher up, the 2nd resistance level at 0.6643 is also noted as a pullback resistance that coincides with the 16.80% Fibonacci extension level, indicating a potential level where price may halt its bullish momentum.
To the downside, the 1st support level at 0.6522 is identified as a pullback support. Further below, the 2nd support level at 0.6455 is noted as an overlap support, indicating a zone where price may find strong support.
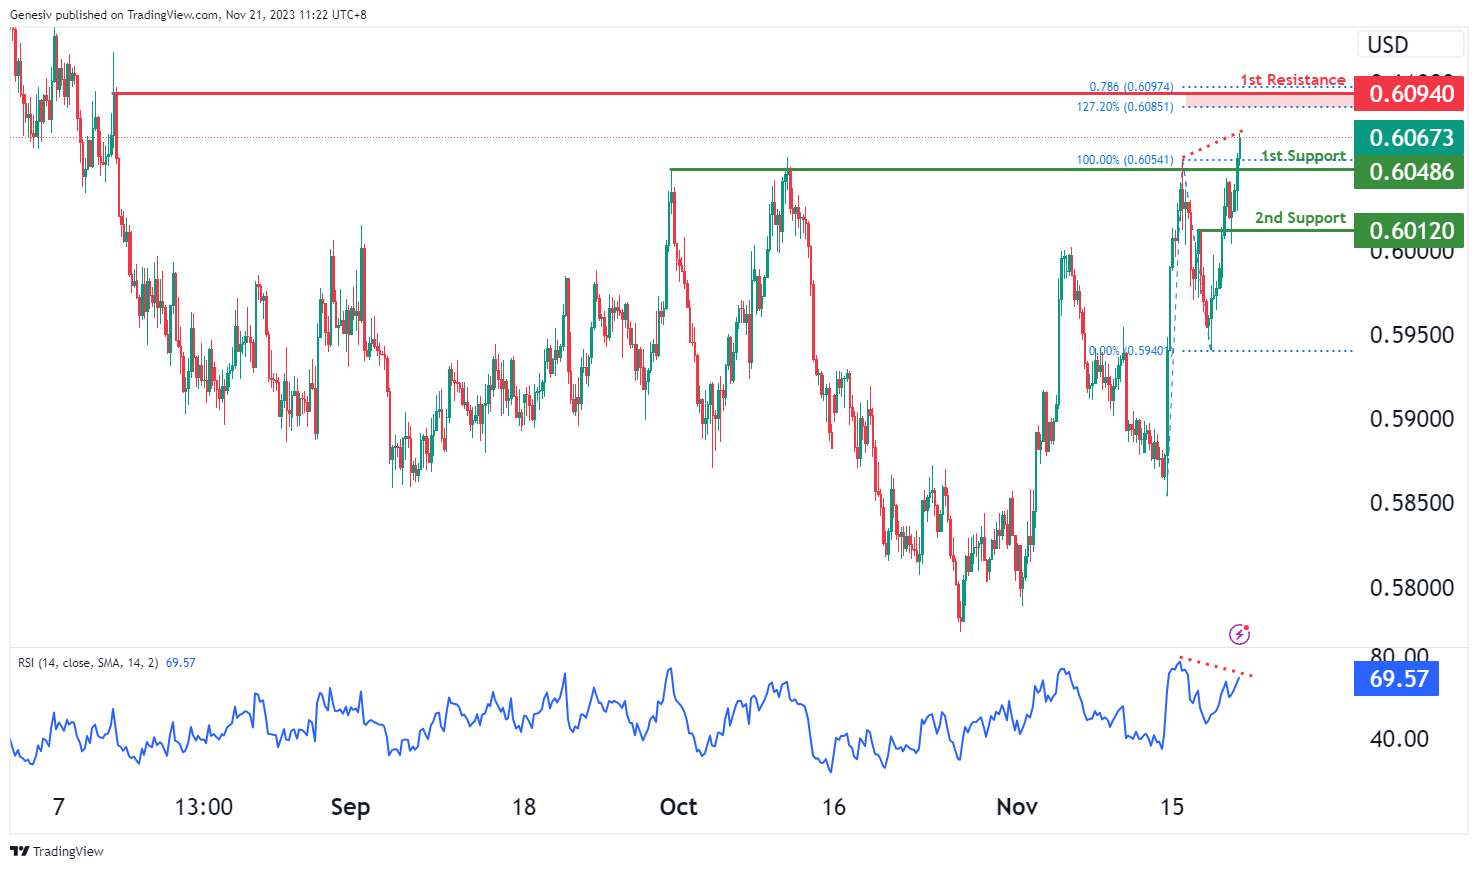
NZD/USD
The NZD/USD chart currently has an overall bullish momentum, suggesting the potential for a bullish continuation towards the 1st resistance. However, the Relative Strength Index (RSI) is showing a bearish divergence versus the price, suggesting a potential scenario for price to reverse and fall lower.
The 1st support at 0.6049 is identified as a pullback support. Further below, the 2nd support level at 0.6012 is noted as an overlap support where price may potentially find strong support around this zone.
To the upside, the 1st resistance level at 0.6094 is categorized as a pullback resistance that aligns with a confluence of Fibonacci levels i.e. the 127.20% extension and the 78.60% projection levels, potentially acting as a barrier to further upward movement.
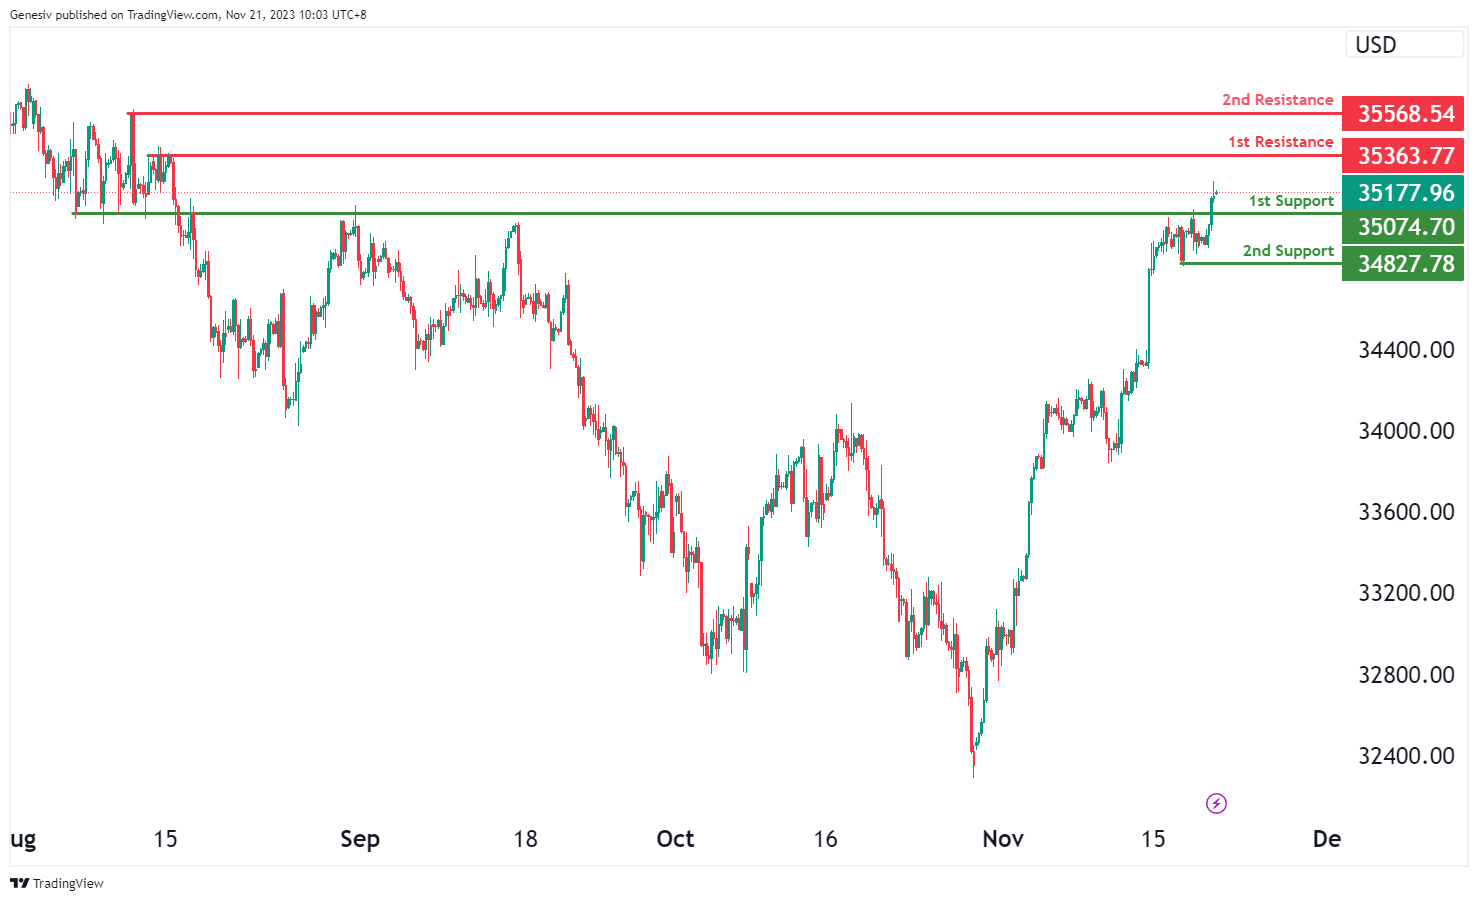
DJ30:
The DJ30 chart currently indicates a bullish momentum, suggesting a potential bullish continuation towards the first resistance at 35363.77.
The first support at 35074.70 is identified as a pullback support, indicating a level where the price might find buying interest. Additionally, the second support at 34827.78 is recognized as a swing low support, reinforcing the potential strength of the support zone.
On the resistance side, the first resistance at 35363.77 is significant due to its multi-swing high resistance, marking a crucial level where the price might face selling pressure or potential reversals within its upward movement. Furthermore, the second resistance at 35568.54 is identified as a swing high resistance, emphasizing its importance as a potential hurdle for the price and a point where it might encounter obstacles in its bullish continuation.
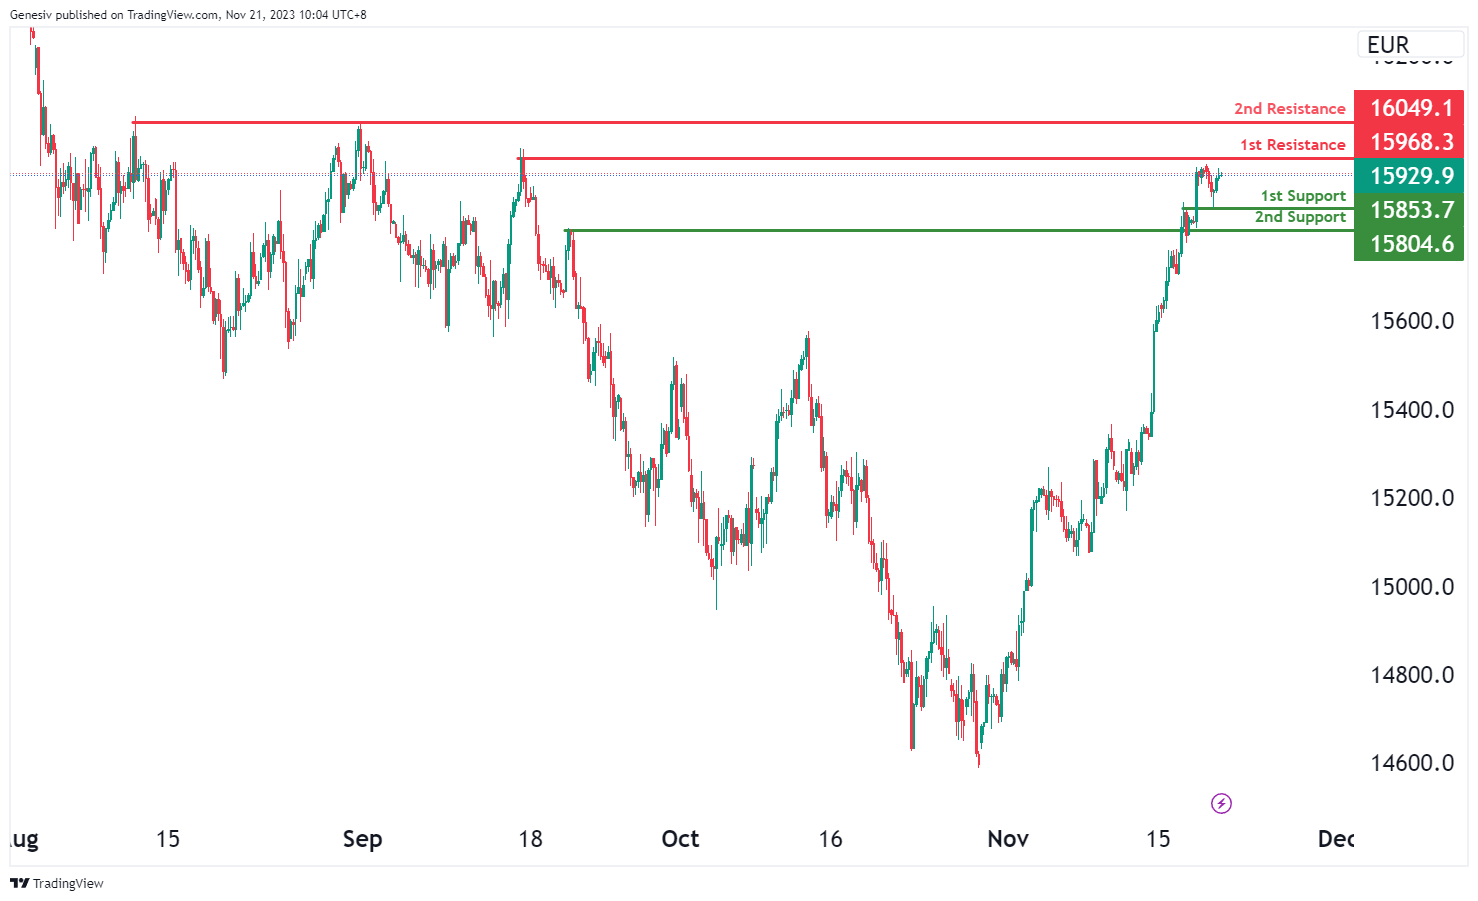
GER40:
The GER40 chart currently indicates a bullish momentum, suggesting a potential bullish continuation towards the first resistance at 15968.3.
The first support at 15853.7 is identified as an overlap support, indicating a level where the price might find buying interest. Additionally, the second support at 15804.6 is recognized as another overlap support, reinforcing the potential strength of the support zone.
On the resistance side, the first resistance at 15968.3 is significant due to its swing high resistance, marking a crucial level where the price might face selling pressure or potential reversals within its upward movement. Furthermore, the second resistance at 16049.1 is identified as a multi-swing high resistance, emphasizing its importance as a potential hurdle for the price and a point where it might encounter obstacles in its bullish continuation.
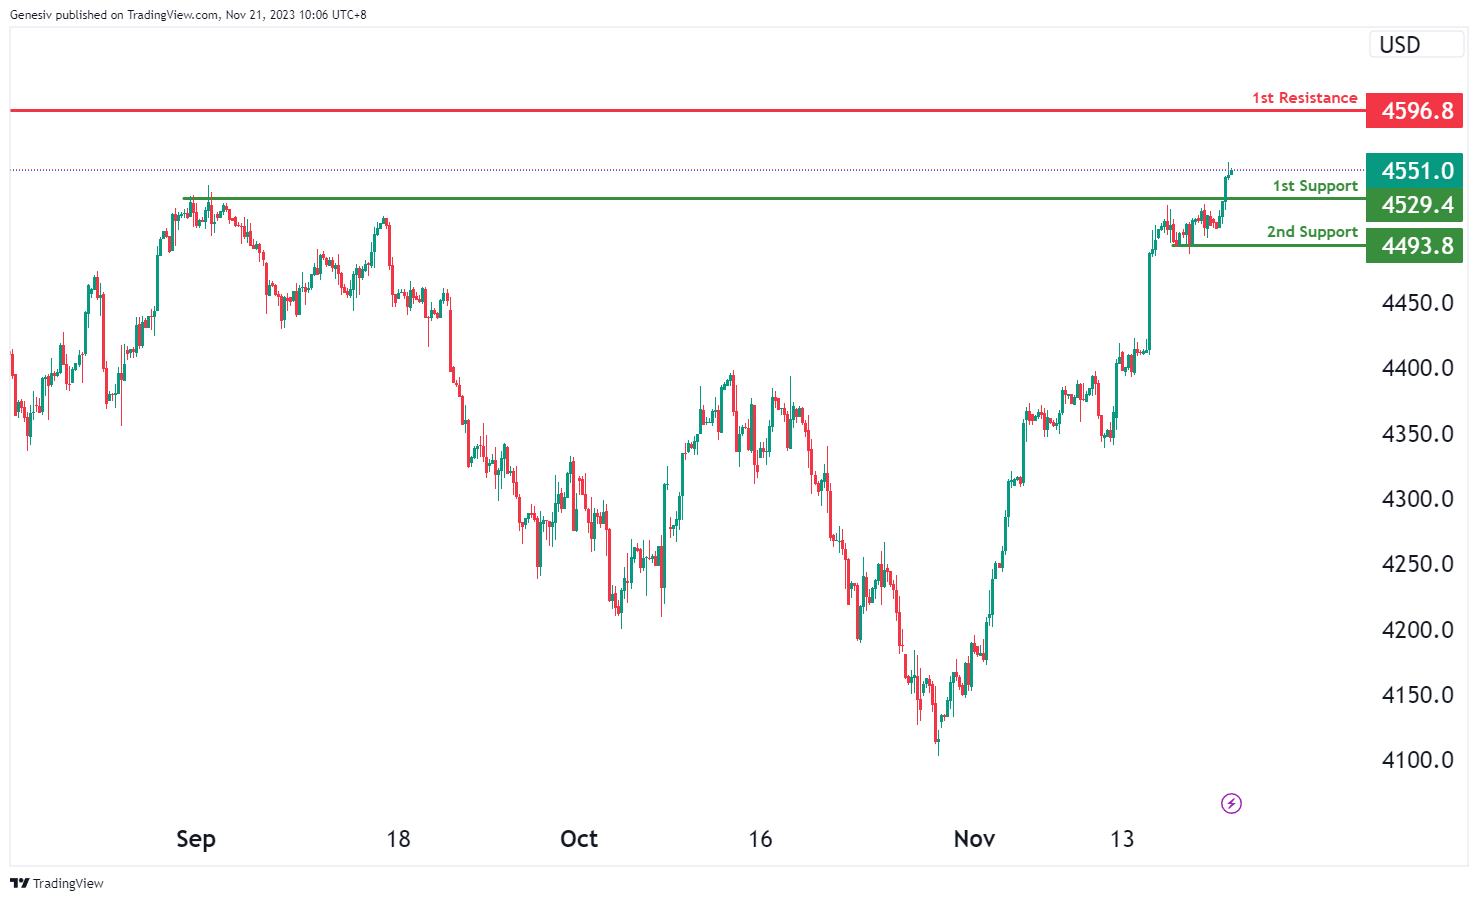
US500
The US500 chart currently indicates a bullish momentum, suggesting a potential bullish continuation towards the first resistance at 4596.8.
The first support at 4529.4 is identified as a pullback support, indicating a level where the price might find buying interest. Additionally, the second support at 4493.8 is recognized as a multi-swing low support, reinforcing the potential strength of the support zone.
On the resistance side, the first resistance at 4596.8 is significant due to its swing high resistance, marking a crucial level where the price might face selling pressure or potential reversals within its upward movement.
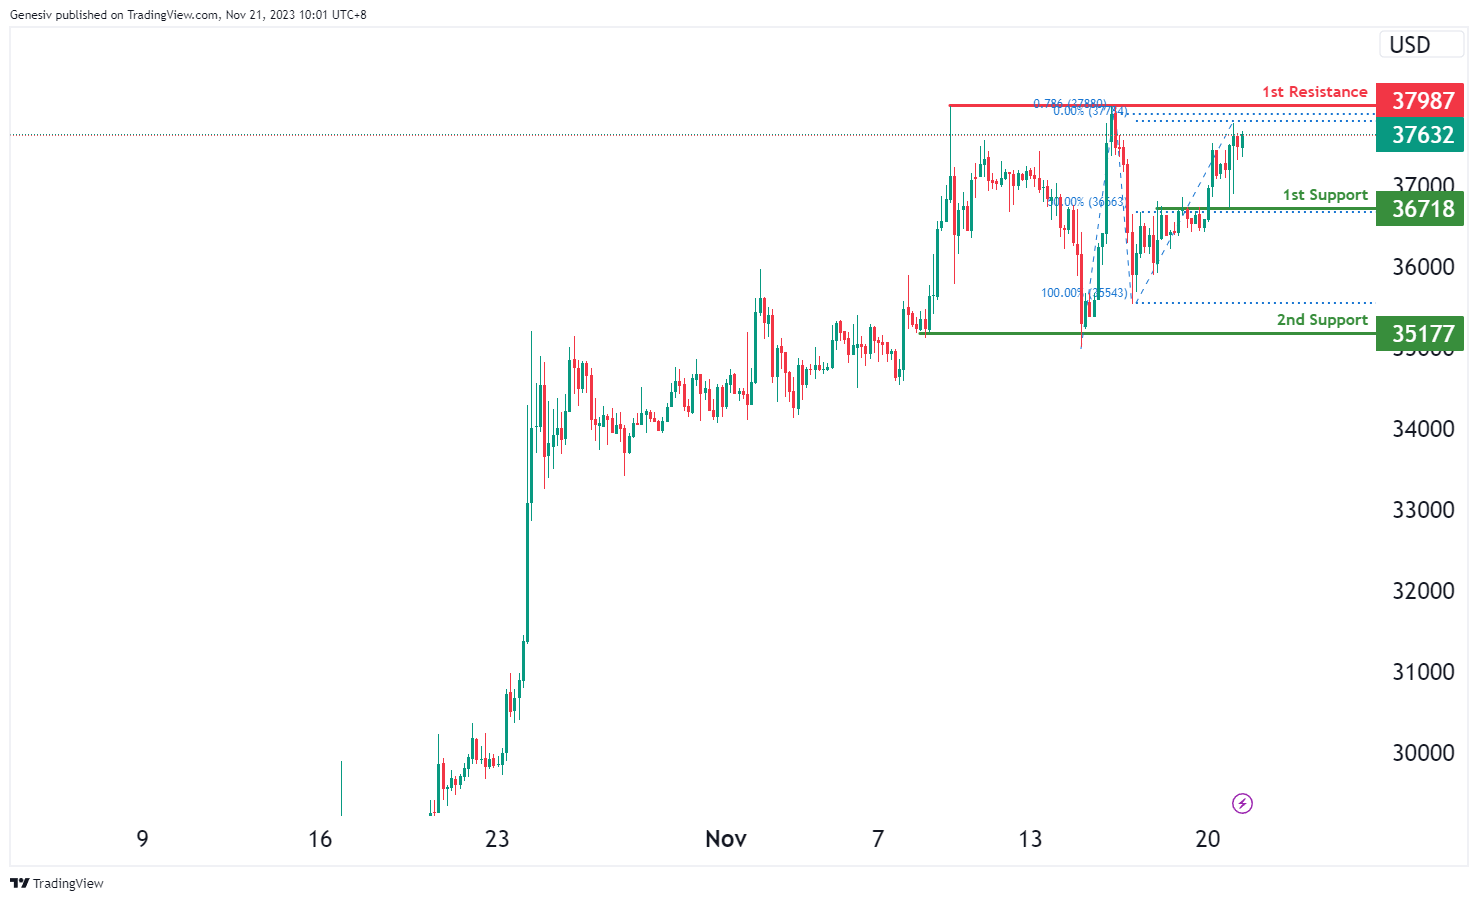
BTC/USD:
The BTC/USD chart currently exhibits a bullish momentum, indicating a potential bullish continuation towards the first resistance at 37987.
The first support at 36718 is identified as an overlap support, coinciding with the 50% Fibonacci Retracement. This suggests a strong level of potential support, indicating an area where the price might find buying interest.
Additionally, the second support at 35177 is recognized as a multi-swing low support, further reinforcing the potential strength of the support zone.
On the resistance side, the first resistance at 37987 is significant due to its multi-swing high resistance, and it aligns with the 78.60% Fibonacci Projection. This indicates a crucial level where the price might face selling pressure or potential reversals within its upward movement.
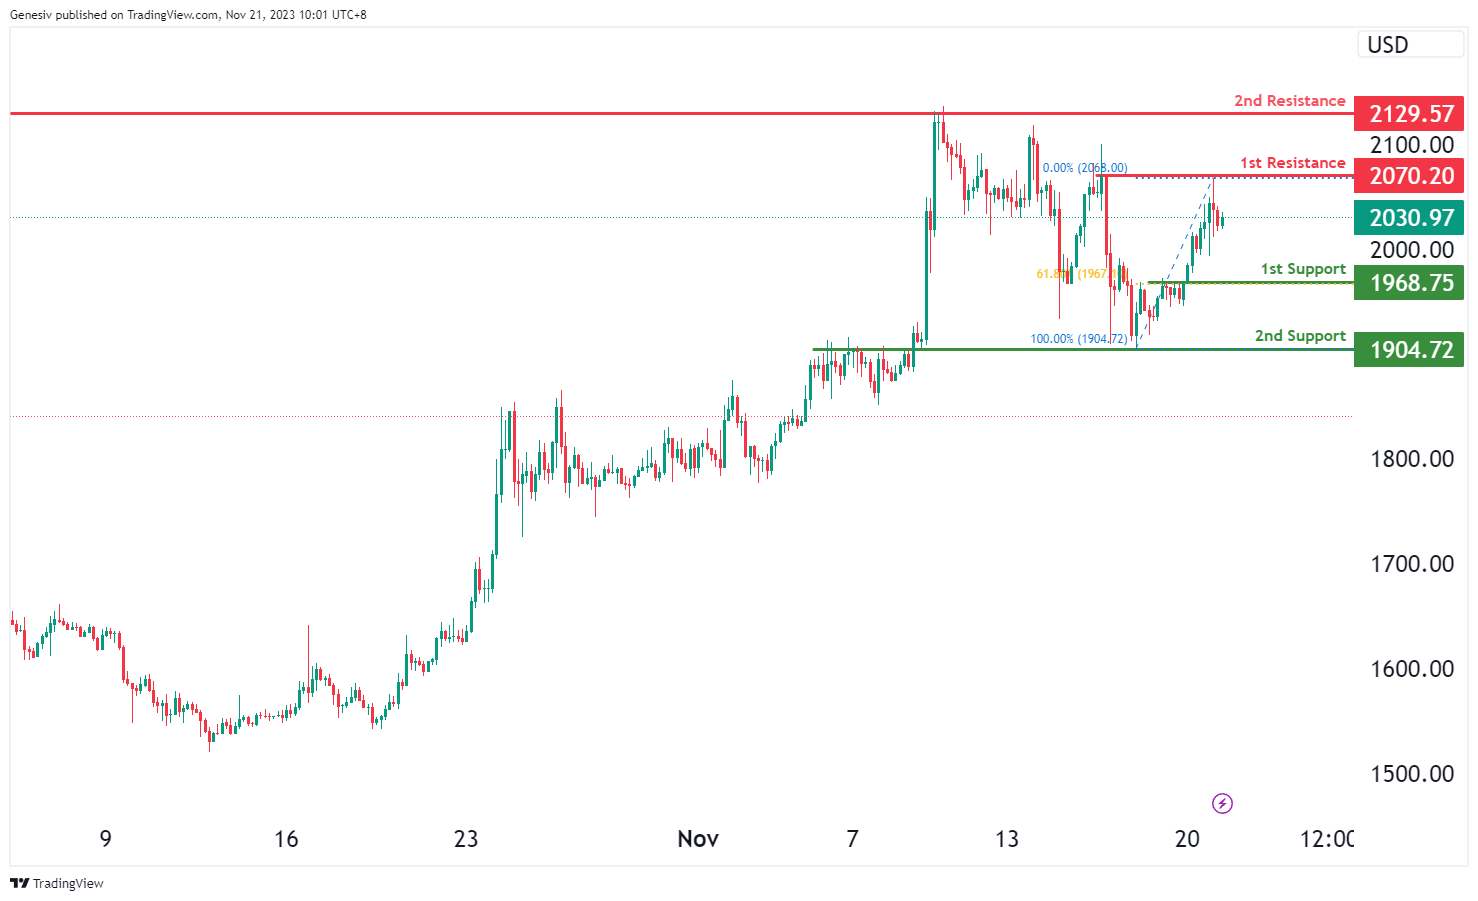
ETH/USD:
The ETH/USD chart currently indicates a bullish momentum, suggesting a potential bullish continuation towards the first resistance at 2070.20.
The first support at 1968.75 is identified as a pullback support, coinciding with the 61.80% Fibonacci Retracement. This suggests a strong level of potential support, indicating an area where the price might find buying interest.
Additionally, the second support at 1904.72 is recognized as an overlap support, further reinforcing the potential strength of the support zone.
On the resistance side, the first resistance at 2070.20 is significant due to its multi-swing high resistance, marking a crucial level where the price might face selling pressure or potential reversals within its upward movement. Furthermore, the second resistance at 2129.57 is identified as another multi-swing high resistance, emphasizing its importance as a potential hurdle for the price and a point where it might encounter obstacles in its bullish continuation.
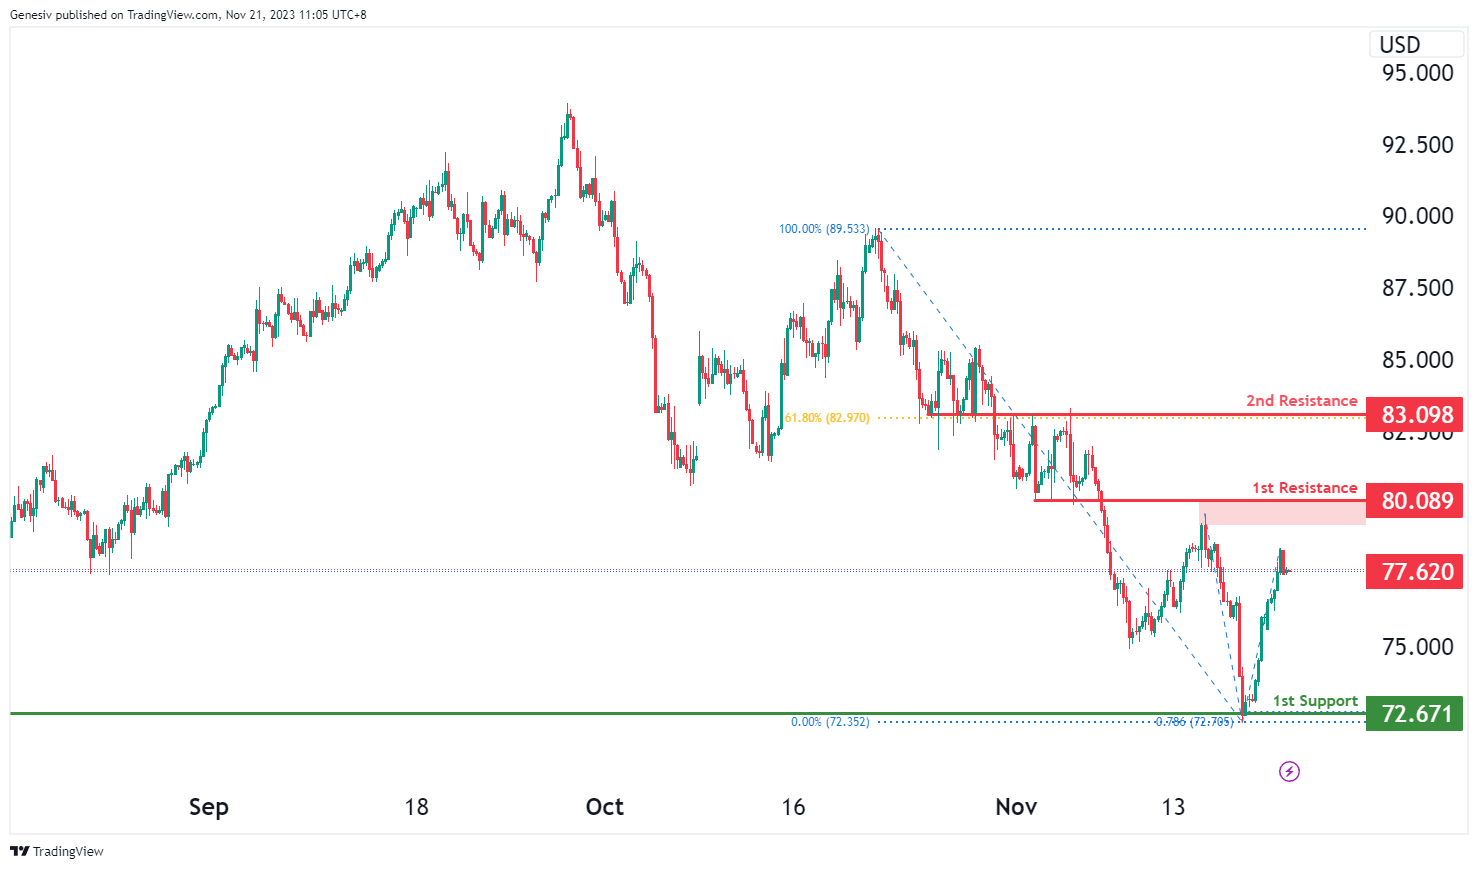
WTI/USD:
The WTI chart currently has a weak bullish momentum, suggesting a potential for a bullish continuation towards the 1st resistance.
The 1st resistance level at 80.09 is categorized as an overlap resistance.Higher up, the 2nd resistance level at 83.09 is also noted as an overlap resistance that aligns with the 61.80% Fibonacci retracement level, suggesting a strong barrier against further bullish momentum..
To the downside, the 1st support level at 72.67 is identified as an overlap support that aligns with the 78.60% Fibonacci projection level, indicating a potentially strong support zone.
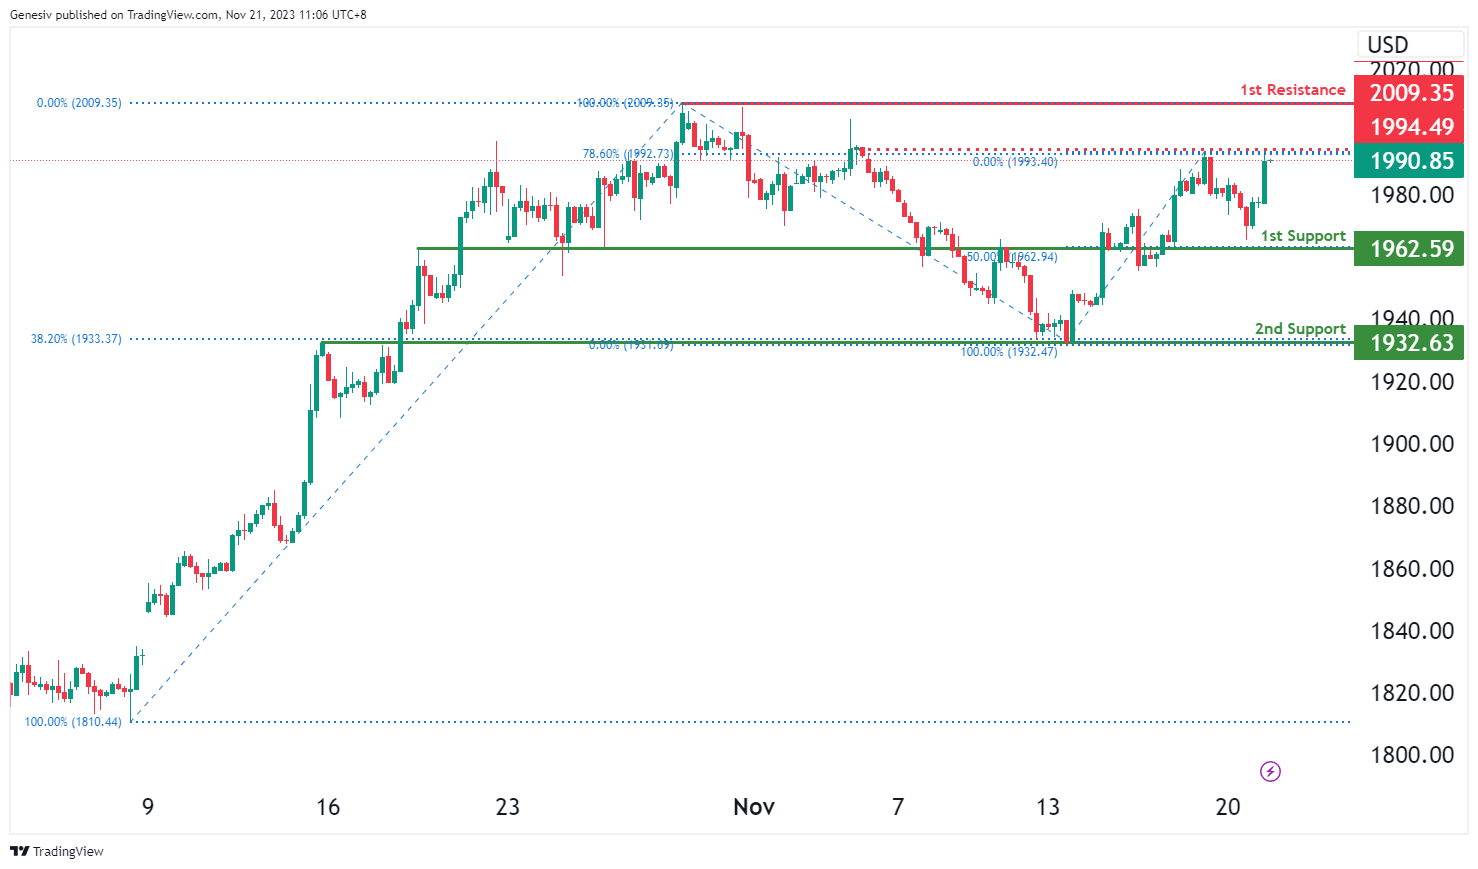
XAU/USD (GOLD):
The XAU/USD chart currently has an overall bullish momentum, suggesting the potential for a bullish continuation towards the 1st resistance should price break above the intermediate resistance.
The intermediate resistance level at 1994.49 is categorized as a pullback resistance that aligns with the 78.60% Fibonacci retracement level. Higher up, the 1st resistance level at 2009.35 is categorized as a pullback resistance, potentially leading to a halt in the bullish momentum.
To the downside, the 1st support level at 1962.59 is identified as an overlap support that aligns with the 50.00% Fibonacci retracement level. Further below, the 2nd support level at 1932.63 is also noted as an overlap support that aligns with the 38.20% Fibonacci retracement level, indicating a potentially strong support area.


 is showing a bearish divergence versus the price, suggesting a potential scenario for price to reverse and fall lower.)