
DXY:
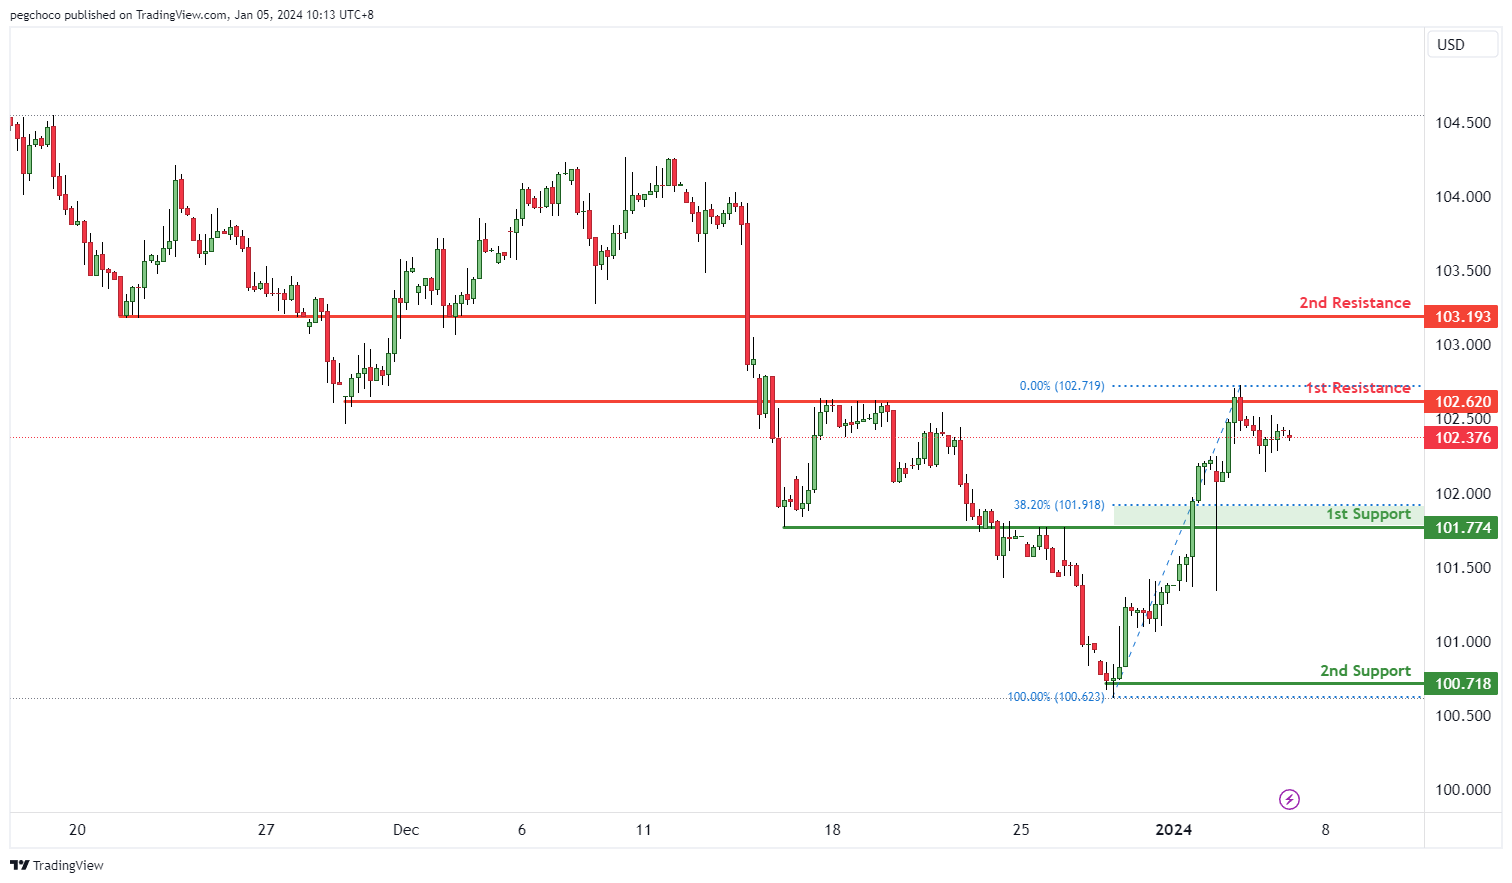
The DXY (US Dollar Index) chart currently has a bearish overall momentum, indicating weakness in the US Dollar.
Price could potentially continue its bearish movement towards the 1st support level.
The 1st support at 101.77 is categorized as a pullback support and is associated with the 38.20% Fibonacci Retracement level. This level may act as a significant area where buying interest could emerge, providing temporary support for the DXY.
The 2nd support at 100.71 is identified as a swing low support, further reinforcing its significance as a potential support zone.
On the resistance side, the 1st resistance at 102.62 is categorized as an overlap resistance. This level may act as a substantial barrier where selling interest could intensify, potentially hindering the bullish movement in the short term.
The 2nd resistance at 103.16 is noted as a pullback resistance. This level could play a role in reversing or slowing down any upward movement of the DXY.
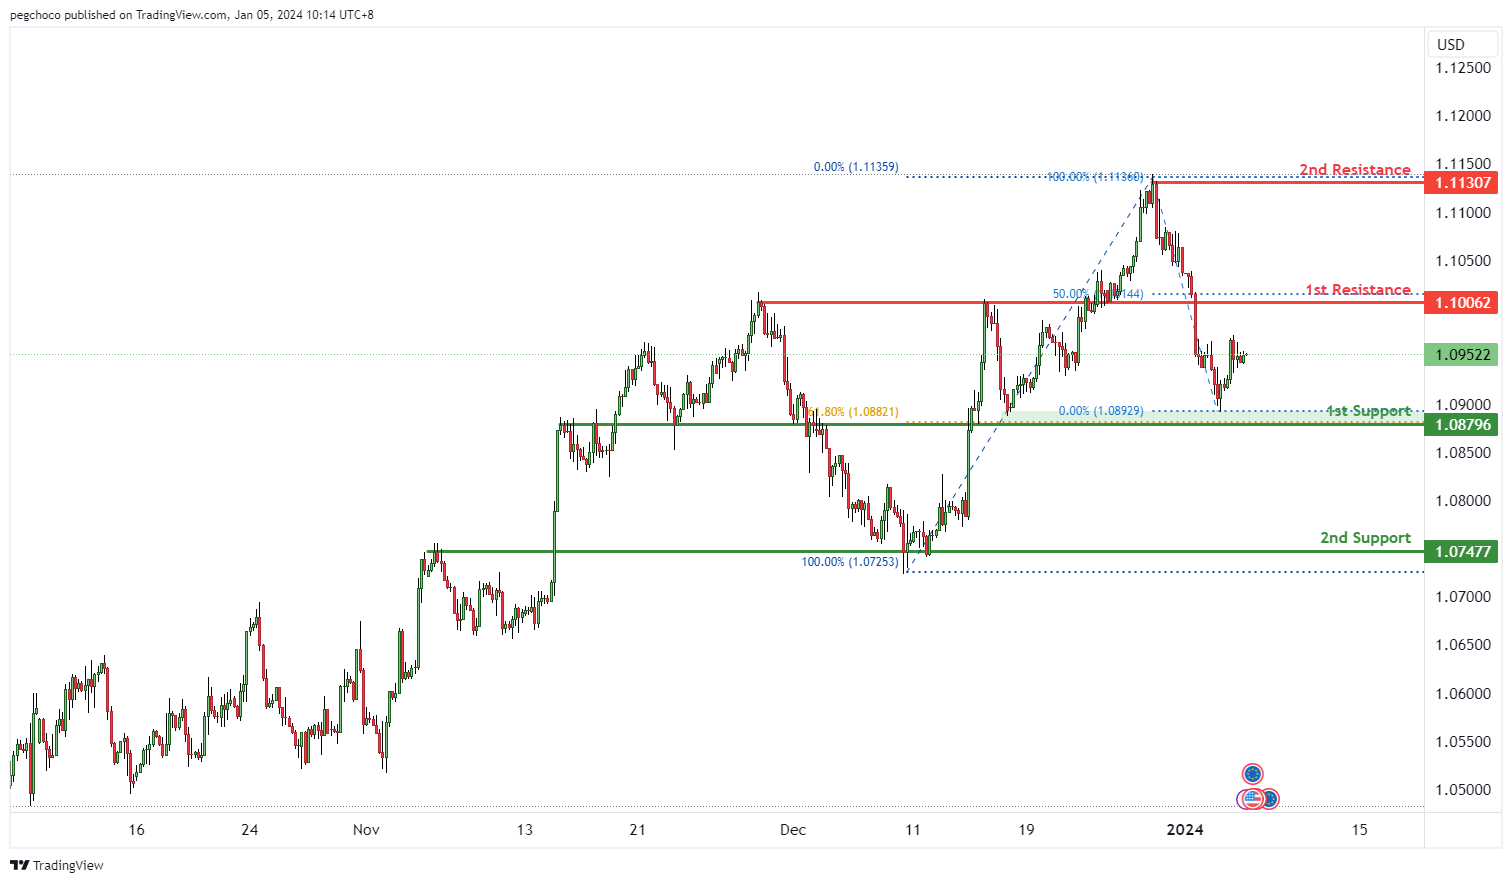
EUR/USD:
The EUR/USD chart currently exhibits a bullish overall momentum, suggesting strength in the Euro against the US Dollar.
Price could potentially continue its bullish movement towards the 1st resistance level.
The 1st support at 1.0879 is categorized as an overlap support and is associated with the 61.80% Fibonacci Retracement level. This level may act as a significant area where buying interest could emerge, providing temporary support for the EUR/USD.
The 2nd support at 1.0747 is identified as an overlap support, further reinforcing its significance as a potential support zone.
On the resistance side, the 1st resistance at 1.1006 is categorized as a pullback resistance. This level may act as a substantial barrier where selling interest could intensify, potentially slowing down the bullish movement in the short term.
The 2nd resistance at 1.1130 is noted as a swing high resistance. Swing highs often mark points of reversal or resistance in price movement and could pose a significant obstacle to further upward movement in the EUR/USD.
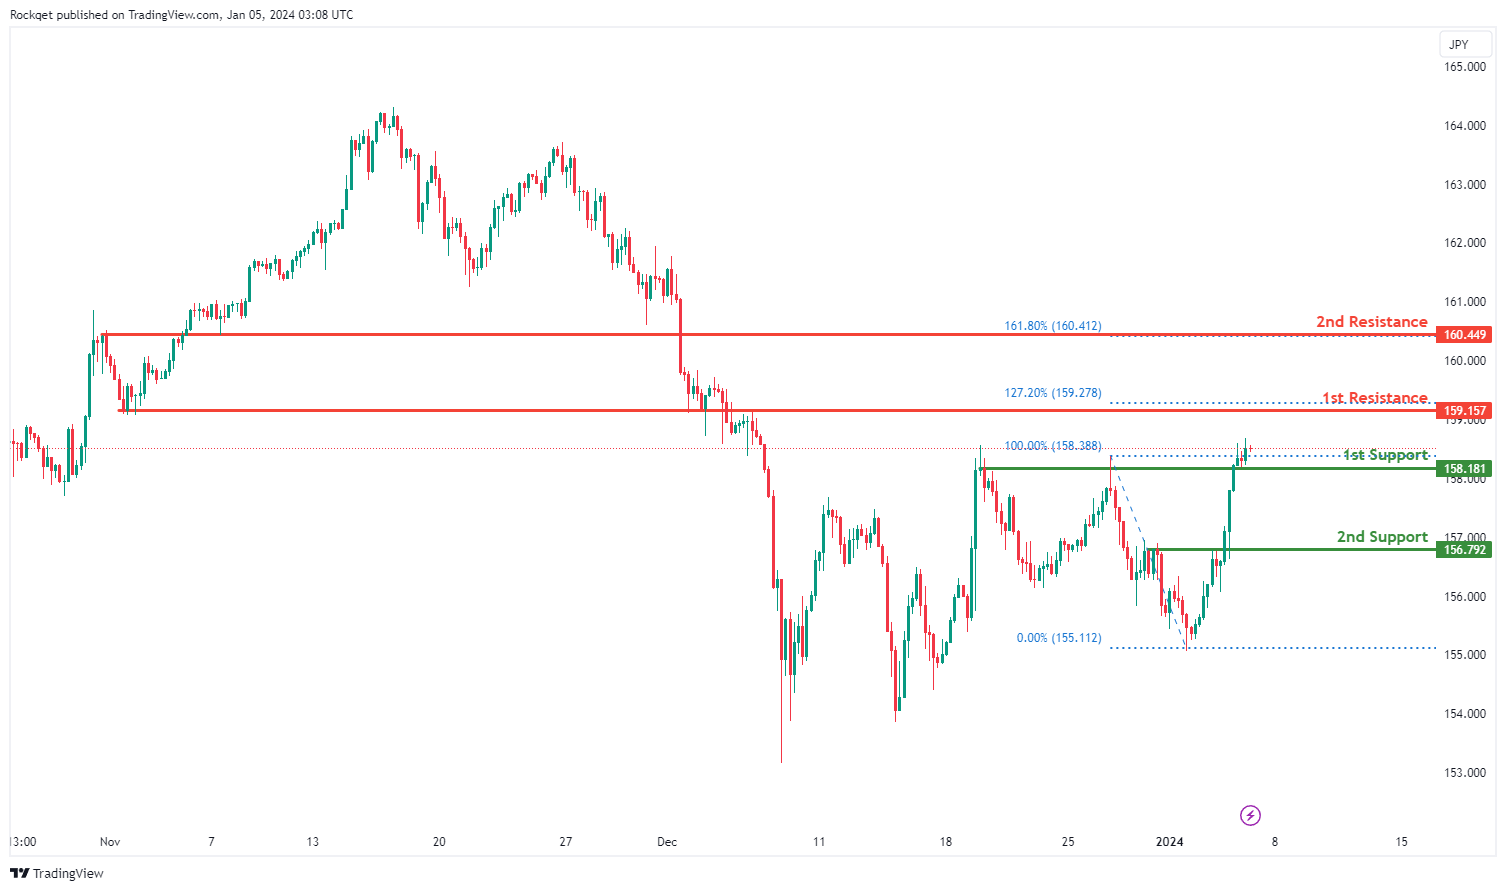
EUR/JPY:
The EUR/JPY chart currently displays a bullish overall momentum, suggesting an inclination towards an upward trend. There is a potential scenario for a bullish continuation towards the 1st resistance.
The 1st support at 158.18 is identified as an overlap support, indicating historical significance as a level where buying interest has previously emerged.
The 2nd support at 156.79 is recognized as a pullback support, providing an additional layer of potential buying interest.
On the resistance side, the 1st resistance at 159.16 is marked as an overlap resistance and aligns with the 127.20% Fibonacci Extension, making it a notable level where selling interest could materialise.
The 2nd resistance at 160.45 is identified as an overlap resistance and coincides with the 161.80% Fibonacci Extension, adding significance to this potential resistance level.
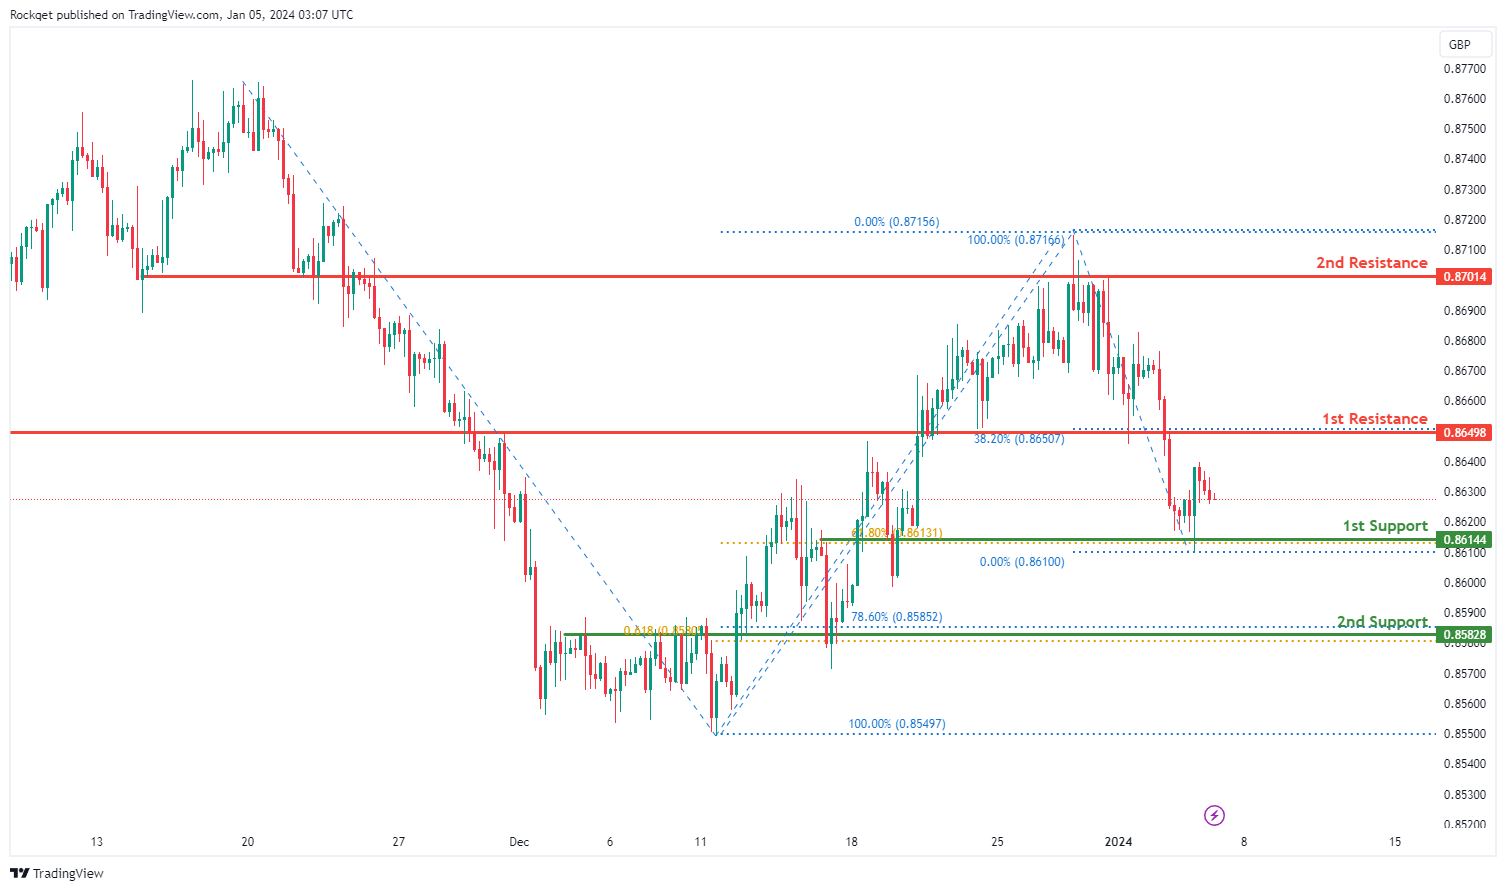
EUR/GBP:
The EUR/GBP chart currently exhibits a bearish overall momentum, indicating a tendency toward a downward trend. There is a potential scenario for a bearish continuation towards the 1st support.
The 1st support at 0.8614 is identified as an overlap support, suggesting historical significance as a level where buying interest has previously emerged. The 61.80% Fibonacci Retracement further reinforces the potential significance of this support level.
The 2nd support at 0.8583 is recognized as an overlap support and coincides with the 78.60% Fibonacci Retracement, adding confluence to its potential as a support level, along with the 61.80% Fibonacci Projection.
On the resistance side, the 1st resistance at 0.8650 is noted as an overlap resistance and aligns with the 38.20% Fibonacci Retracement, making it a notable level where selling interest could materialise.
The 2nd resistance at 0.8701 is identified as an overlap resistance, providing an additional level where selling pressure might be encountered.
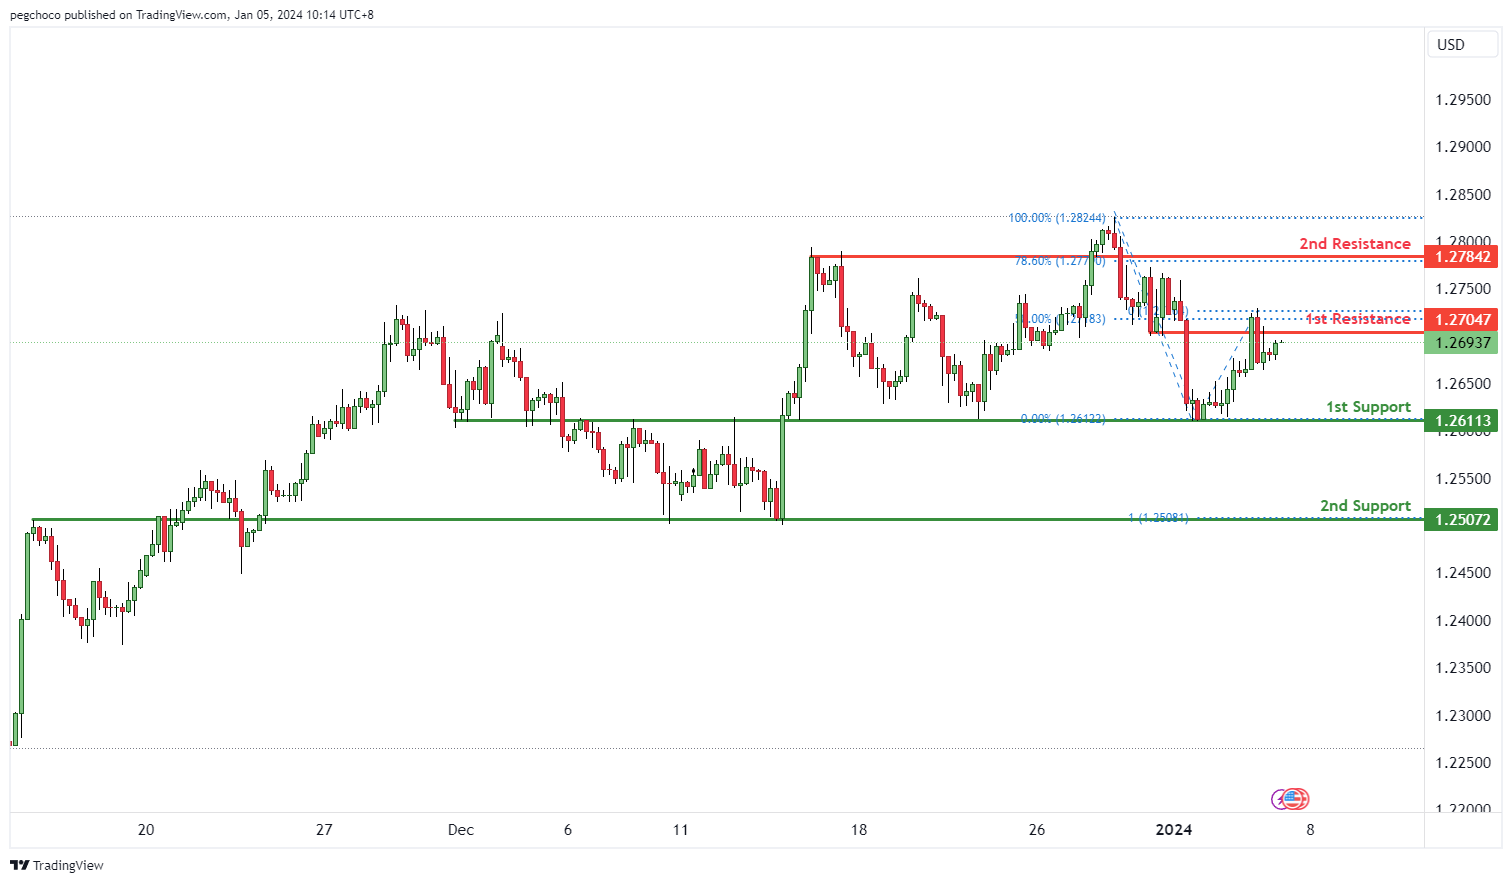
GBP/USD:
The GBP/USD chart currently has a bearish overall momentum, suggesting that the British Pound is weaker compared to the US Dollar.
Price could potentially make a bearish reaction off the 1st resistance level and drop towards the 1st support.
The 1st support at 1.2611 is categorized as an overlap support, indicating a significant area where buying interest may emerge, providing temporary support for the GBP/USD.
The 2nd support at 1.2507 is identified as an overlap support, further reinforcing its significance as a potential support zone. This level is also associated with the 100% Fibonacci Projection, adding to its importance.
On the resistance side, the 1st resistance at 1.2704 is categorized as an overlap resistance, and it is also associated with the 38.20% Fibonacci Retracement. This level may act as a substantial barrier where selling interest could intensify, potentially leading to a bearish reaction.
The 2nd resistance at 1.2814 is noted as a swing high resistance and is associated with the 78.60% Fibonacci Retracement. Swing highs often mark points of reversal or resistance in price movement, making this level a significant obstacle to further upward movement in the GBP/USD.
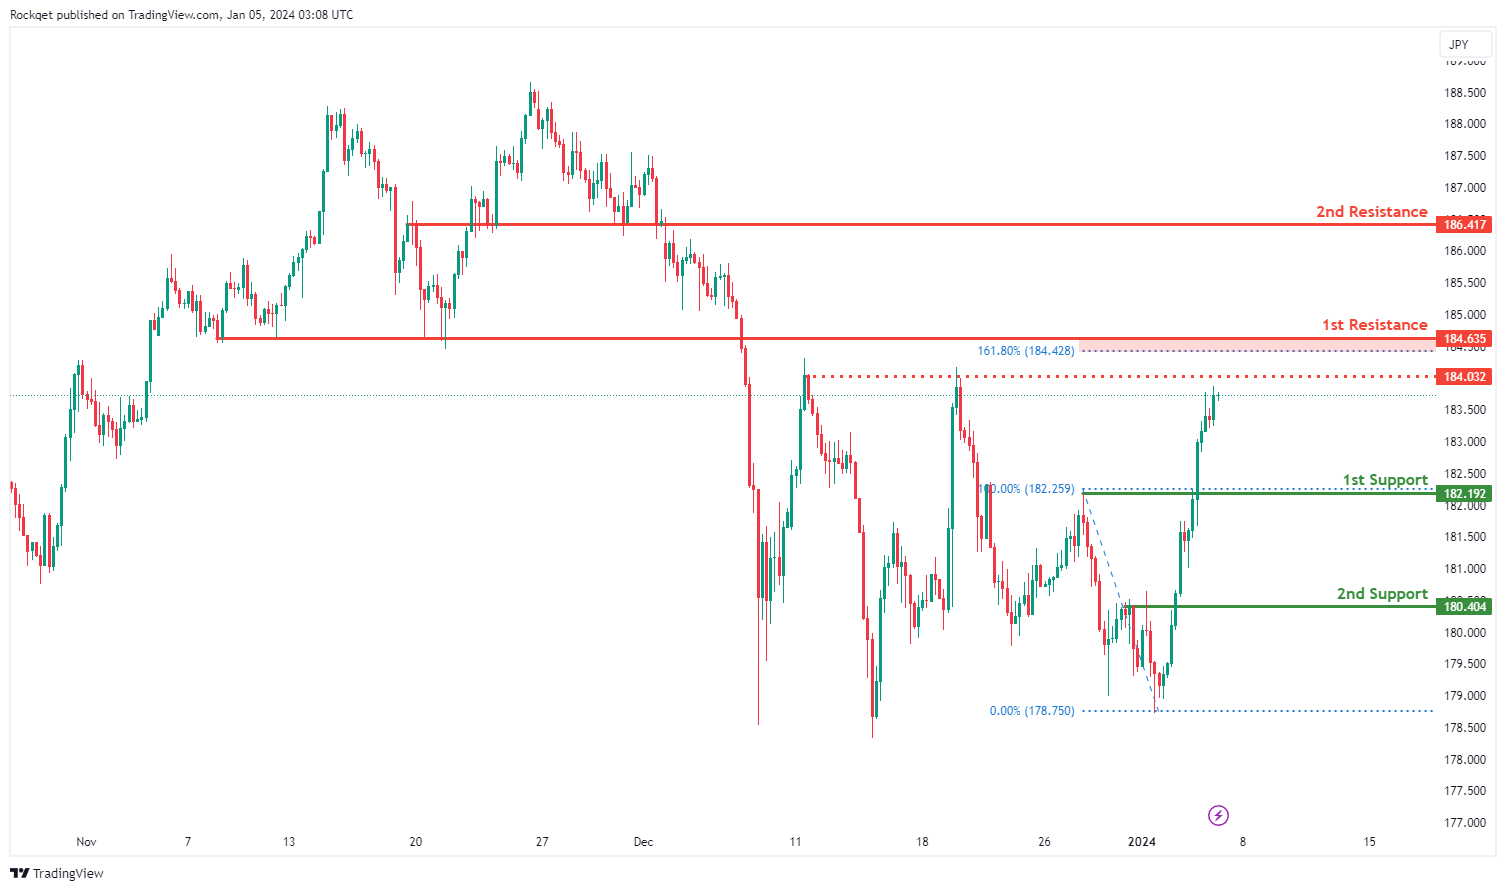
GBP/JPY:
The GBP/JPY chart currently demonstrates a bullish overall momentum, indicating a propensity for an upward trend. There is a potential scenario for a bullish continuation towards the 1st resistance.
The 1st support at 182.19 is considered favourable as it represents a pullback support level, suggesting historical significance as a point where buying interest has previously emerged.
The 2nd support at 180.40 is also identified as a pullback support, adding to the confluence of potential support levels.
On the resistance side, the 1st resistance at 184.64 is recognized as a pullback resistance and aligns with the 161.80% Fibonacci Extension, making it a notable level where selling interest could materialise.
The 2nd resistance at 186.42 is identified as an overlap resistance, providing an additional level where selling pressure might be encountered. The intermediate resistance at 184.03 is noted as a multi-swing high resistance, further emphasising its potential significance.
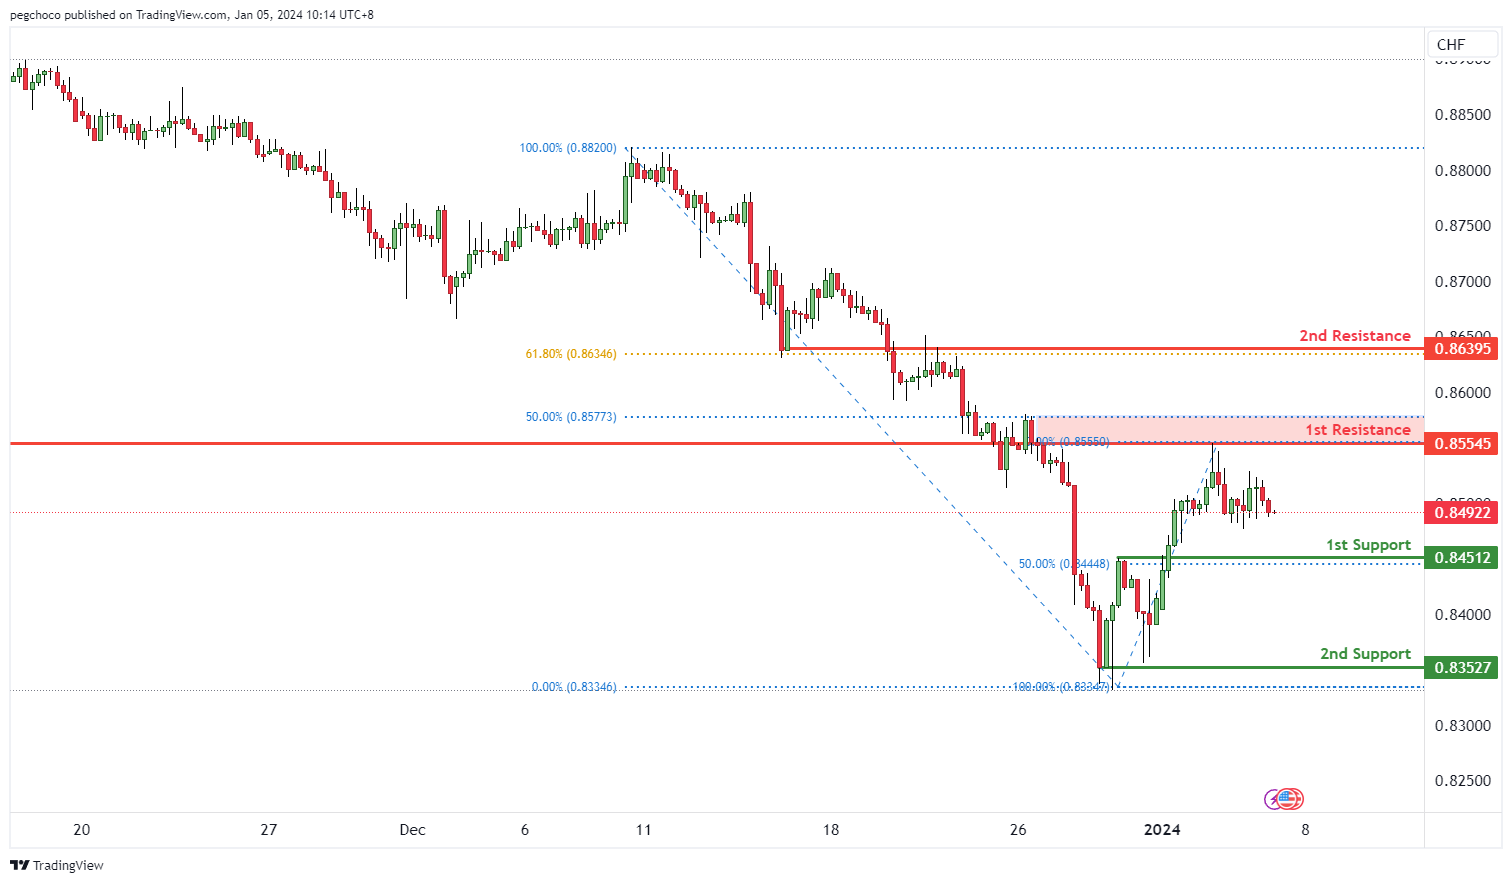
USD/CHF:
The USD/CHF chart currently has a bearish overall momentum, indicating that the US Dollar is weaker compared to the Swiss Franc.
Price could potentially continue its bearish movement towards the 1st support level.
The 1st support at 0.8451 is categorized as a pullback support, which suggests that it may serve as a significant area where buying interest could emerge, temporarily halting the bearish momentum of USD/CHF.
The 2nd support at 0.8352 is identified as a multi-swing low support, further reinforcing its importance as a potential support zone for the currency pair.
On the resistance side, the 1st resistance at 0.8554 is categorized as an overlap resistance and is also associated with the 50% Fibonacci Retracement level. This level may act as a substantial barrier where selling interest could intensify, potentially leading to a bearish continuation.
The 2nd resistance at 0.8639 is noted as an overlap resistance and is associated with the 61.80% Fibonacci Retracement. This level could also serve as a strong resistance point, further hindering any bullish attempts in USD/CHF.
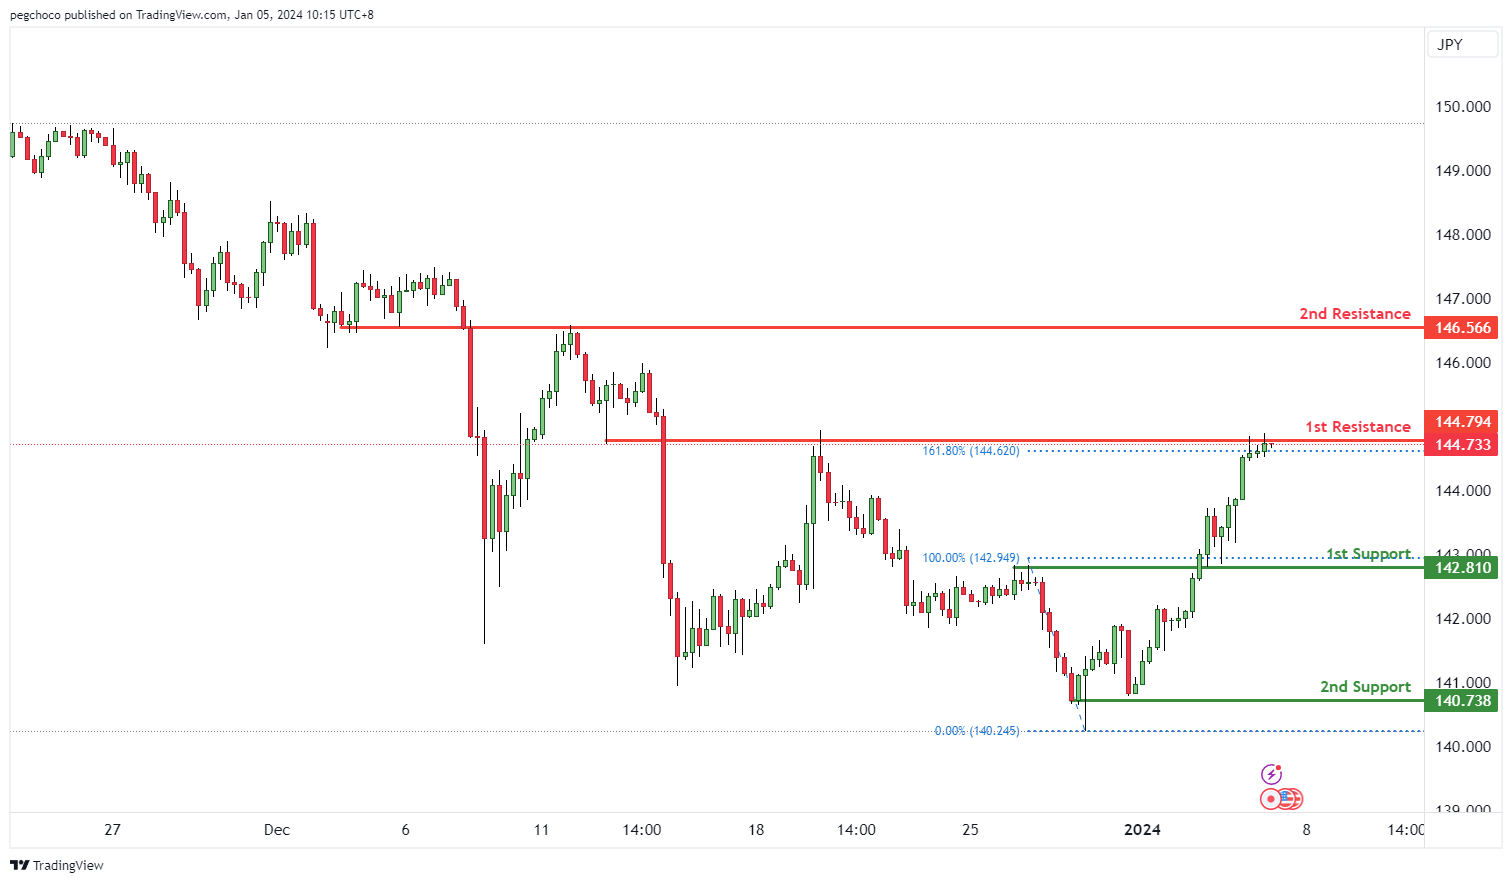
USD/JPY:
The USD/JPY chart currently exhibits a bearish overall momentum, indicating that the US Dollar is weaker compared to the Japanese Yen. In the short term, there’s potential for a bearish reaction off the 1st resistance level, followed by a drop towards the 1st support.
The 1st support at 142.81 is categorized as an overlap support. This level is significant as it suggests a potential area where buying interest may emerge, providing temporary support for USD/JPY.
The 2nd support at 140.73 is identified as a swing low support, further reinforcing its significance as a potential support zone for the currency pair.
On the resistance side, the 1st resistance at 144.79 is categorized as an overlap resistance and is also associated with the 161.80% Fibonacci Extension level. This level may act as a substantial barrier where selling interest could intensify, potentially leading to a bearish reversal.
The 2nd resistance at 146.56 is noted as an overlap resistance, further indicating a strong potential for resistance in this area.
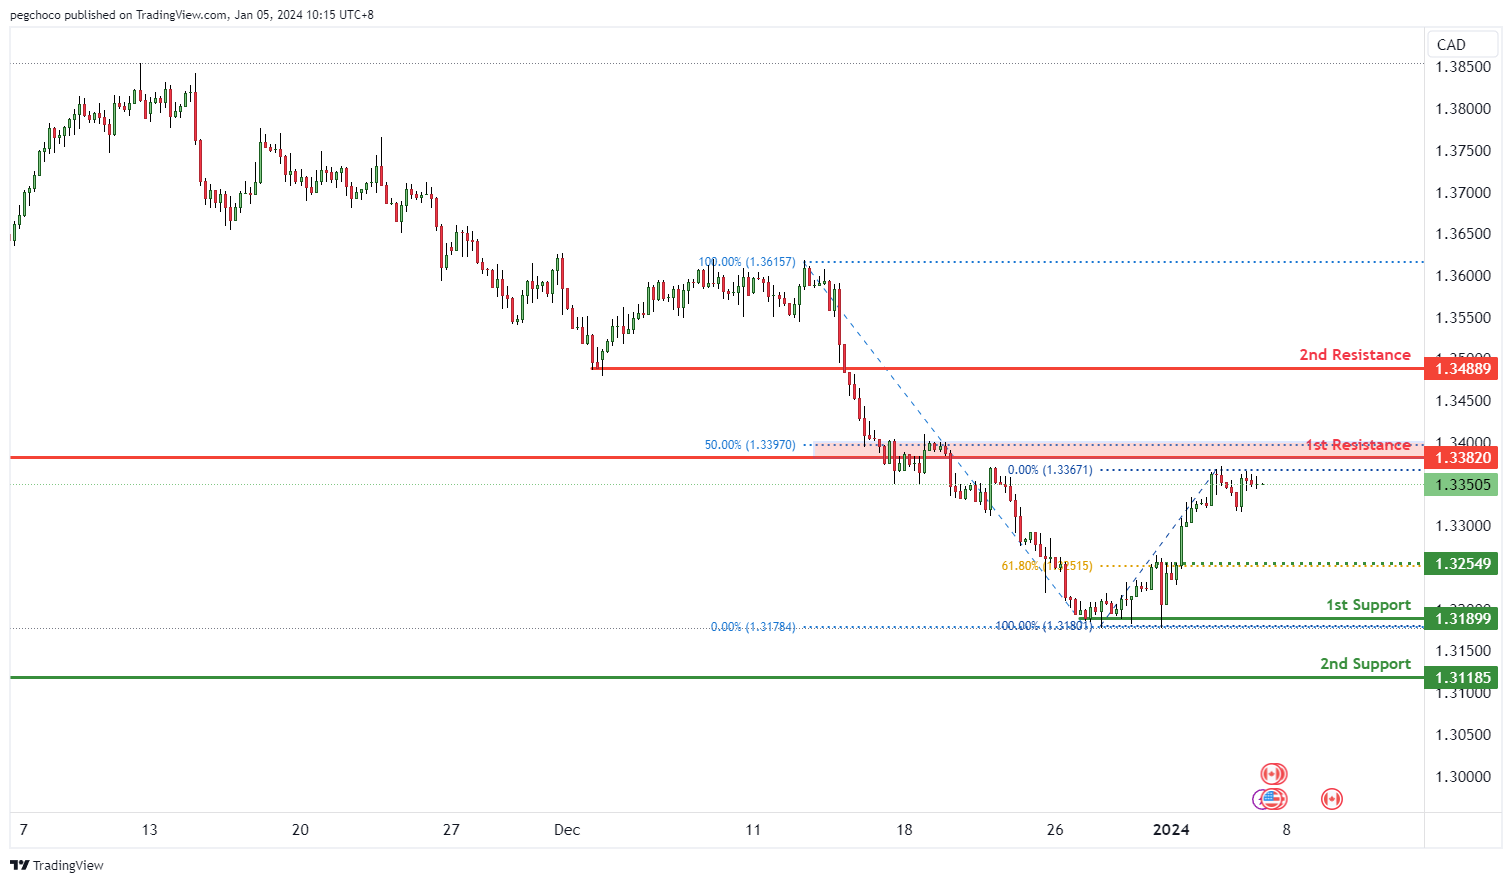
USD/CAD:
The USD/CAD chart currently has a bearish overall momentum, indicating potential weakness in the US Dollar compared to the Canadian Dollar. In the short term, there’s the possibility of a bearish continuation towards the 1st support level.
The 1st support at 1.3189 is identified as a multi-swing low support. This level holds significance as it suggests a potential area where buying interest may emerge, providing support for the USD/CAD pair.
The 2nd support at 1.3118 is categorized as a swing low support. Swing lows often represent areas where buyers have previously entered the market, adding to the significance of this level as a potential support zone.
On the resistance side, the 1st resistance at 1.3382 is categorized as an overlap resistance. This level may act as a substantial barrier where selling interest could intensify, potentially causing a bearish reversal or a temporary halt in the downtrend.
The 2nd resistance at 1.3488 is noted as a pullback resistance. This level signifies a point where sellers may re-enter the market after a pullback, further reinforcing its significance as a potential resistance zone.
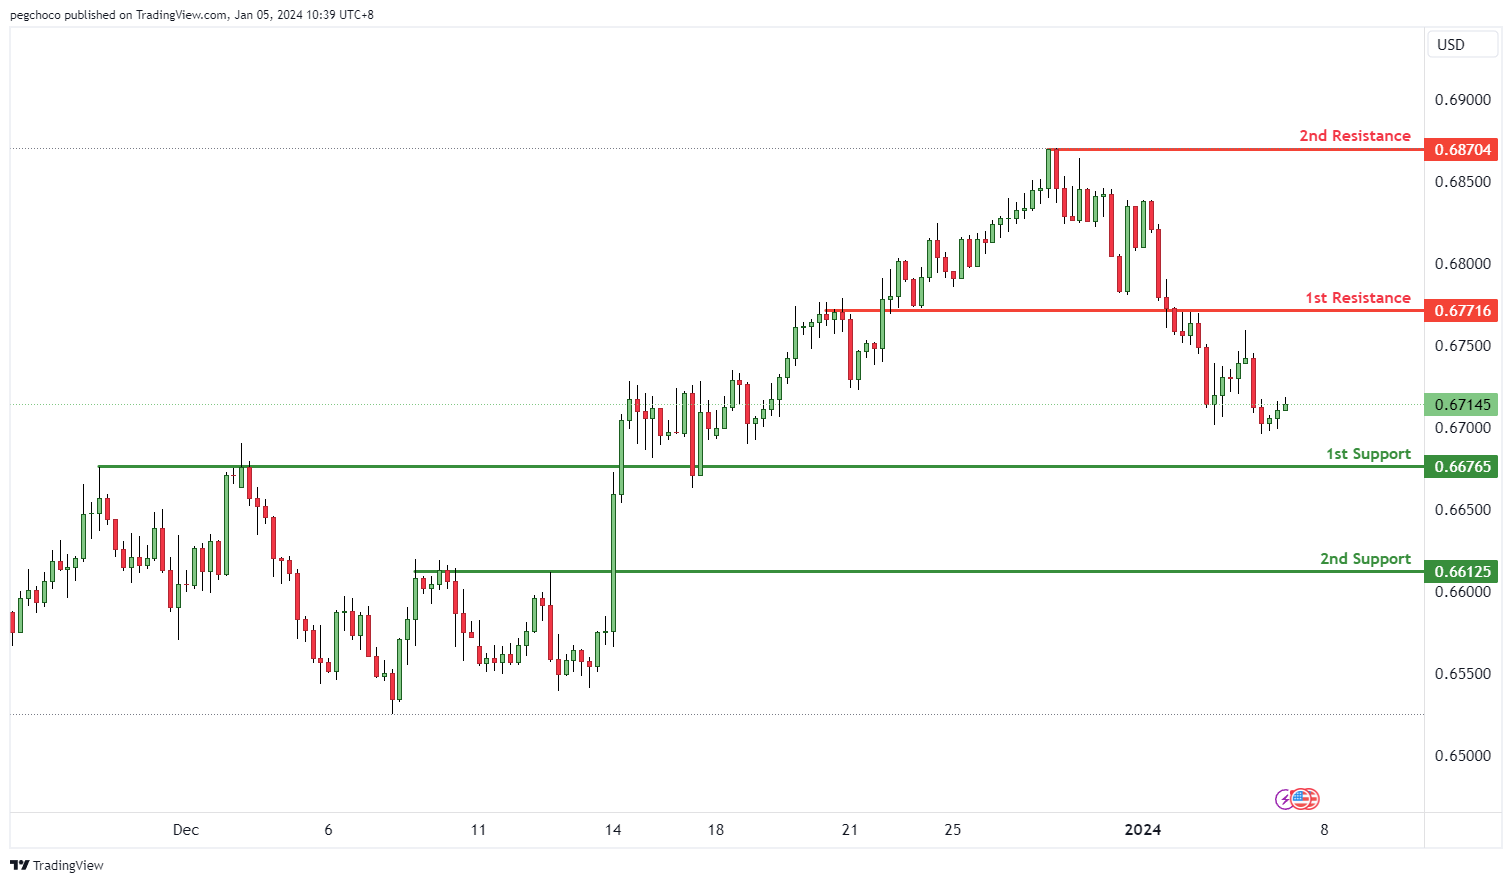
AUD/USD:
The AUD/USD chart currently exhibits a bullish overall momentum, suggesting potential strength in the Australian Dollar against the US Dollar. In the short term, there’s the potential for a bullish bounce off the 1st support level, followed by a move towards the 1st resistance.
The 1st support at 0.6676 is identified as an overlap support. This level holds significance as it suggests a potential area where buying interest may emerge, providing support for the AUD/USD pair.
The 2nd support at 0.6612 is categorized as a pullback support. It signifies a level where buyers may re-enter the market after a pullback, further reinforcing its significance as a potential support zone.
On the resistance side, the 1st resistance at 0.6771 is categorized as an overlap resistance. This level may act as a significant barrier where selling interest could intensify, potentially causing a temporary halt or reversal in the bullish movement.
The 2nd resistance at 0.6870 is noted as a swing high resistance. Swing highs often mark points of reversal or resistance in price movement.
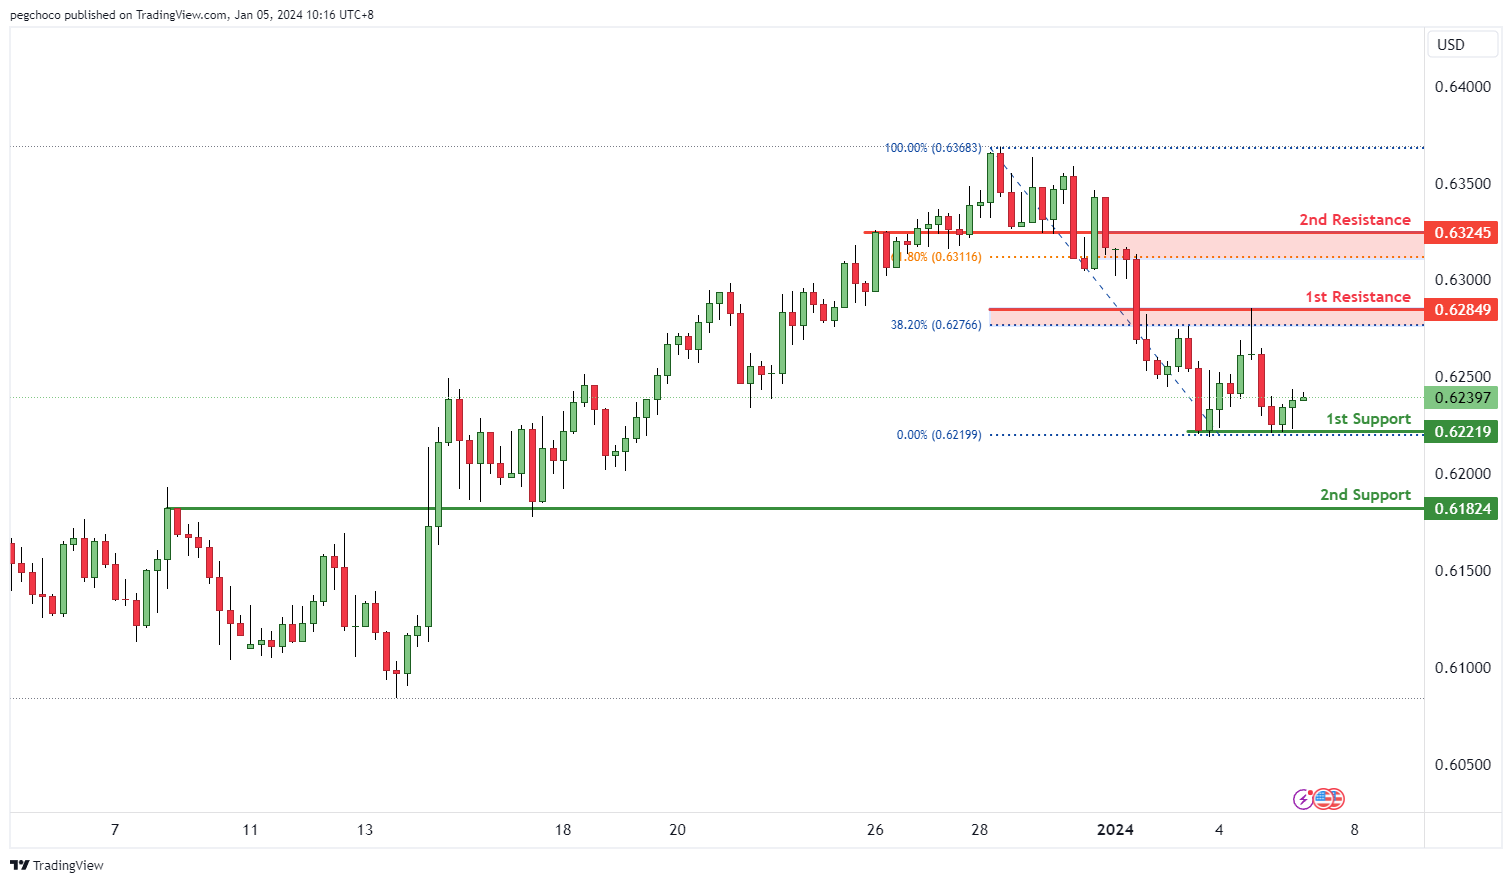
NZD/USD
The NZD/USD chart currently exhibits a bullish overall momentum, indicating a potential strength in the New Zealand Dollar against the US Dollar. In the short term, there’s the potential for a bullish bounce off the 1st support level, followed by a move towards the 1st resistance.
The 1st support at 0.6221 is identified as a multi-swing low support. This level holds significance as it suggests a potential area where buying interest may emerge, providing support for the NZD/USD pair.
The 2nd support at 0.6182 is categorized as an overlap support. While the reason for its significance is not provided, it still represents a potential support zone.
On the resistance side, the 1st resistance at 0.6284 is categorized as an overlap resistance. This level may act as a significant barrier where selling interest could intensify, potentially causing a temporary halt or reversal in the bullish movement.
The 2nd resistance at 0.6324 is also noted as an overlap resistance. This level represents another potential barrier where selling pressure may increase.
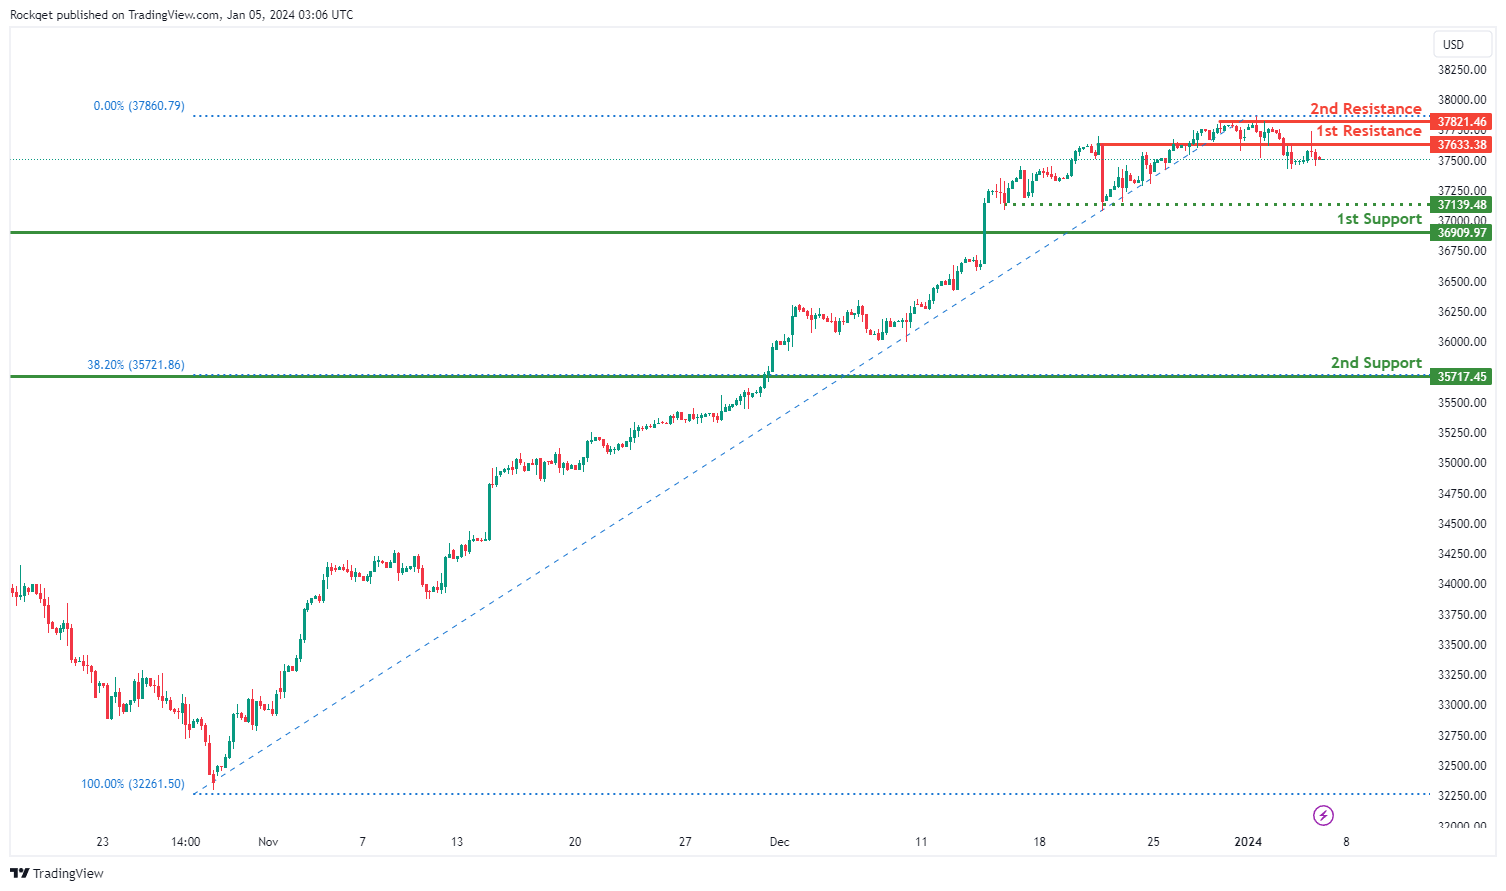
DJ30:
The DJ30 chart currently exhibits a weak bearish overall momentum, suggesting a potential for a downward trend, albeit with low confidence. There is a possibility of a bearish continuation towards the 1st support.
The 1st support at 36909.97 is considered advantageous as it signifies a pullback support level, indicating a historical significance where buying interest has previously emerged.
The 2nd support at 35717.45 is recognized as a pullback support and coincides with the 38.20% Fibonacci Retracement, adding confluence to its potential as a support level.
The intermediate support at 37139.48 is acknowledged as a swing low support, providing an additional level of potential support.
On the resistance side, the 1st resistance at 37633.38 is identified as an overlap resistance, suggesting a historical level where selling interest may materialise.
The 2nd resistance at 37821.46 is noted as a swing high resistance, representing a potential barrier for further upward movement.
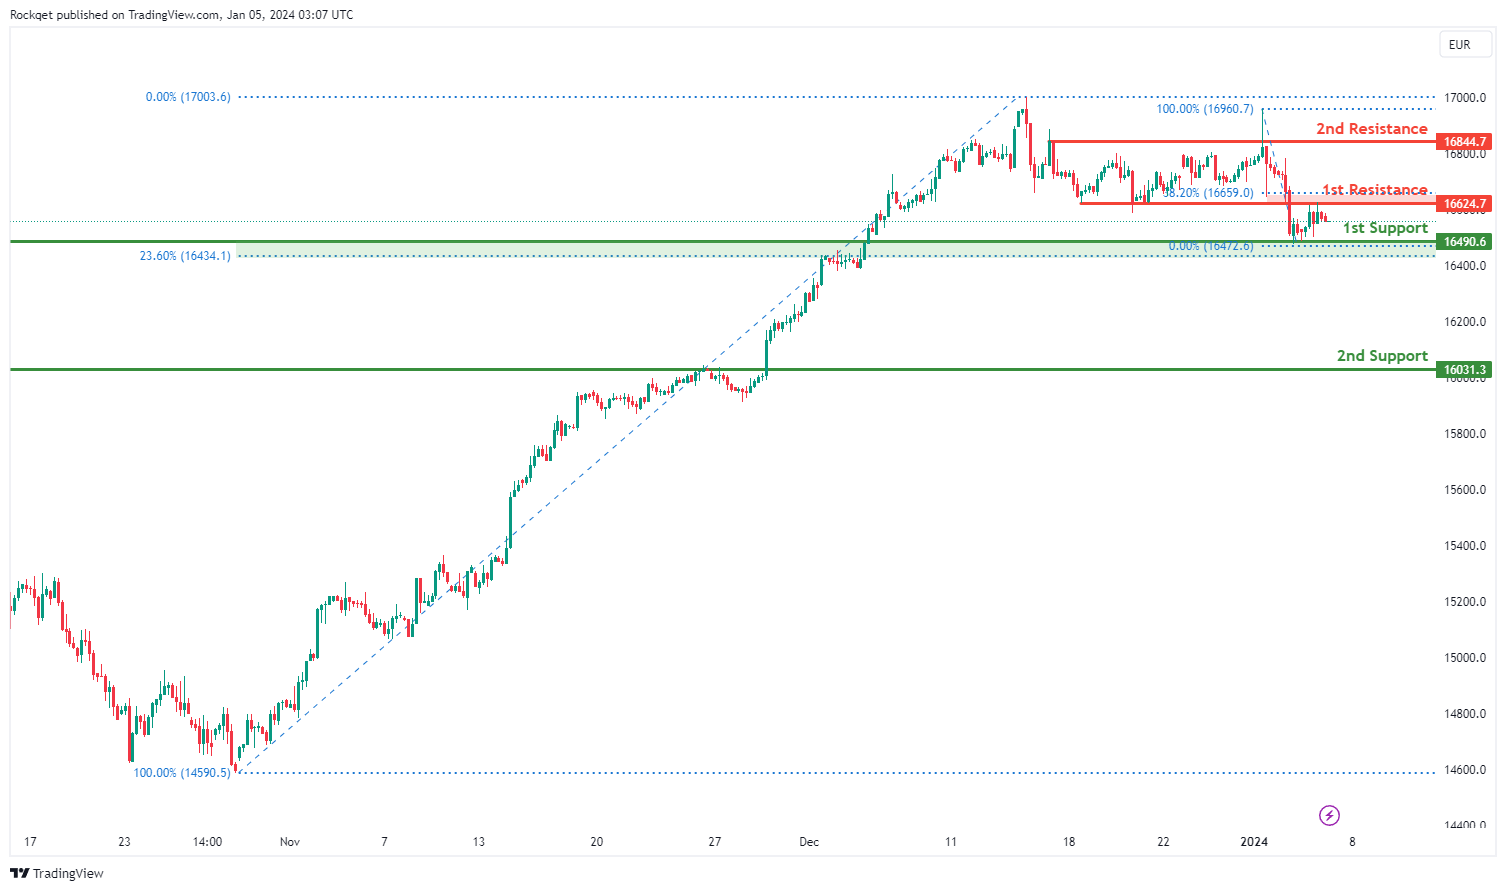
GER40:
The GER40 chart currently indicates a neutral overall momentum, suggesting a lack of a clear trend direction. Several factors contribute to this neutral momentum, and there is a potential scenario for price to fluctuate between the 1st resistance and 1st support levels.
The 1st support at 16490.60 is deemed favourable due to its identification as an overlap support, indicating historical significance as a level where buying interest has previously emerged. Additionally, it coincides with the 23.60% Fibonacci Retracement, adding confluence to its potential as a support level.
The 2nd support at 16031.30 is recognized as a pullback support, further supporting the idea of potential buying interest.
On the resistance side, the 1st resistance at 16624.70 is identified as pullback resistance and aligns with the 38.20% Fibonacci Retracement, suggesting a historical level where selling interest may emerge.
The 2nd resistance at 16844.70 is noted as a swing high resistance, representing a potential barrier for further upward movement.
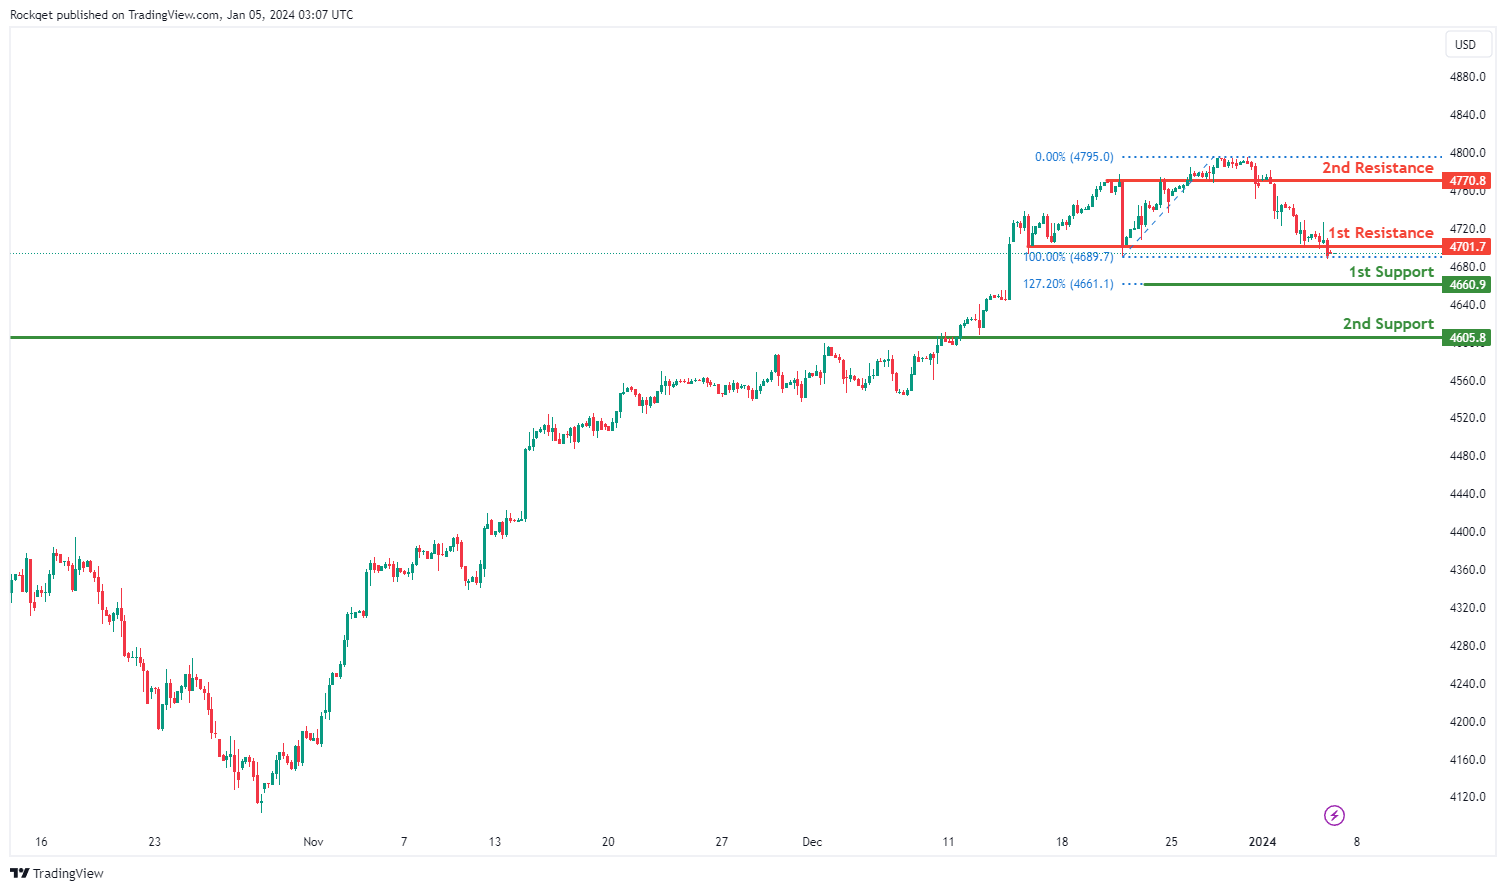
US500:
The US500 chart currently exhibits a bearish overall momentum, indicating a downward trend. Several factors contribute to this bearish momentum, and there is a potential scenario for a bearish reaction off the 1st resistance, leading to a drop to the 1st support.
The 1st support at 4660.9 is considered favourable due to its identification as an area where buying interest may emerge. This level coincides with the 127.20% Fibonacci Extension, adding confluence to its potential as a support level.
The 2nd support at 4605.8 is recognized as an overlap support, suggesting historical significance as a level where buyers have previously stepped in.
On the resistance side, the 1st resistance at 4701.7 is identified as pullback resistance, representing a potential level where selling interest may materialise.
The 2nd resistance at 4770.8 is noted as an overlap resistance, further adding significance to this potential barrier for upward movement.
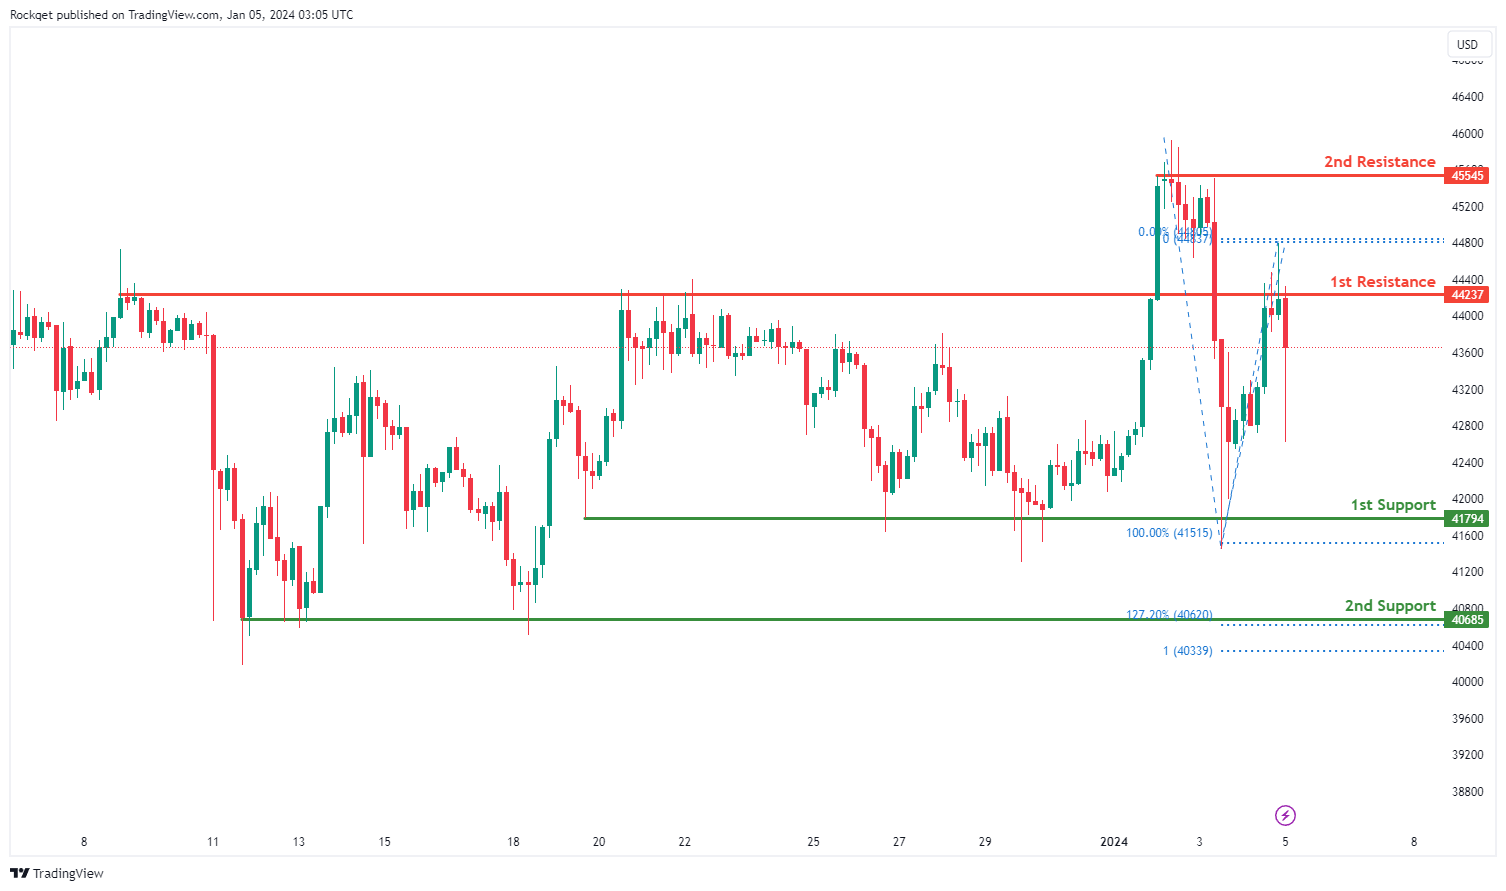
BTC/USD:
The BTC/USD chart currently indicates a bearish overall momentum, signalling a downward trend. There is a potential scenario for a bearish reaction off the 1st resistance, leading to a drop to the 1st support.
The 1st support at 41794 is considered favourable due to its identification as a multi-swing low support, suggesting historical significance as a level where buying interest has previously emerged.
The 2nd support at 40685 adds confluence to its potential as a support level, being both a multi-swing low support and coinciding with the 127.20% Fibonacci Retracement.
On the resistance side, the 1st resistance at 44237 is identified as an overlap resistance, representing a potential level where selling interest may materialise.
The 2nd resistance at 45545 is noted as a swing high resistance, further adding significance to this potential barrier for upward movement.
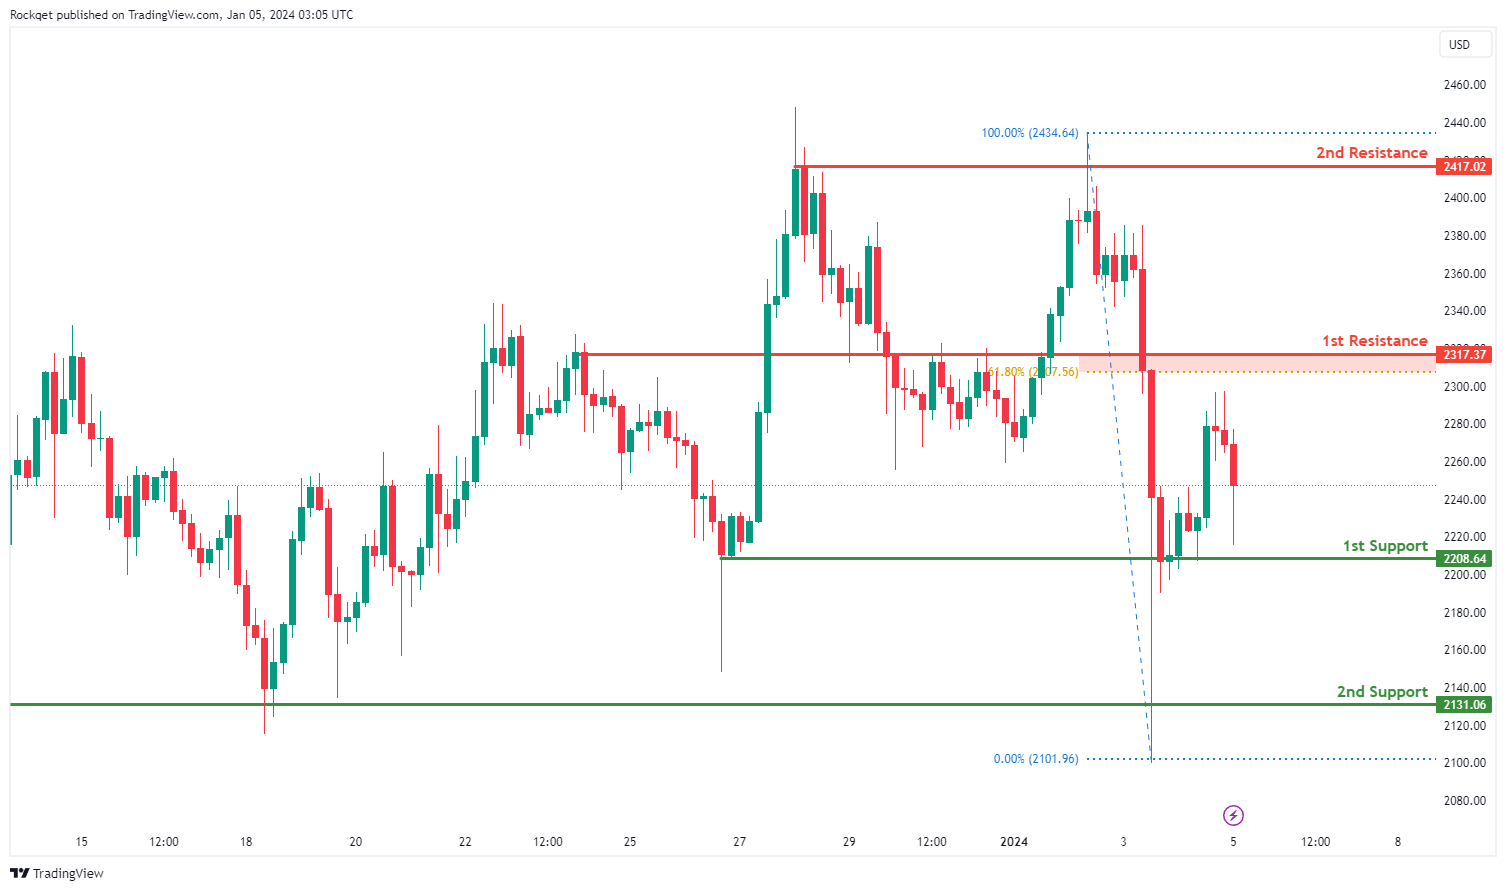
ETH/USD:
The ETH/USD chart currently reflects a bearish overall momentum, indicating a downward trend. There is a potential scenario for a bearish reaction off the 1st resistance, leading to a drop to the 1st support.
The 1st support at 2208.64 is considered favourable due to its identification as a multi-swing low support, suggesting historical significance as a level where buying interest has previously emerged.
The 2nd support at 2131.06 adds confluence to its potential as a support level, being another multi-swing low support.
On the resistance side, the 1st resistance at 2317.37 is identified as an overlap resistance and coincides with the 61.80% Fibonacci Retracement, representing a potential level where selling interest may materialise.
The 2nd resistance at 2417.02 is noted as a multi-swing high resistance, further adding significance to this potential barrier for upward movement.
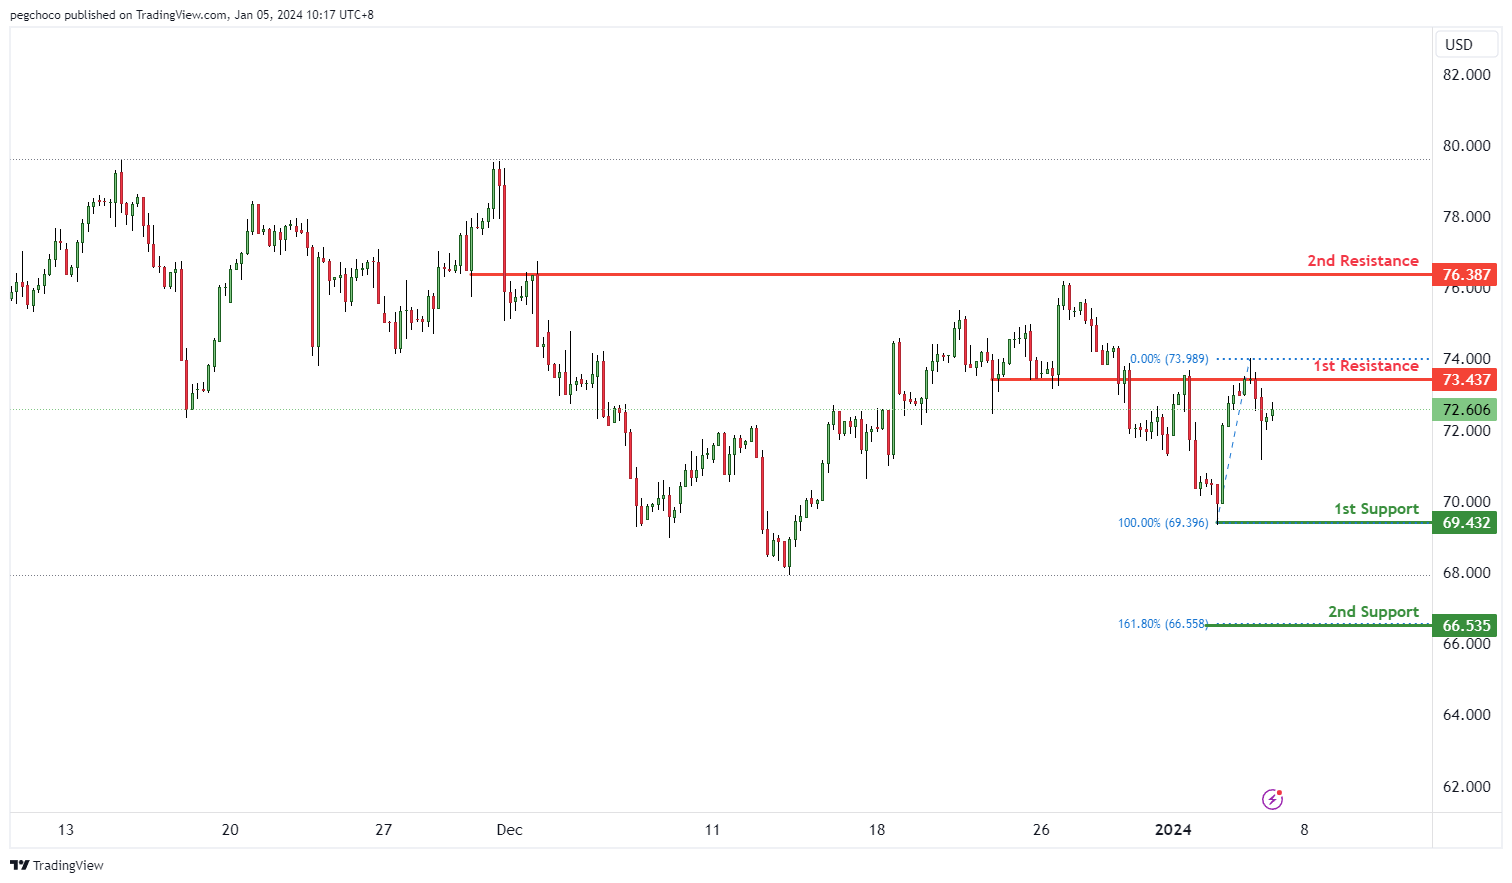
WTI/USD:
The WTI (West Texas Intermediate) chart currently has a bearish overall momentum, indicating a downward trend in the price of oil. In the short term, there’s potential for a bearish reaction off the 1st resistance level, followed by a drop towards the 1st support.
The 1st support at 69.43 is categorized as a swing low support. This level is significant as it suggests a potential area where buying interest may emerge, providing temporary support for the WTI price.
The 2nd support at 66.53 is also mentioned as a potential support level, although the reason for its significance is not provided.
On the resistance side, the 1st resistance at 73.43 is categorized as an overlap resistance. This level may act as a substantial barrier where selling interest could intensify, potentially leading to a bearish reversal.
The 2nd resistance at 76.38 is noted as an overlap resistance. This level also represents a potential barrier where selling pressure may increase.
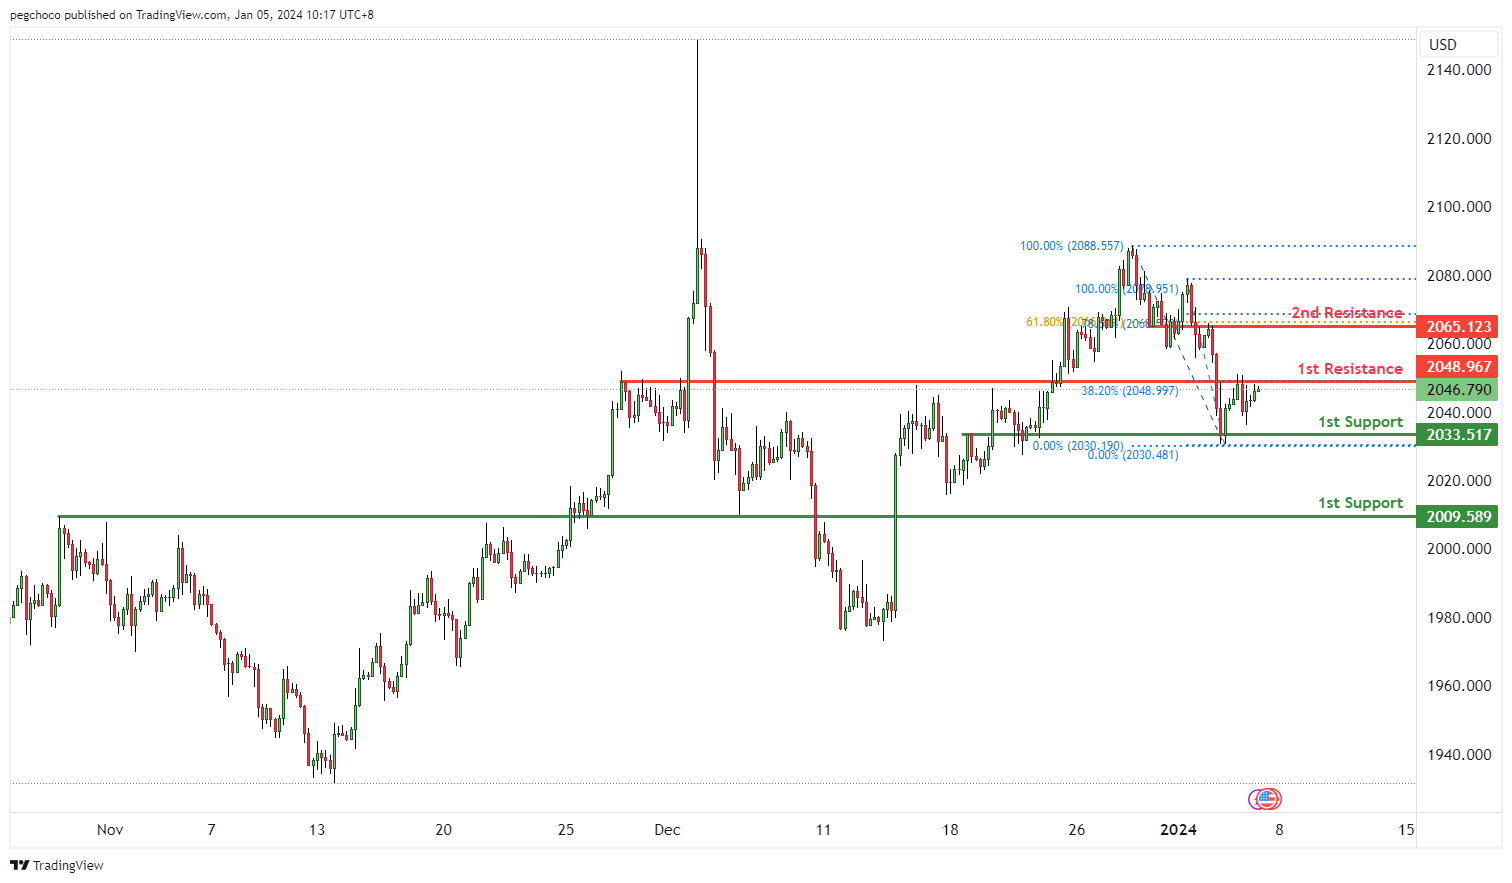
XAU/USD (GOLD):
The XAU/USD chart is currently exhibiting a bearish overall momentum, indicating that the price of gold (XAU) is weaker compared to the US Dollar (USD). In the short term, there’s potential for a bearish reaction off the 1st resistance level, followed by a drop towards the 1st support.
The 1st support at 2033.51 is categorized as an overlap support. This level is significant as it suggests a potential area where buying interest may emerge, providing temporary support for the XAU/USD pair.
The 2nd support at 2009.58 is also identified as an overlap support, further reinforcing its significance as a potential support zone.
On the resistance side, the 1st resistance at 2048.96 is categorized as an overlap resistance and is associated with the 38.20% Fibonacci Retracement level. This level may act as a substantial barrier where selling interest could intensify, potentially leading to a bearish reversal.
The 2nd resistance at 2065.12 is noted as an overlap resistance and is associated with both the 61.80% and 78.60% Fibonacci Retracement levels, indicating Fibonacci confluence. This reinforces the significance of this resistance level, making it a critical zone for potential reversals or strong selling pressure.


