
DXY:
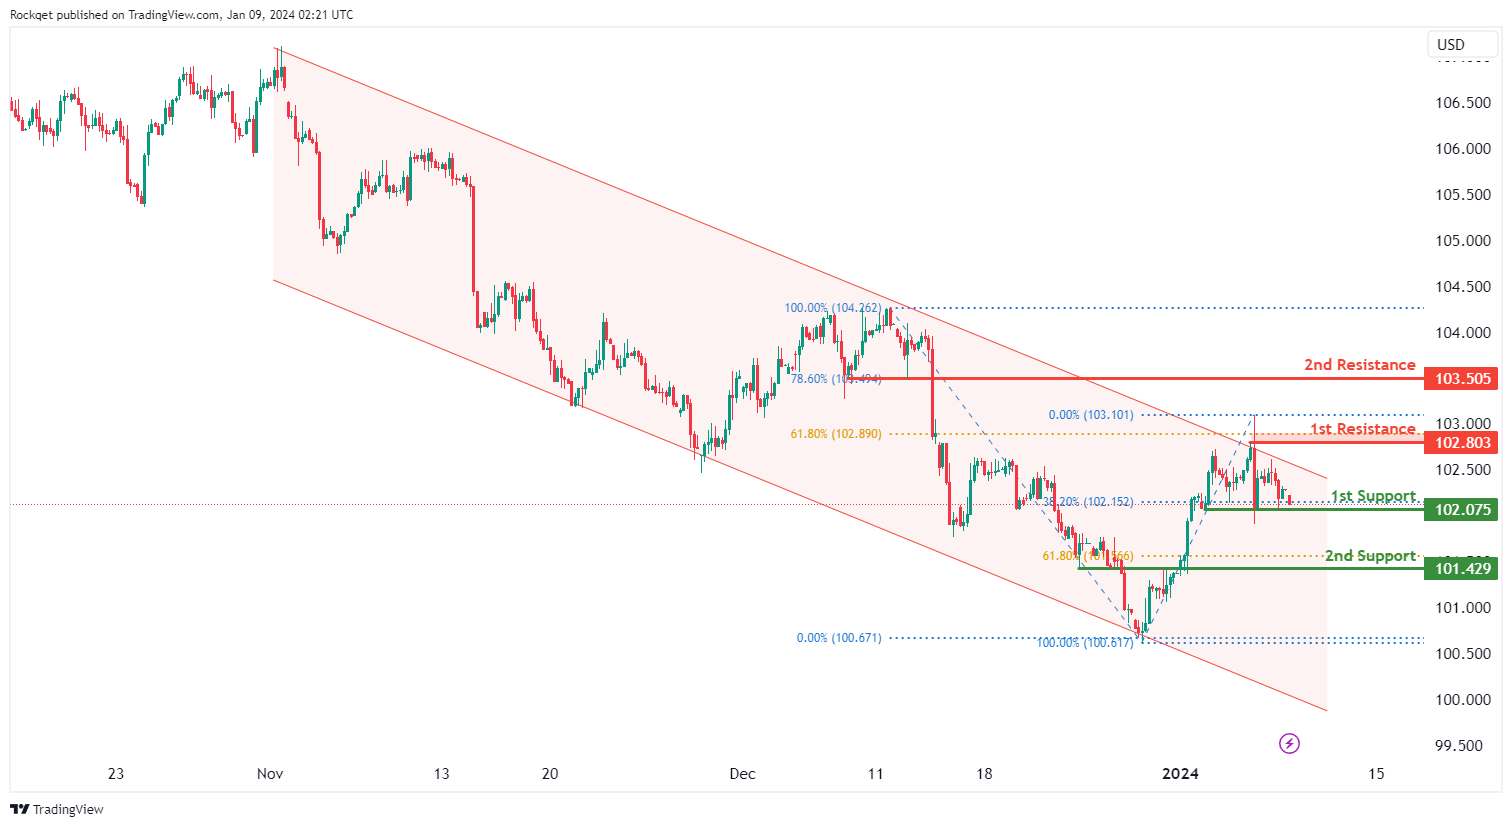
The DXY (US Dollar Index) chart currently displays an overall bearish momentum which is highlighted by the bearish channel. In this context, there is a potential scenario for price to make a bearish continuation towards the 1st support.
The 1st support level at 102.07 is identified as a pullback support that aligns with the 38.20% Fibonacci retracement level. Further below, the 2nd support level at 101.42 is also marked as a pullback support that aligns close to the 61.80% Fibonacci retracement level, further reinforcing its importance as a key support level.
On the resistance side, the 1st resistance level at 102.80 is identified as a pullback resistance that aligns close to the 61.80% Fibonacci retracement level. Higher up, the 2nd resistance level at 103.50 is also noted as a pullback resistance that aligns with the 78.60% Fibonacci retracement level, further reinforcing its significance as a potential resistance zone.
EUR/USD:
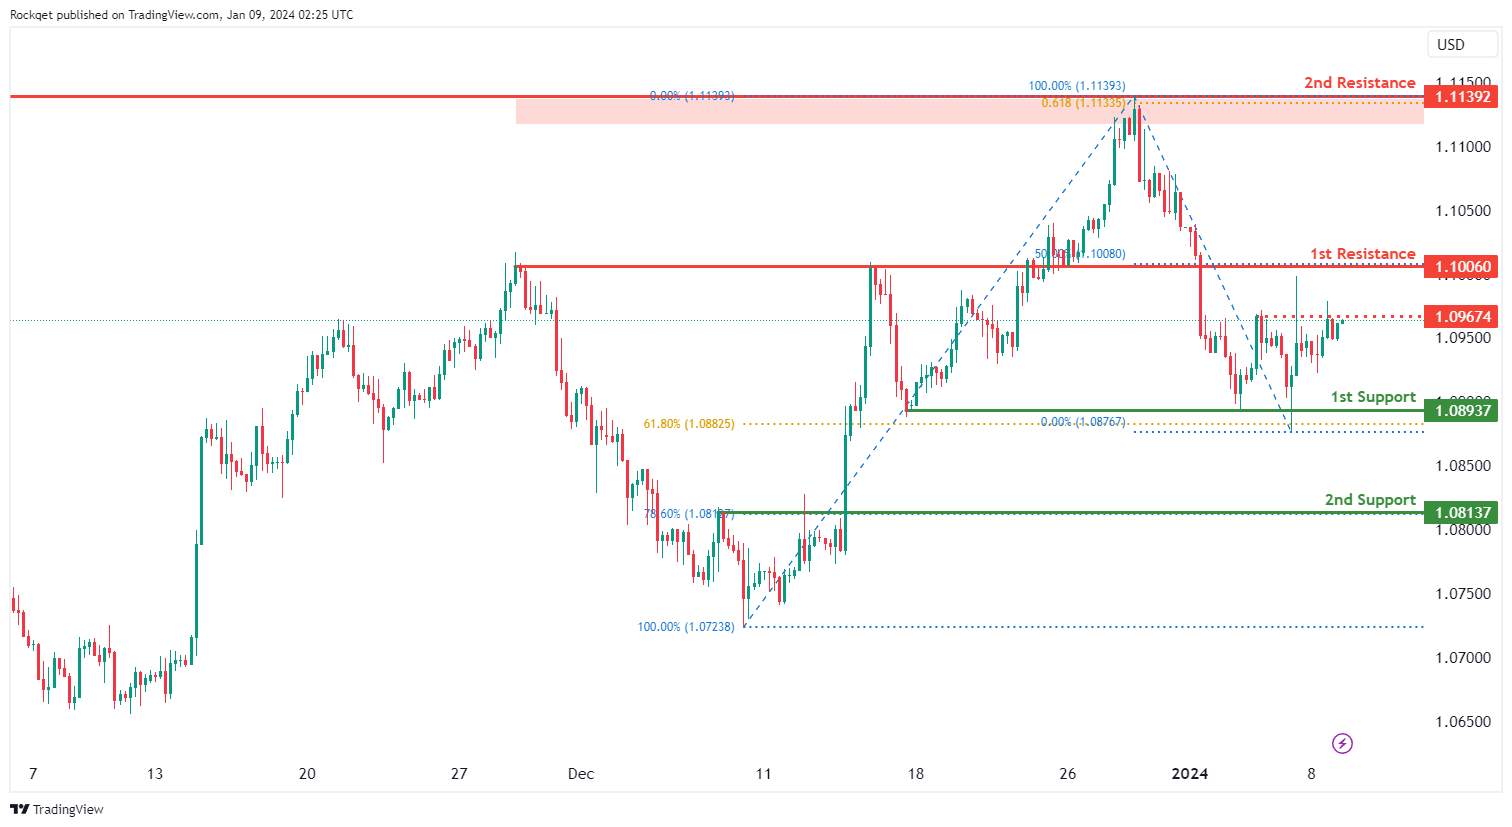
The EUR/USD chart currently demonstrates an overall bullish momentum. In this context, there is a potential scenario for price to make a bullish continuation towards the 1st resistance should it break above the intermediate resistance.
The intermediate resistance level at 1.0967 is identified as a pullback resistance while the 1st resistance level at 1.1006 is noted as an overlap resistance that aligns with the 50.00% Fibonacci retracement level. Higher up, the 2nd resistance level at 1.1139 is marked as a multi-swing-high resistance that aligns with the 61.80% Fibonacci projection level, further reinforcing its significance as a potential resistance zone.
To the downside, the 1st support level at 1.0893 is identified as a pullback support that aligns close to the 61.80% Fibonacci retracement level. Further below, the 2nd support level at 1.0813 is also noted as a pullback support that aligns with the 78.60% Fibonacci retracement level, further reinforcing its importance as a key support level.
EUR/JPY:
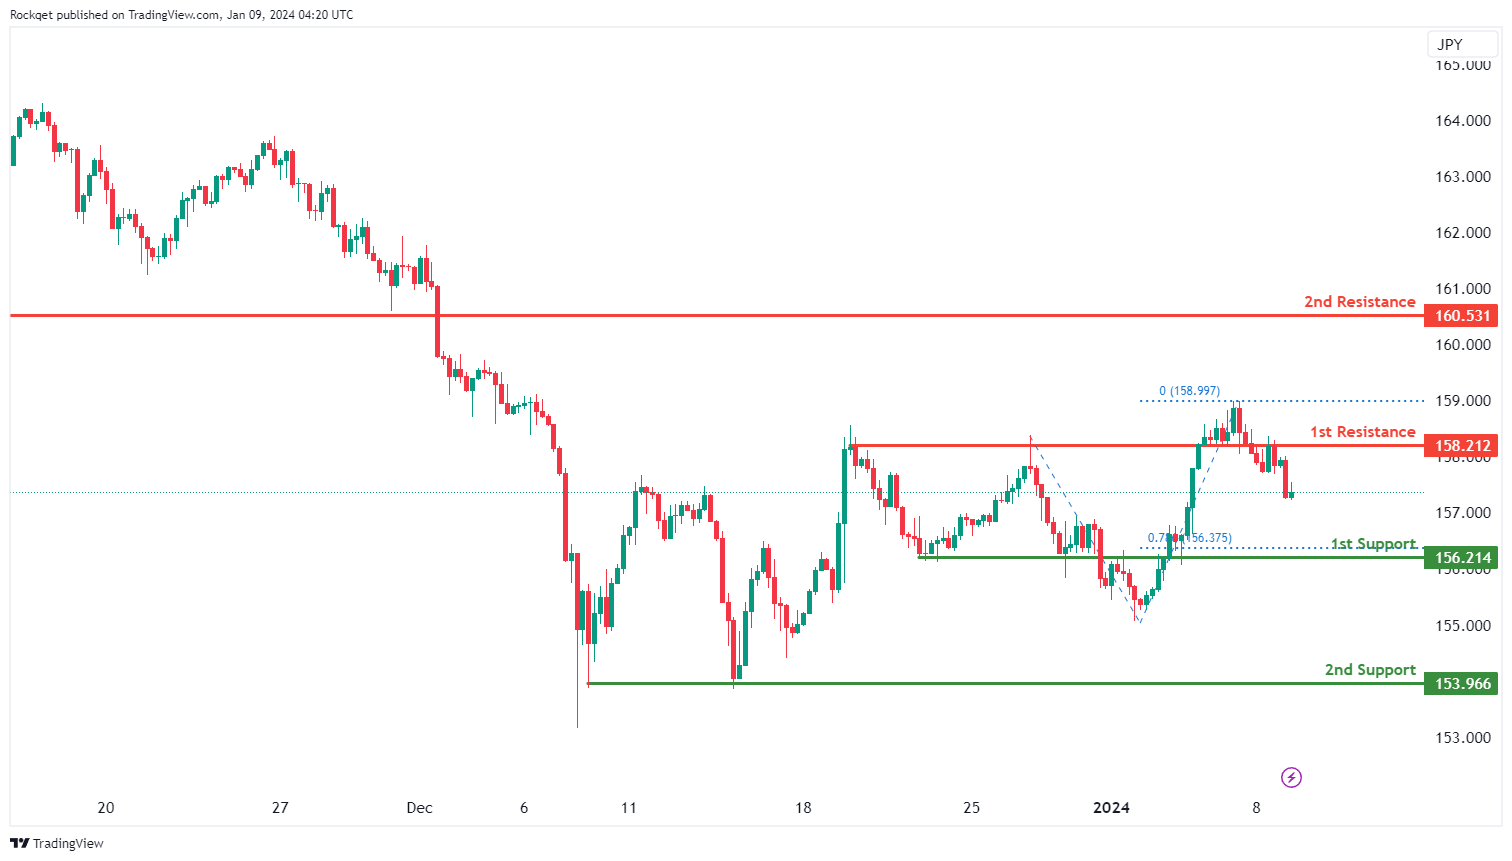
The EUR/JPY chart currently displays a bearish overall momentum, indicating a downward trend. There is a potential scenario for a bearish reaction off the 1st resistance, leading to a drop towards the 1st support.
The 1st support at 156.21 is considered favorable due to its identification as an overlap support, suggesting historical significance as a level where buying interest has previously emerged. Additionally, the 78.60% Fibonacci Projection adds confluence to the potential support at this level. The 2nd support at 153.97 is noted as a multi-swing low support, further strengthening its potential as a support level.
On the resistance side, the 1st resistance at 158.21 is identified as an overlap resistance. This level may act as a barrier where historical selling interest and potential price reversal could occur. The 2nd resistance at 160.53 is also noted as an overlap resistance, adding significance to this potential resistance level.
EUR/GBP:
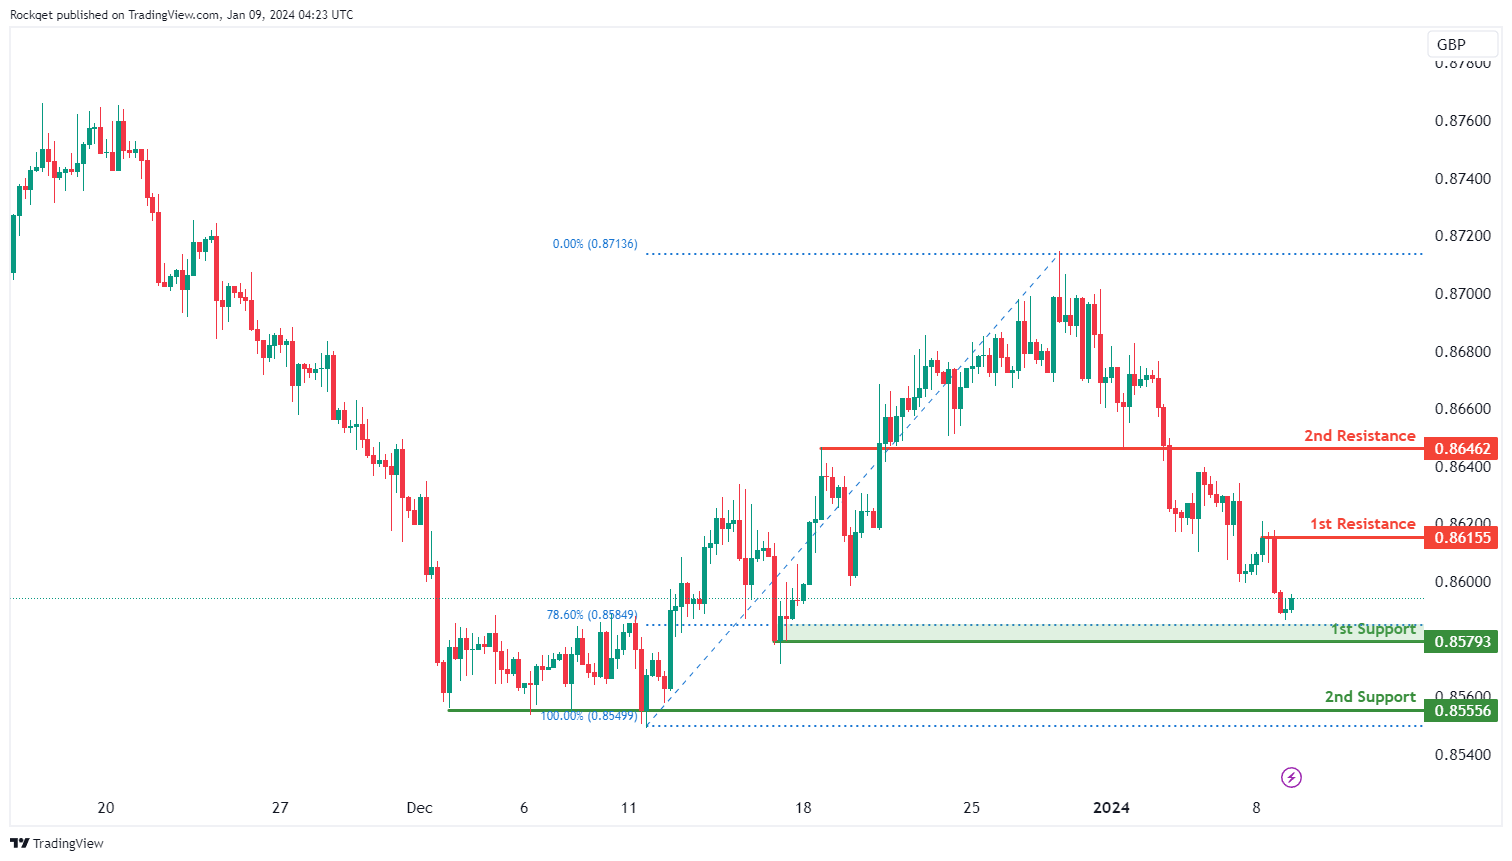
The EUR/GBP chart currently exhibits a bullish overall momentum, indicating an upward trend. There is a potential scenario for a bullish continuation towards the 1st resistance.
The 1st support at 0.8579 is considered favorable due to its identification as a pullback support, suggesting a level where buying interest might emerge during a price retracement. Additionally, the 78.60% Fibonacci Retracement provides added confluence to the potential support at this level.
The 2nd support at 0.8556 is noted as a multi-swing low support, further strengthening its potential as a support level.
On the resistance side, the 1st resistance at 0.8616 is identified as a pullback resistance. This level may act as a barrier where historical selling interest and potential price reversal could occur.
The 2nd resistance at 0.8646 is also noted as an overlap resistance, adding significance to this potential resistance level.
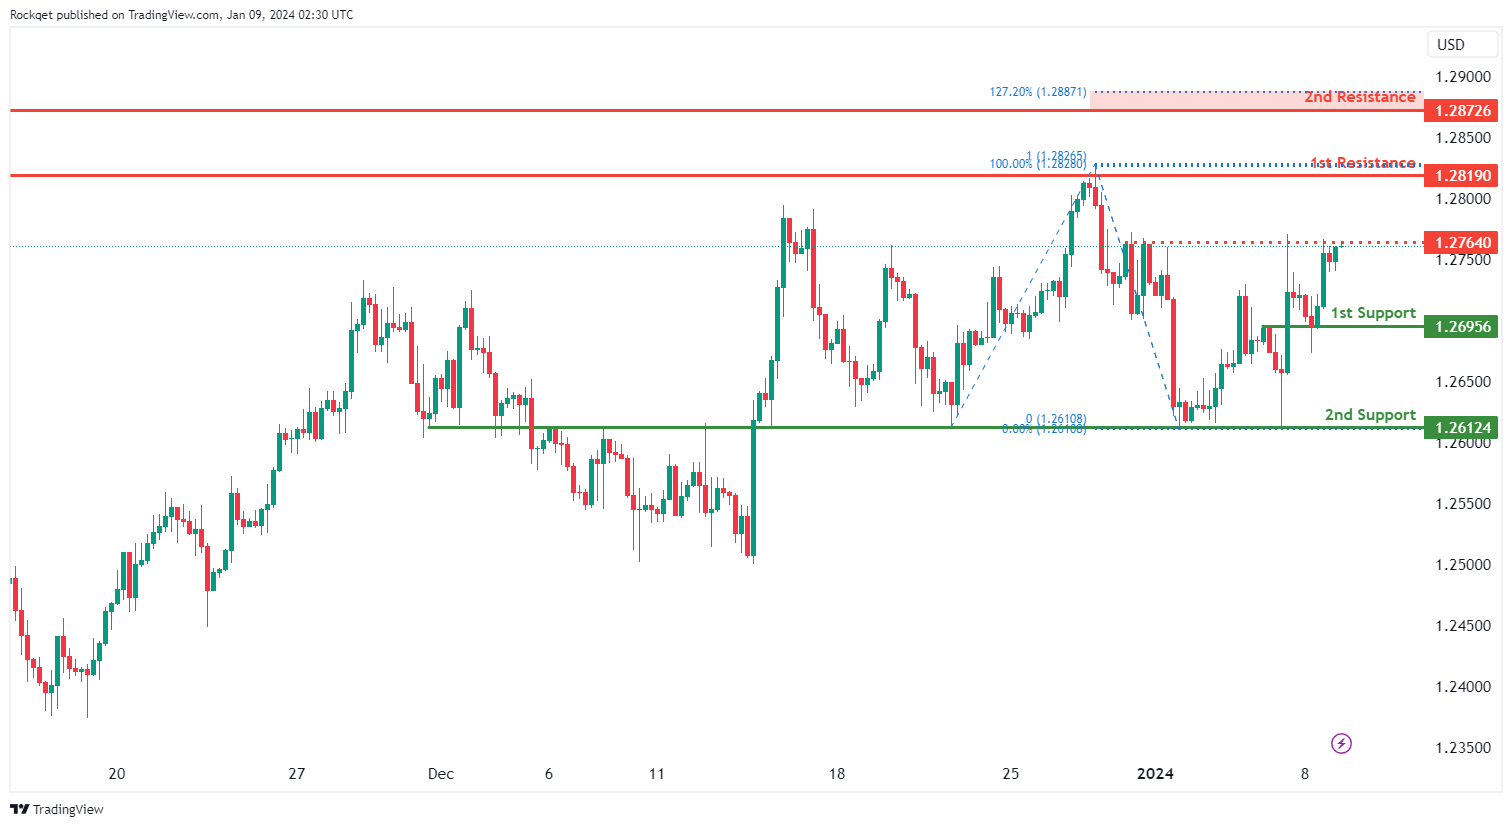
GBP/USD:
The GBP/USD chart currently demonstrates an overall bullish momentum. In this context, there is a potential scenario for price to make a bullish continuation towards the 1st resistance should it break above the intermediate resistance.
The intermediate resistance level at 1.2764 is identified as a pullback resistance while the 1st resistance level at 1.2819 is noted as a pullback resistance that aligns with the 100.00% Fibonacci projection level. Higher up, the 2nd resistance level at 1.2872 is also marked as a pullback resistance that aligns close to the 127.20% Fibonacci extension level, further reinforcing its significance as a potential resistance zone.
To the downside, the 1st support level at 1.2695 is identified as an overlap support. Further below, the 2nd support level at 1.2612 is also noted as an overlap support, further reinforcing its importance as a key support level.
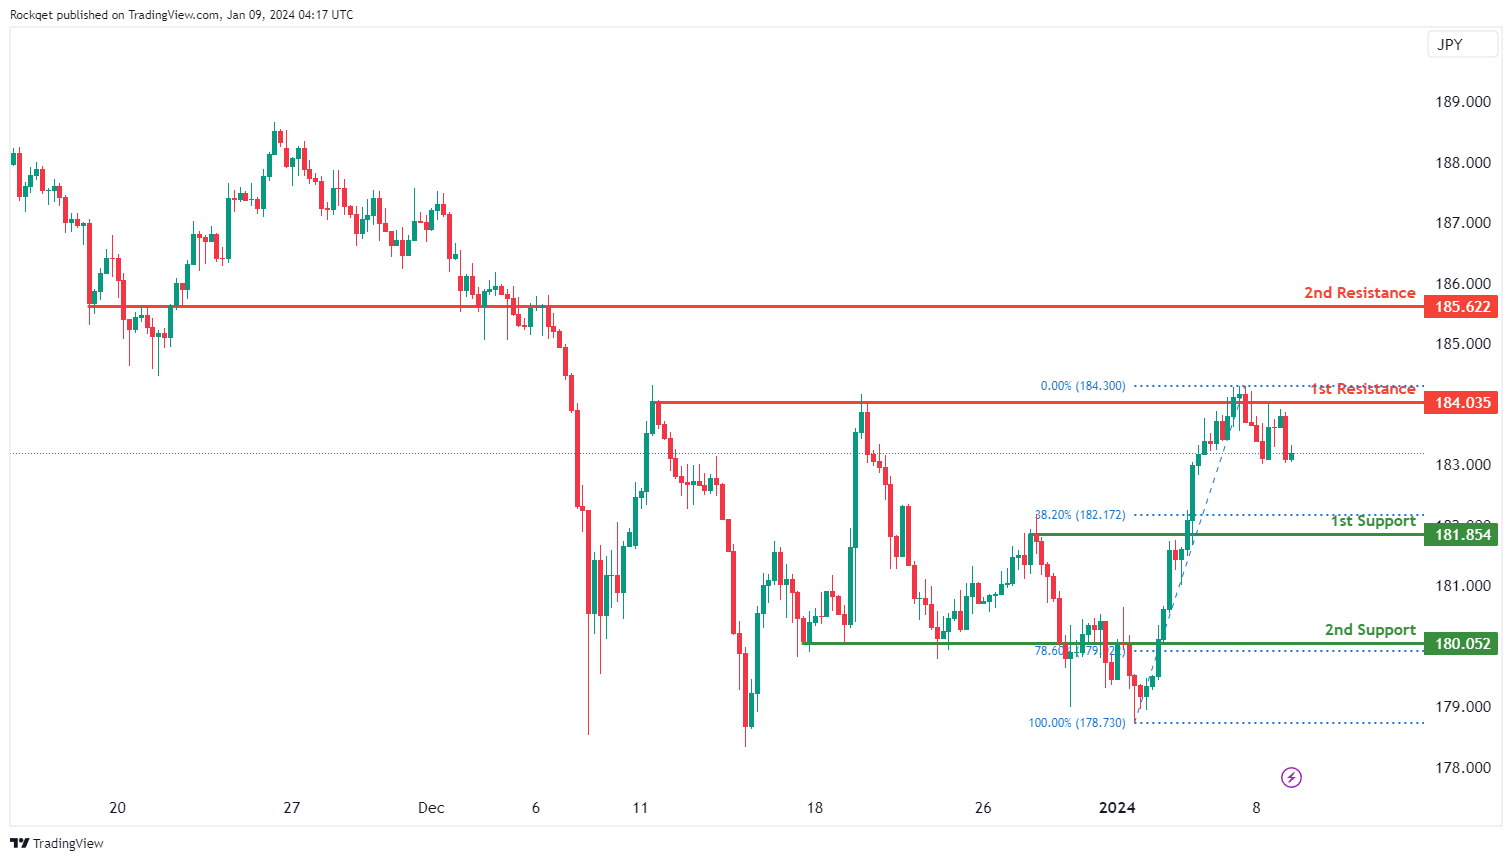
GBP/JPY:
The GBP/JPY chart currently demonstrates a bullish overall momentum, indicating an upward trend. There is a potential scenario for a bullish continuation towards the 1st resistance.
The 1st support at 181.85 is considered favorable due to its identification as an overlap support, suggesting historical significance as a level where buying interest has previously emerged. Additionally, the 38.20% Fibonacci Retracement adds confluence to the potential support at this level.
The 2nd support at 180.05 is also noted as an overlap support and aligns with the 78.60% Fibonacci Retracement, further strengthening its potential as a support level.
On the resistance side, the 1st resistance at 184.04 is identified as a multi-swing high resistance. This level may act as a barrier where historical selling interest and potential price reversal could occur.
The 2nd resistance at 185.62 is noted as an overlap resistance, adding significance to this potential resistance level.
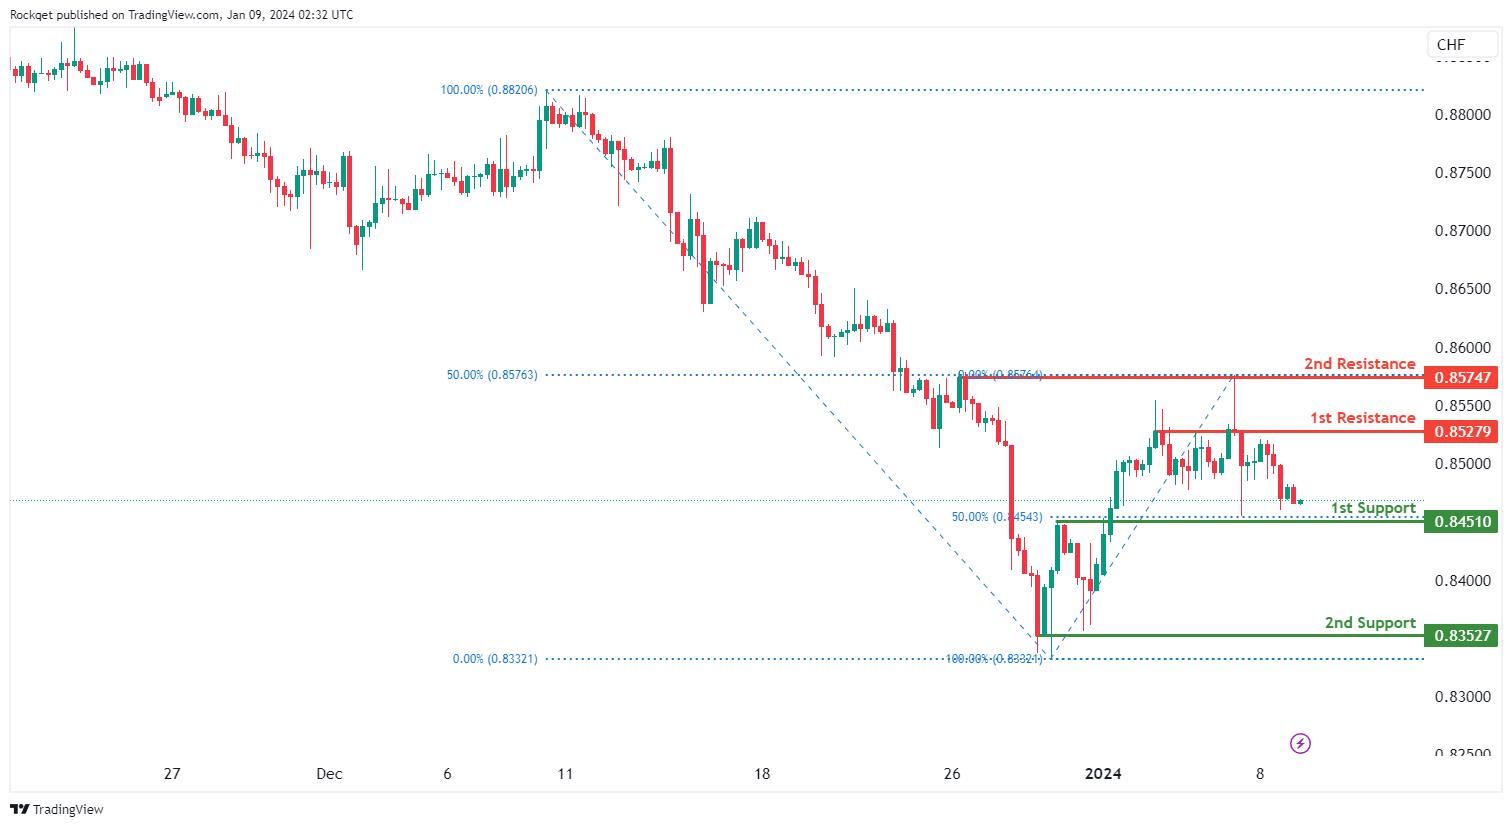
USD/CHF:
The USD/CHF chart currently displays an overall bearish momentum. In this context, there is a potential scenario for price to make a bearish continuation towards the 1st support.
The 1st support level at 0.8451 is identified as an overlap support that aligns with the 50.00% Fibonacci retracement level. Further below, the 2nd support level at 0.8352 is marked as a swing-low support, further reinforcing its importance as a key support level.
On the resistance side, the 1st resistance level at 0.8527 is identified as a pullback resistance. Higher up, the 2nd resistance level at 0.8574 is also noted as a pullback resistance that aligns with the 50.00% Fibonacci retracement level, further reinforcing its significance as a potential resistance zone.
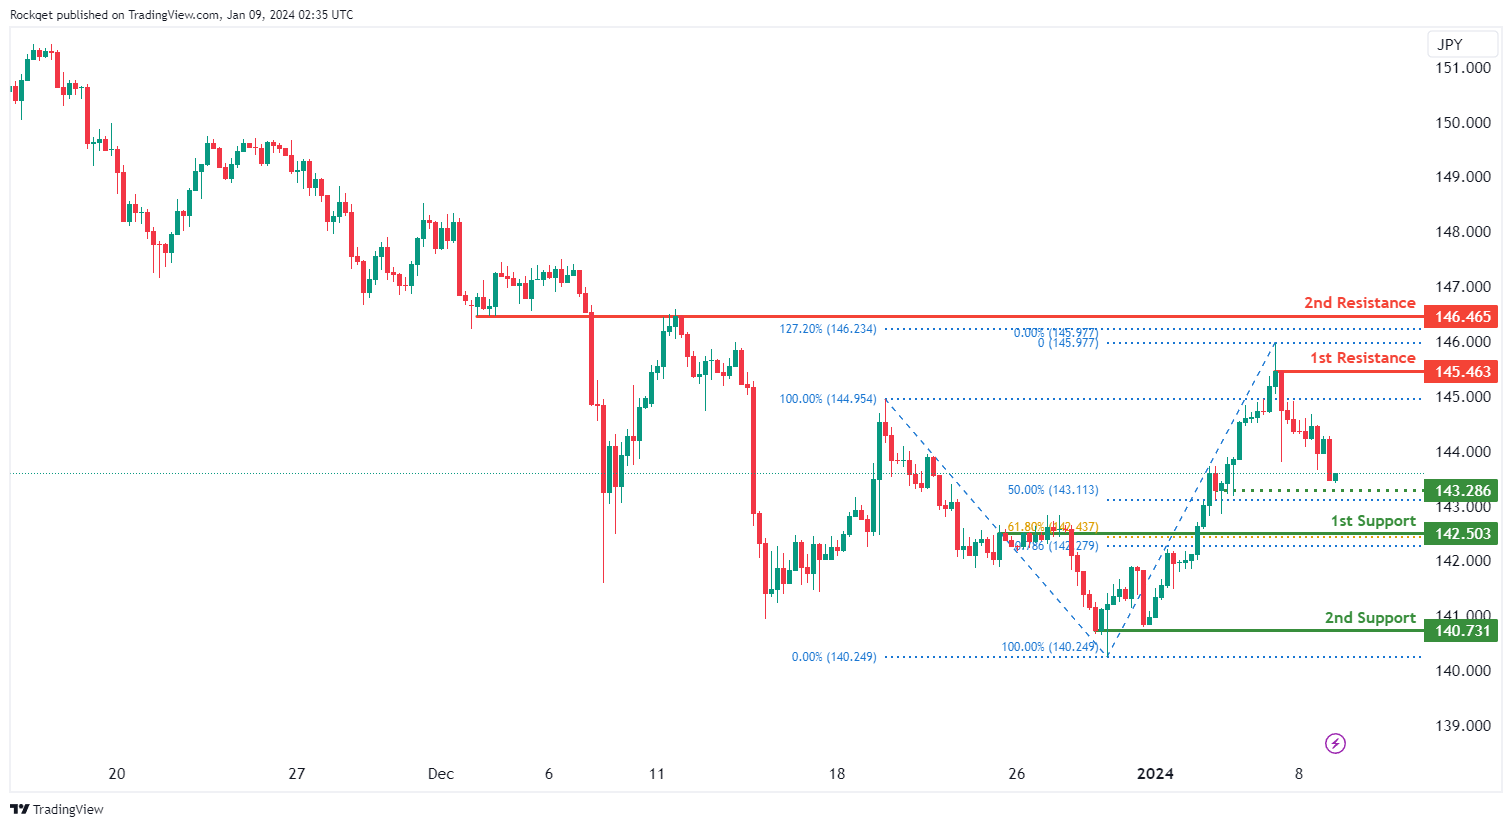
USD/JPY:
The USD/JPY chart currently displays an overall bearish momentum. In this context, there is a potential scenario for price to make a bearish continuation towards the 1st support should it break below the intermediate support.
The intermediate support level at 143.28 is identified as a pullback support that aligns close to the 50.00% Fibonacci retracement level while the 1st support level at 142.50 is also noted as a pullback support that aligns close to a confluence of Fibonacci levels i.e. the 61.80% retracement and the 78.60% projection. Further below, the 2nd support level at 140.73 is marked as a swing-low support, further reinforcing its importance as a key support level.
On the resistance side, the 1st resistance level at 145.46 is identified as a pullback resistance. Higher up, the 2nd resistance level at 146.46 is noted as an overlap resistance that aligns close to the 127.20% Fibonacci extension level, further reinforcing its significance as a potential resistance zone.
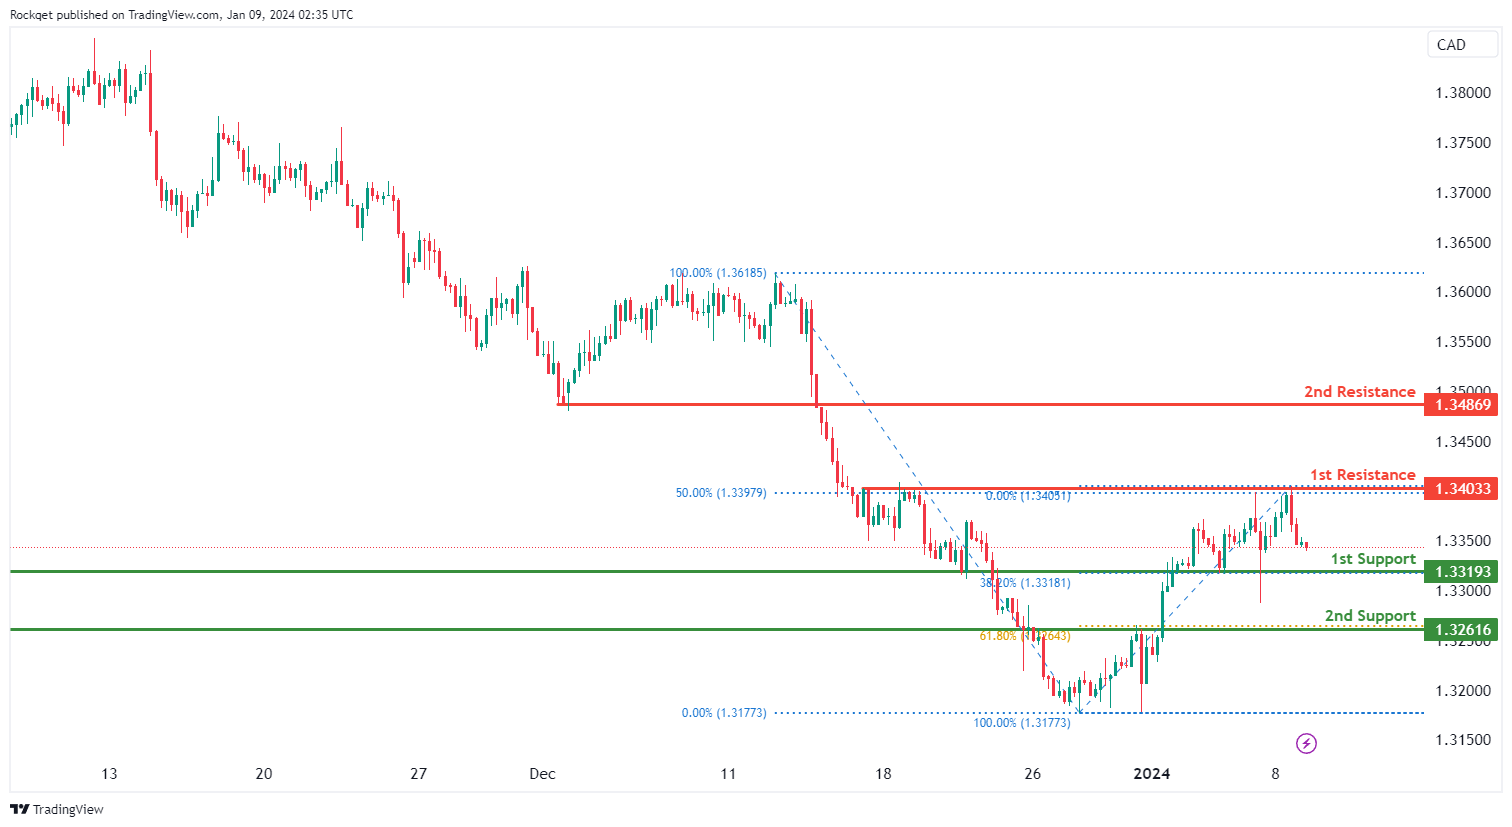
USD/CAD:
The USD/CAD chart currently exhibits an overall bullish momentum. However, there is a potential scenario for price to fall towards the 1st support and make a bullish bounce off this level.
The 1st support level at 1.3319 is identified as a pullback support that aligns with the 38.20% Fibonacci retracement level. Further below, the 2nd support level at 1.3261 is marked as an overlap support that aligns with the 61.80% Fibonacci retracement level, further reinforcing its importance as a key support level.
To the upside, the 1st resistance level at 1.3403 is identified as a pullback resistance that aligns with the 50.00% Fibonacci retracement level. Higher up, the 2nd resistance level at 1.3489 is noted as a pullback resistance, further reinforcing its significance as a potential resistance zone.
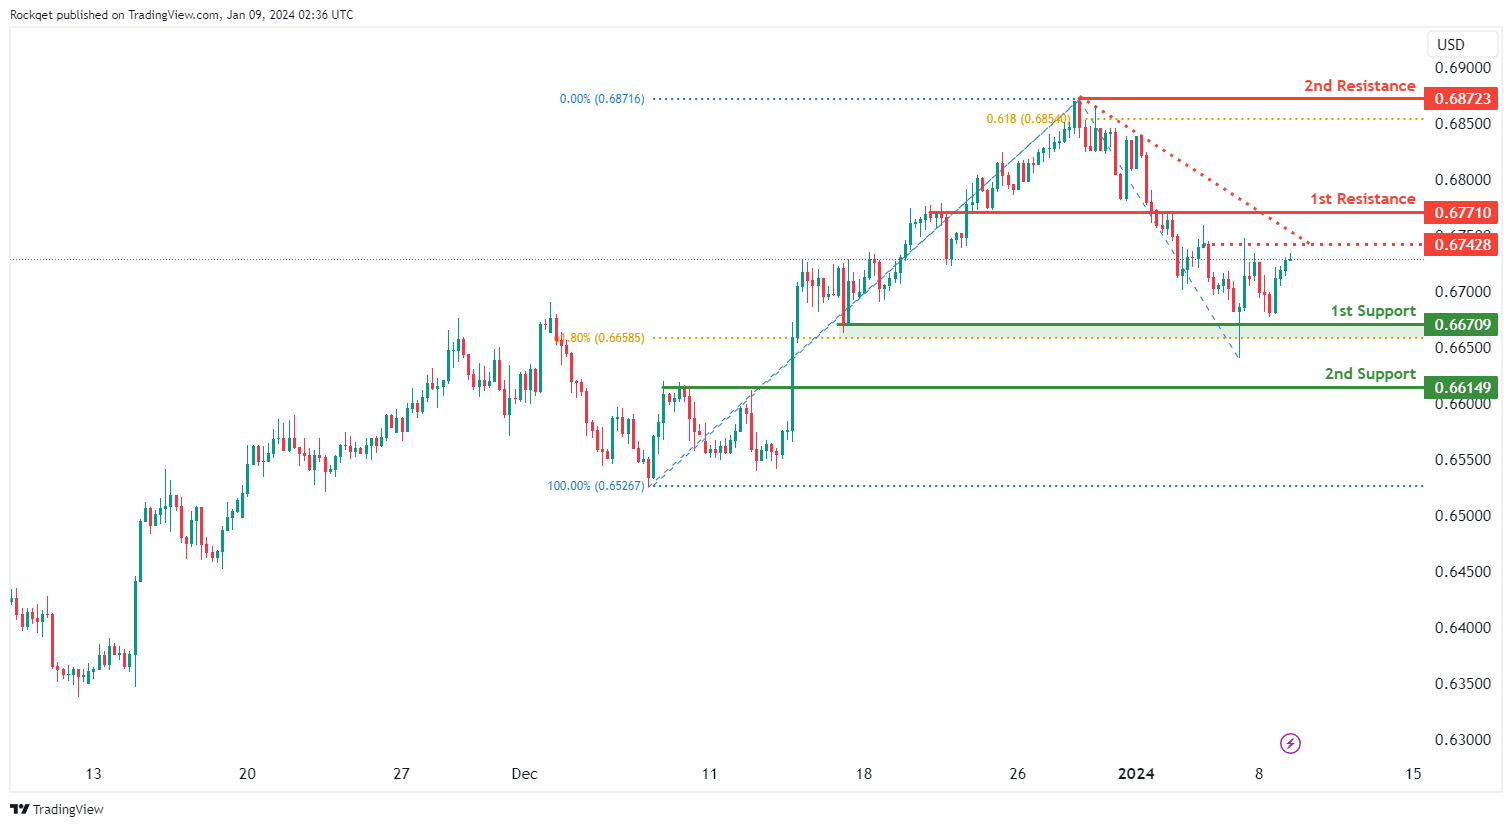
AUD/USD:
The AUD/USD chart currently exhibits an overall bearish momentum. However, there is a potential scenario for price to make a bullish rise towards the 1st resistance should it break above the descending trendline and the intermediate resistance.
The intermediate resistance level at 0.6742 is identified as a pullback resistance while the 1st resistance level at 0.6771 is identified as an overlap resistance. Higher up, the 2nd resistance level at 0.6872 is noted as a swing-high resistance that aligns with the 61.80% Fibonacci projection level, suggesting a potential barrier for further upside movement.
To the downside, the 1st support level at 0.6670 is identified as a pullback support that aligns close to the 61.80% Fibonacci retracement level. Further below, the 2nd support level at 0.6614 is also marked as an pullback support, further reinforcing its importance as a key support level.
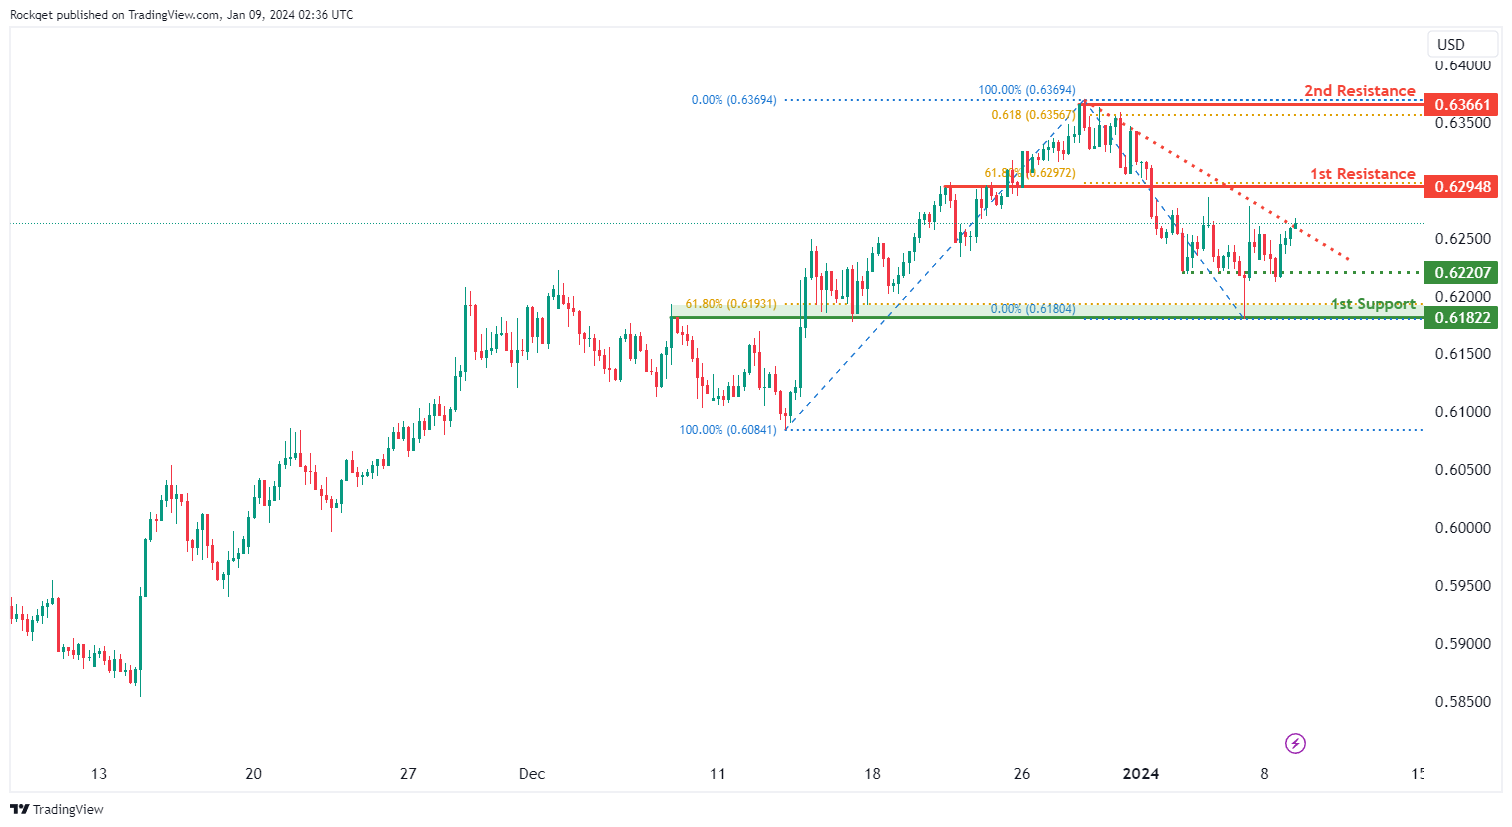
NZD/USD
The NZD/USD chart currently exhibits an overall bearish momentum. However, there is a potential scenario for price to make a bullish rise towards the 1st resistance should it break above the descending trendline.
The 1st resistance level at 0.6294 is identified as an overlap resistance that aligns with the 61.80% Fibonacci retracement level. Higher up, the 2nd resistance level at 0.6366 is noted as a swing-high resistance that aligns close to the 61.80% Fibonacci projection level, suggesting a potential barrier for further upside movement.
To the downside, the intermediate support level at 0.6220 is identified as a pullback support. Further below, the 1st support level at 0.6182 is marked as an overlap support that aligns close to the 61.80% Fibonacci retracement level, further reinforcing its importance as a key support level.
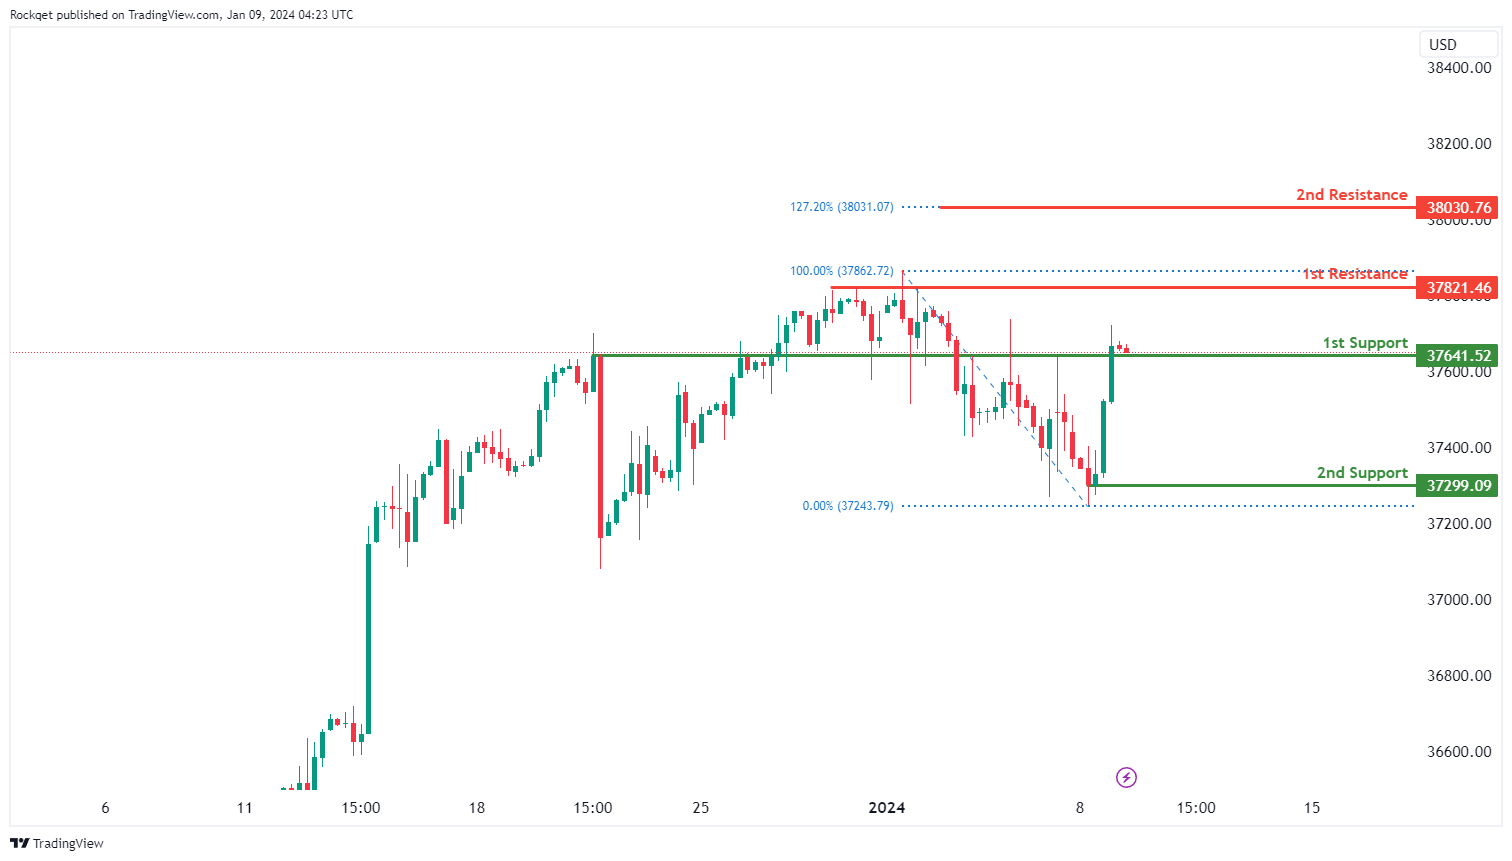
DJ30:
The DJ30 chart currently indicates a weak bearish overall momentum with low confidence, suggesting a potential downward trend. There is a scenario in which the price could continue bearishly towards the 1st support.
The 1st support at 37641.52 is considered favorable as it is identified as an overlap support, indicating historical significance as a level where buying interest has previously emerged.
The 2nd support at 37299.09 is recognized as a pullback support, further adding to its potential as a support level during a price retracement.
On the resistance side, the 1st resistance at 37821.46 is identified as a swing high resistance, which may act as a barrier where selling interest could materialize.
The 2nd resistance at 38030.76 is noteworthy for being at the 127.20% Fibonacci Extension, adding significance to this potential resistance level.
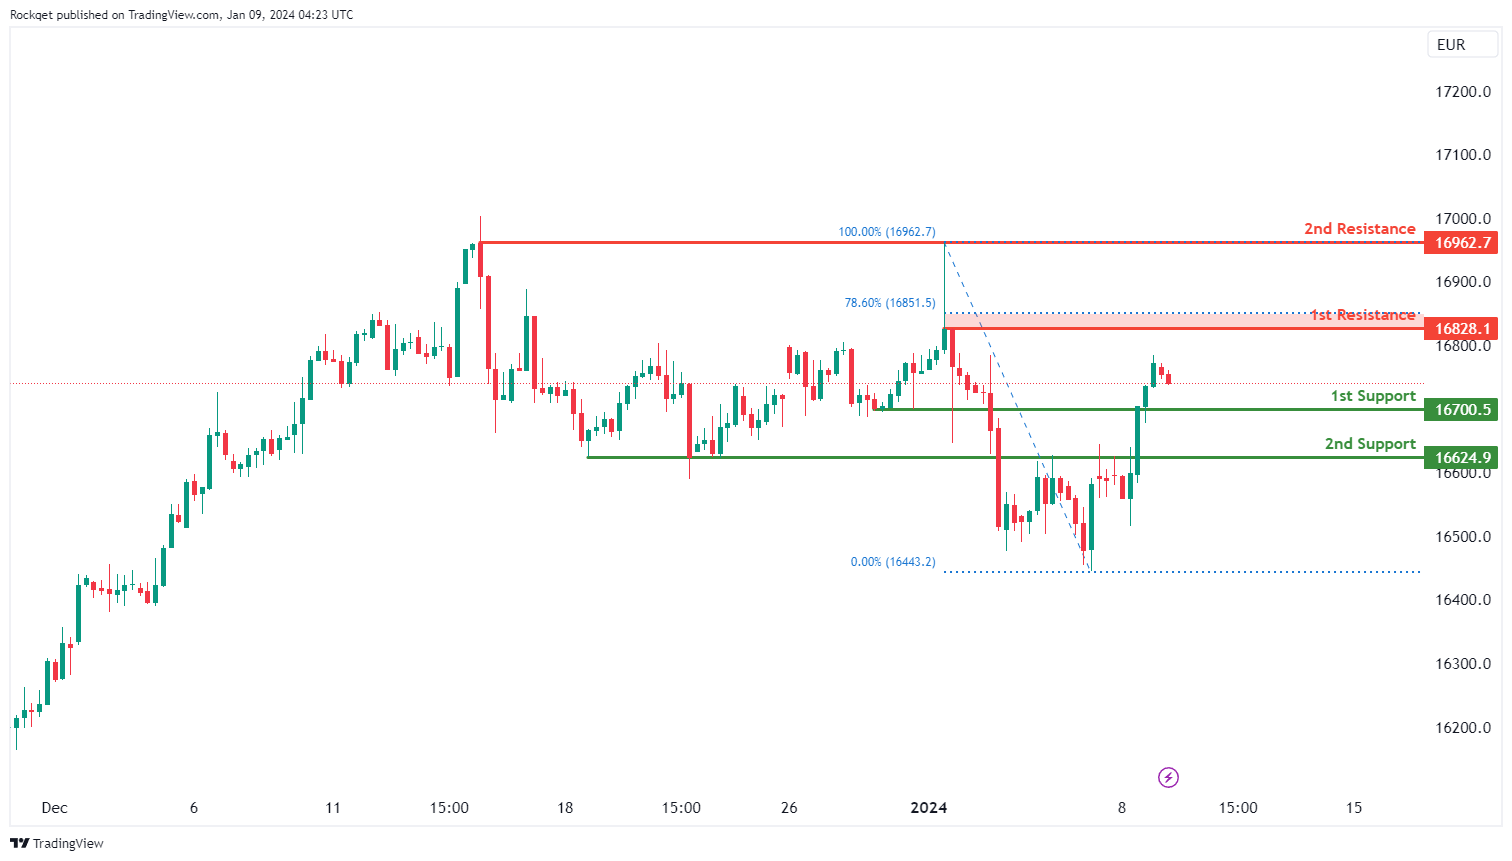
GER40:
The GER40 chart currently shows a bearish overall momentum, indicating a potential downward trend. Several factors contribute to this momentum, suggesting that the price could potentially make a bearish continuation towards the 1st support.
The 1st support at 16700.50 is considered favorable as it is identified as a pullback support, indicating a level where buying interest has historically emerged during retracements.
The 2nd support at 16624.90 is recognized as an overlap support, adding to its potential significance as a level of historical importance.
On the resistance side, the 1st resistance at 16828.10 is identified as a pullback resistance and coincides with the 78.60% Fibonacci Retracement, suggesting a level where selling interest could materialize.
The 2nd resistance at 16962.70 is noteworthy for being a swing high resistance, further reinforcing its potential as a barrier to upward movement.
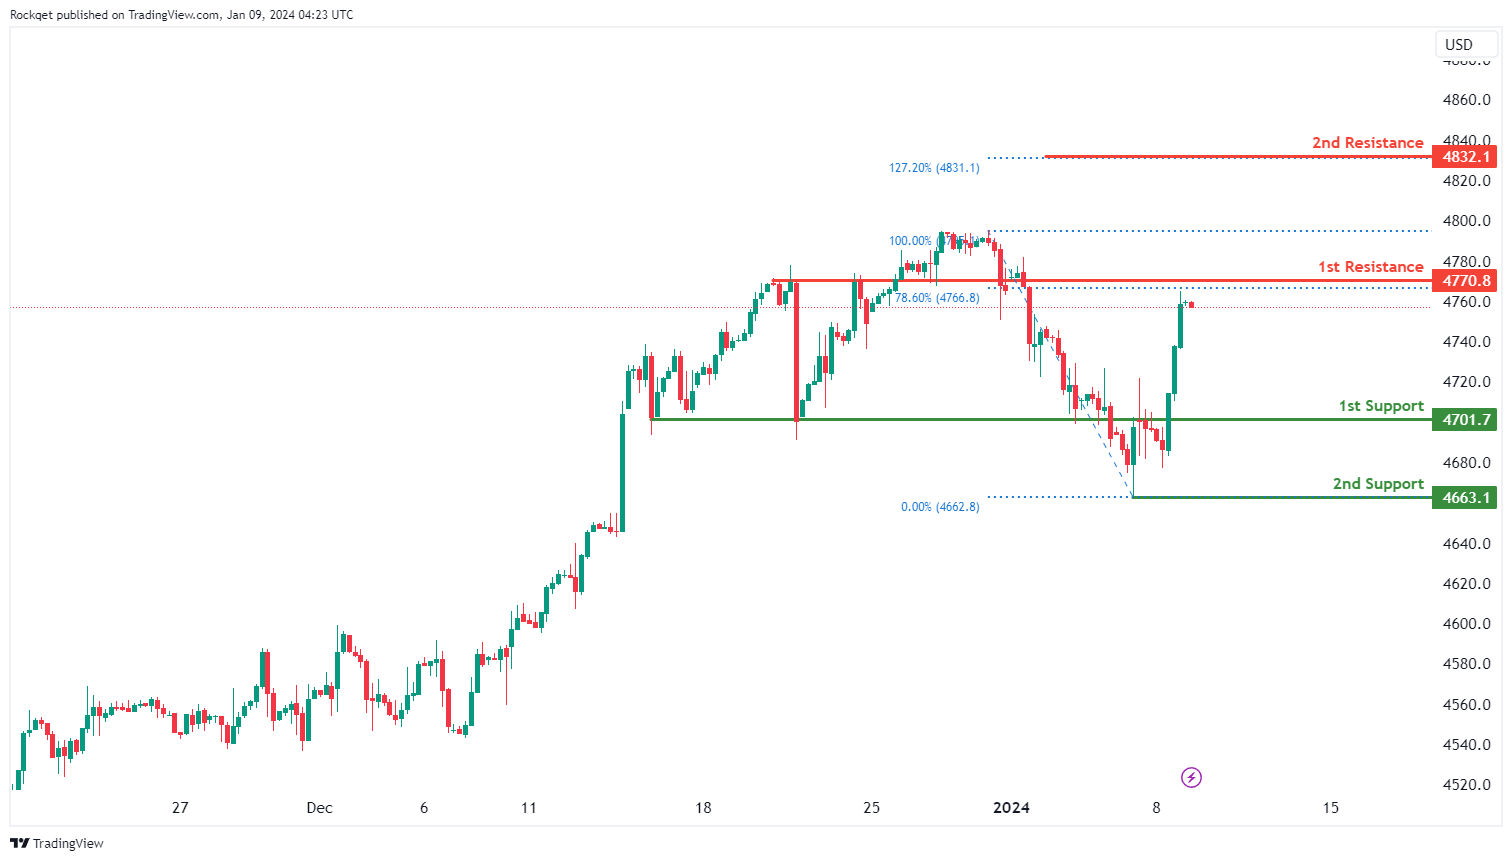
US500:
The US500 chart currently displays a bearish overall momentum, indicating a potential downward trend. Several factors contribute to this momentum, suggesting that the price could potentially make a bearish reaction off the 1st resistance and drop to the 1st support.
The 1st support at 4701.7 is considered favorable due to its identification as an overlap support, signifying historical significance as a level where buying interest has previously emerged.
The 2nd support at 4663.1 is recognized as a swing low support, adding to its potential as a support level.
On the resistance side, the 1st resistance at 4770.8 is identified as a pullback resistance and aligns with the 78.60% Fibonacci Retracement, suggesting a level where selling interest could materialize.
The 2nd resistance at 4832.1 is noteworthy for being the 127.20% Fibonacci Extension, adding significance to this potential resistance level.
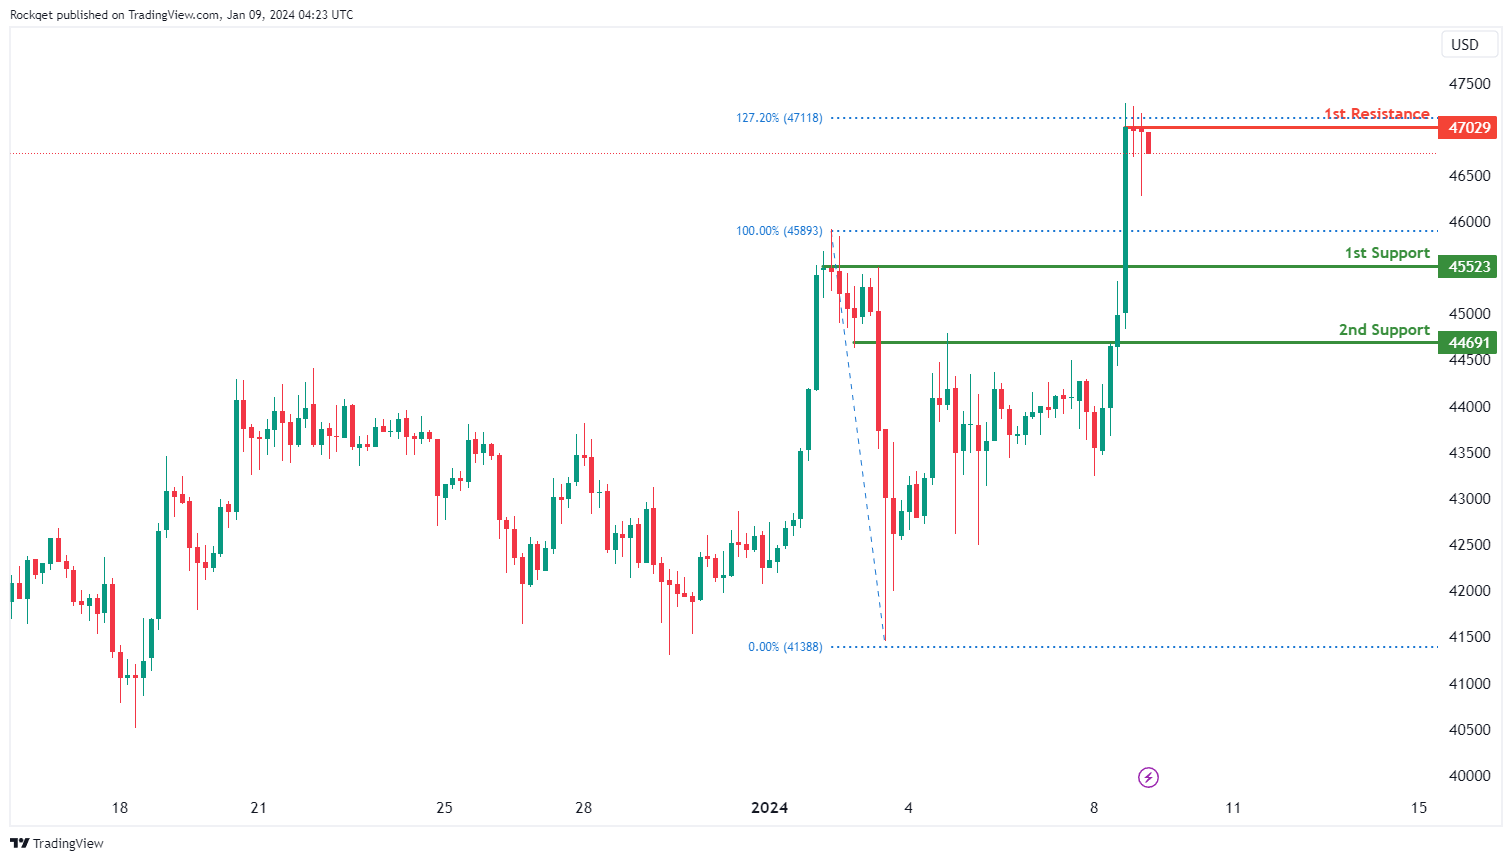
BTC/USD:
The BTC/USD chart currently reflects a bearish overall momentum, suggesting a potential downward trend. There is a scenario in which the price could make a bearish reaction off the 1st resistance and drop to the 1st support.
The 1st support at 45523 is considered favorable as it is identified as a pullback support, indicating historical significance as a level where buying interest has previously emerged.
The 2nd support at 44691 is also recognized as a pullback support, adding to its potential as a support level.
On the resistance side, the 1st resistance at 47029 is identified as a multi-swing high resistance and aligns with the 127.20% Fibonacci Extension, suggesting a level where selling interest could materialize.
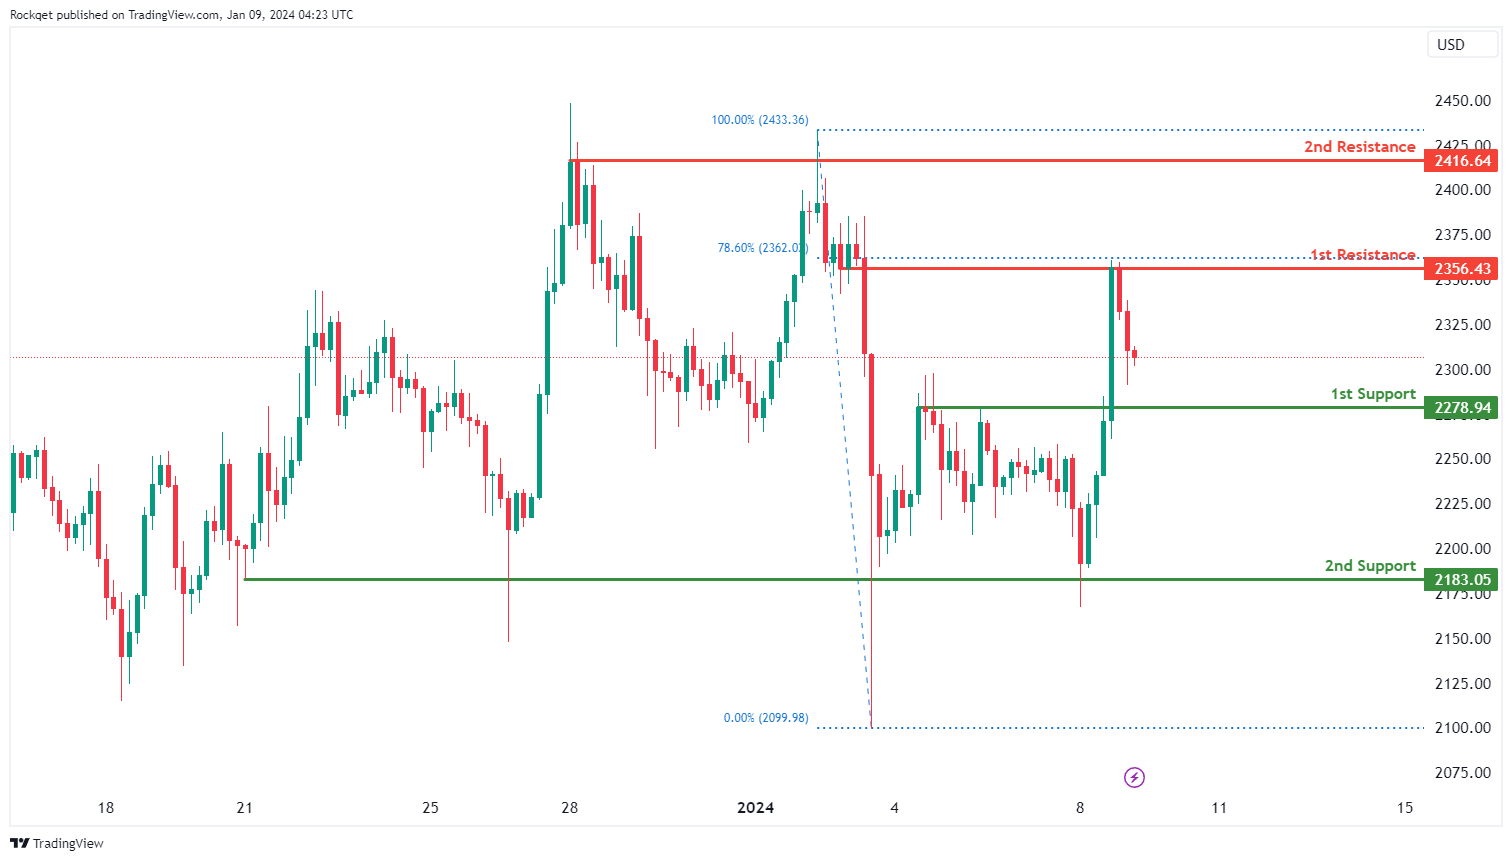
ETH/USD:
The ETH/USD chart currently exhibits a bearish overall momentum, indicating a potential downward trend. There is a scenario in which the price could make a bearish continuation towards the 1st support.
The 1st support at 2278.94 is considered favorable as it is identified as a pullback support, suggesting historical significance as a level where buying interest has previously emerged.
The 2nd support at 2183.05 is also recognized as a multi-swing low support, adding to its potential as a support level.
On the resistance side, the 1st resistance at 2356.43 is identified as an overlap resistance and aligns with the 78.60% Fibonacci Retracement, suggesting a level where selling interest could materialize.
The 2nd resistance at 2416.64 is recognized as a multi-swing high resistance, suggesting a potential barrier for further upside movement.
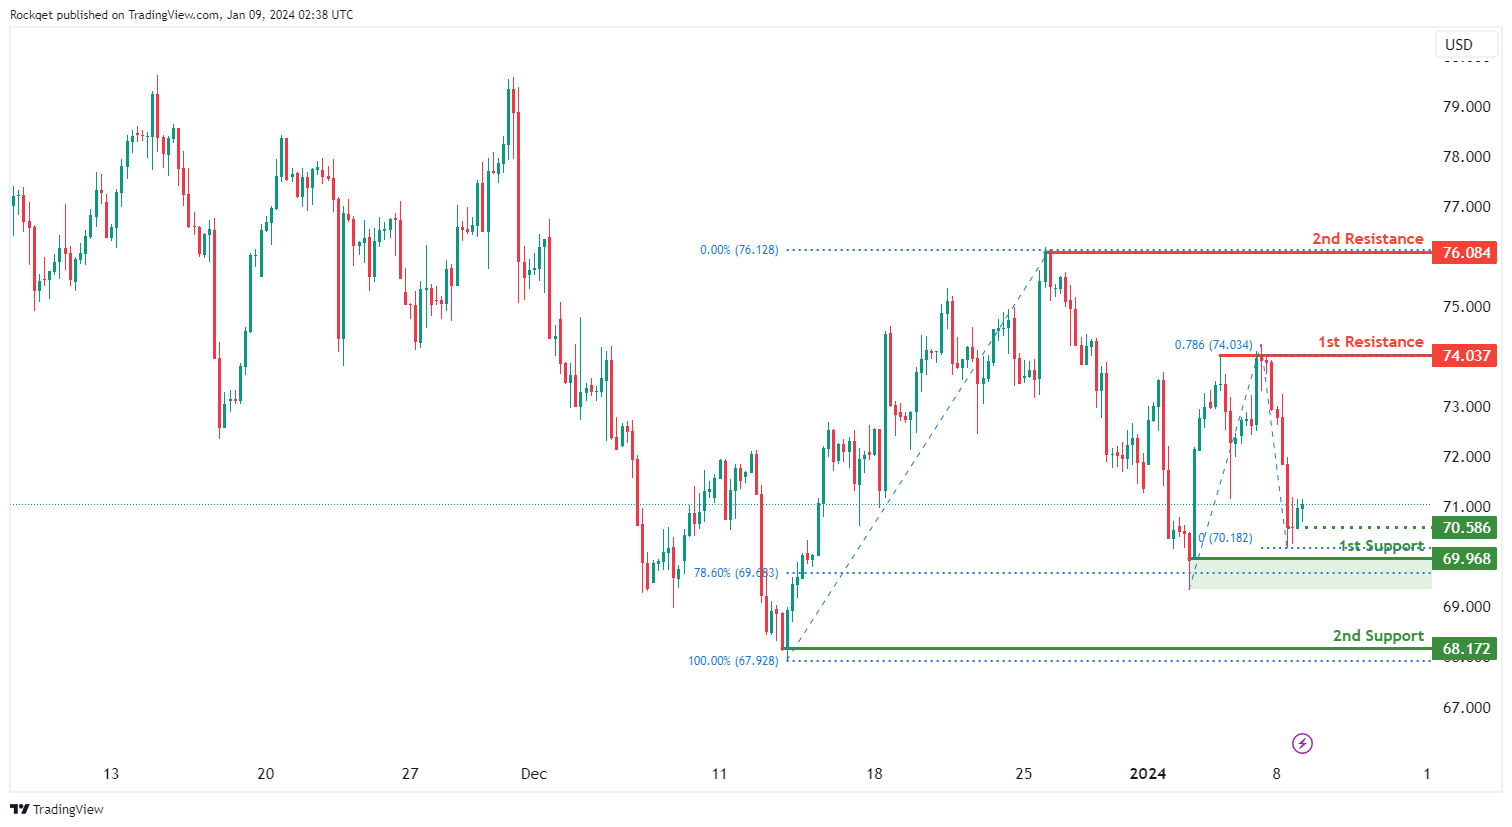
WTI/USD:
The WTI (West Texas Intermediate) chart currently exhibits an overall bearish momentum. However, there is a potential scenario for price to make a bullish reaction off the intermediate support before resuming the downtrend.
The intermediate support level at 70.58 is identified as a pullback support while the 1st support level at 69.96 is noted as a swing-low support that aligns close to the 78.60% Fibonacci retracement level. Further below, the 2nd support level at 68.17 is also marked as a swing-low support, further reinforcing its importance as a key support level.
To the upside, the 1st resistance level at 74.03 is identified as a swing-high resistance that aligns with the 78.60% Fibonacci projection level. Higher up, the 2nd resistance level at 76.08 is also noted as a swing-high resistance, suggesting a potential barrier for further upside movement.
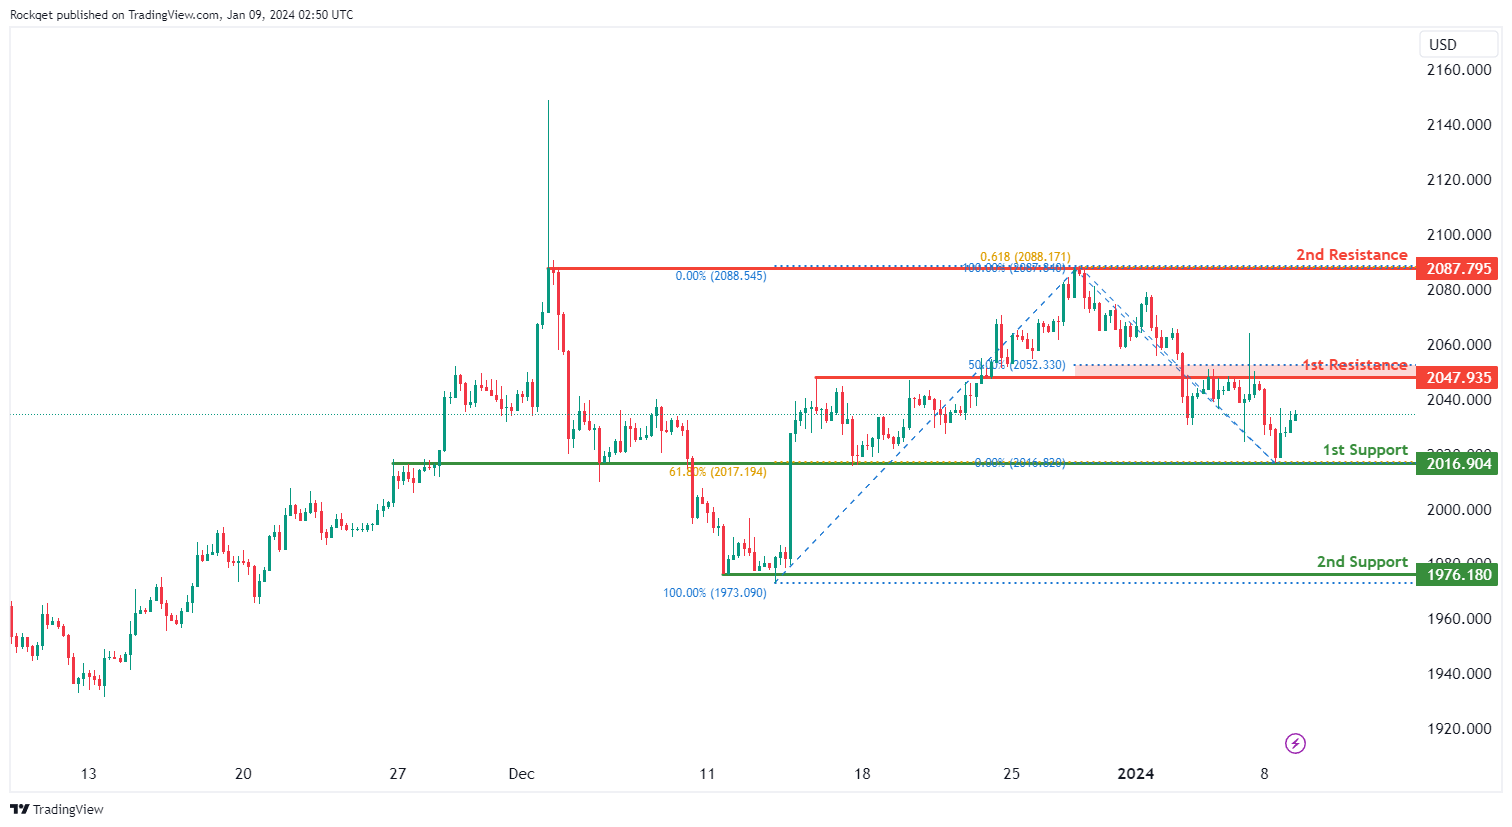
XAU/USD (GOLD):
The XAU/USD chart currently exhibits an overall bearish momentum. However, there is a potential for price to make a bullish rise towards the 1st resistance.
The 1st resistance level at 2,047.93 is identified as an overlap resistance that aligns close to the 50.00% Fibonacci retracement level. Higher up, the 2nd resistance level at 2,087.79 is noted as a swing-high resistance that aligns with the 61.80% Fibonacci projection level, suggesting a potential barrier for further upside movement.
To the downside, the 1st support level at 2,016.90 is identified as an overlap support that aligns with the 61.80% Fibonacci retracement level. Further below, the 2nd support level at 1,976.18 is marked as a swing-low support, further reinforcing its importance as a key support level.


