
- Nikkei 225 rallied to a 34-year high & outperformed the major US benchmark US stock indices year-to-date.
- Domestic demand-oriented sectors are the outperformers in the current bullish movement seen in the Japanese stock market.
- The USD/JPY is now having a negative correlation with the Nikkei 225.
- The sustainability of the current bullish tone seen in the Nikkei 225 is largely more dependent on Japan’s inflation growth outlook.
The Nikkei 225 has indeed staged the bullish breakout from its 7-month range resistance at 33,770 in today’s Asian session (10 January) and rallied to a 34-year high at 34,440.
Overall, its current 2024 year-to-date return stands at +2.9% which has outperformed the major US benchmark stock indices; S&P 500 (-0.3%), Nasdaq 100 (-0.9%), Dow Jones Industrial Average (-0.4%), and Russell 2000 (-2.9%) over the first two trading weeks of 2024.
Weak direct correlation between USD/JPY & Nikkei 225
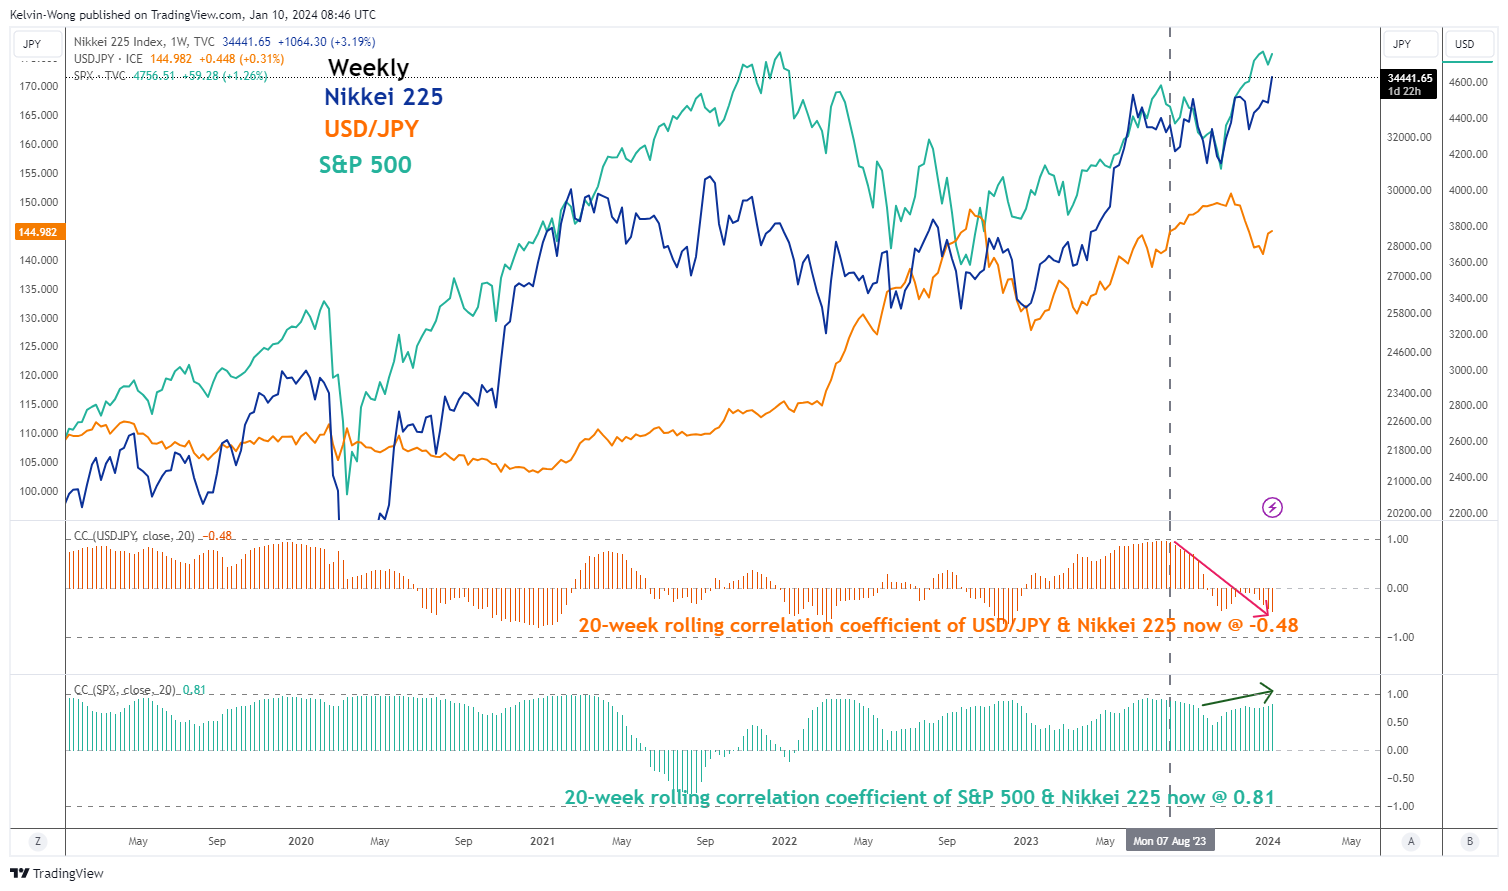
Fig 1: Long-term direct correlation analysis of USD/JPY & Nikkei 225 as of 10 Jan 2024 (Source: TradingView, click to enlarge chart)
So far since Q4 2023, the direct linkage of USD/JPY with Nikkei 225 has diminished and broken down which suggests that going forward, it is unlikely that a weaker JPY can boost investors’ sentiment in the Japanese stock market which it did in the past.
The 20-week rolling correlation coefficient of USD/JPY and Nikkei 225 has dropped to -0.48 as of 10 January 2024 at this time of the writing (see Fig 1).
An exit from a deflationary environment supports a further upmove in the Nikkei 225
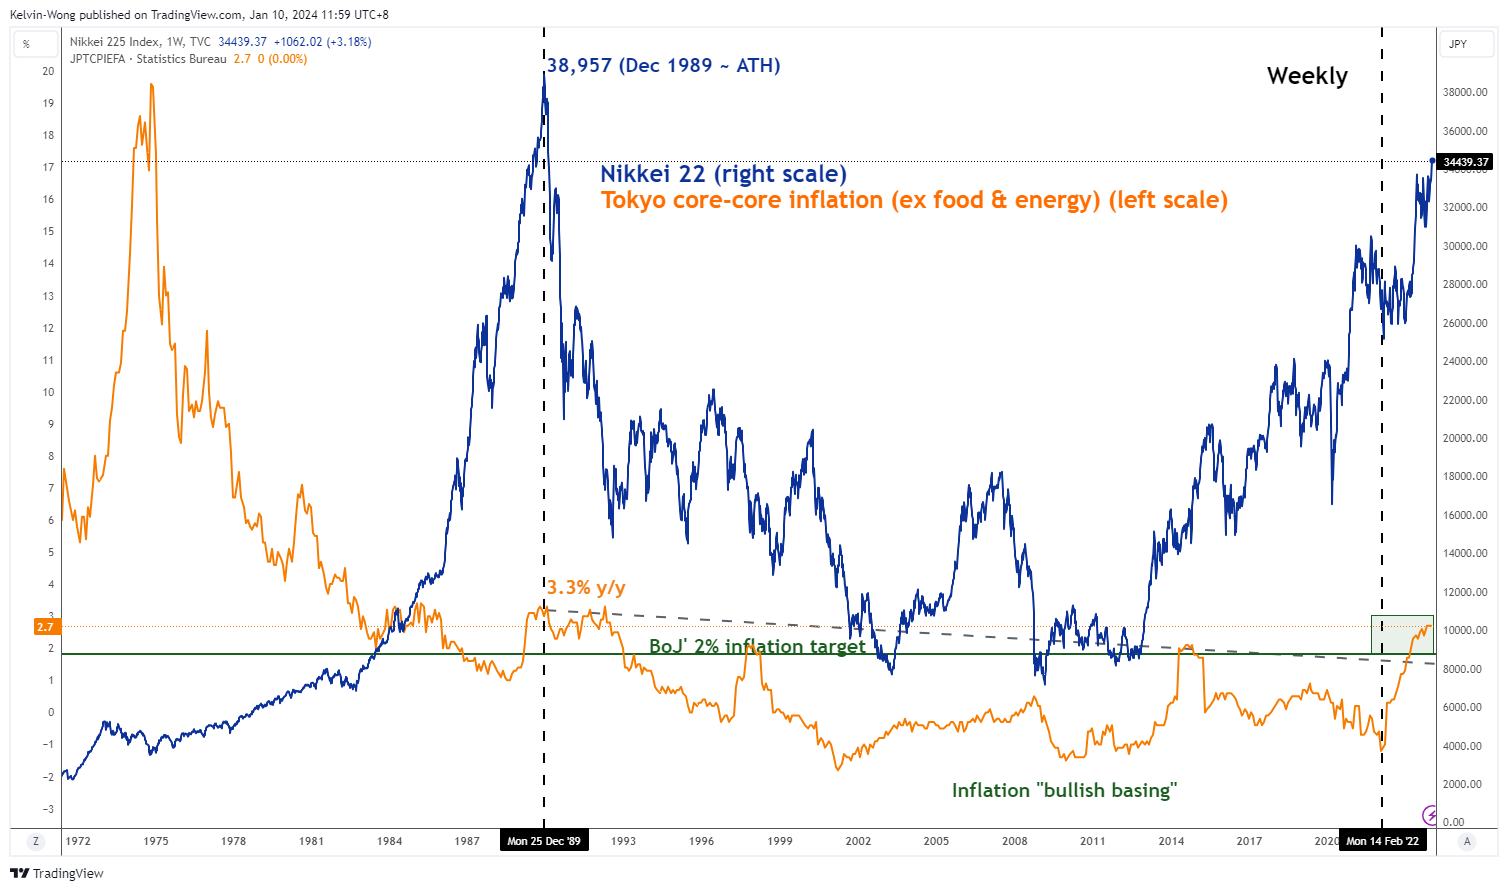
Fig 2: Trend movements of Tokyo core-core inflation with Nikkei 225 as of 10 Jan 2024 (Source: TradingView, click to enlarge chart)
Secondly, on closer inspection, the sustainability of the current bullish tone seen in the Nikkei 225 is largely more dependent on the inflation situation in Japan rather than a weaker JPY (more export-oriented). A clear path of an exit from a 20-year-plus deflationary environment is likely to lend support to another potential major uptrend phase in the Japanese stock market as consumers and business confidences resurface which in turn can see a significant increase in domestic demand.
Overlaying the leading Tokyo’s core-core inflation (excluding food and energy) trend with the Nikkei 225 (see Fig 2), the prior major uptrend of Nikkei 225 from February 2022 to June 2023 has moved in sync with an increase in the core-core inflation rate. The recent December 2023 reading of Tokyo’s core-core inflation has remained elevated at 2.7% year-on-year, unchanged from November; close to a 31-year high.
Outperformance of domestic demand-oriented sectors
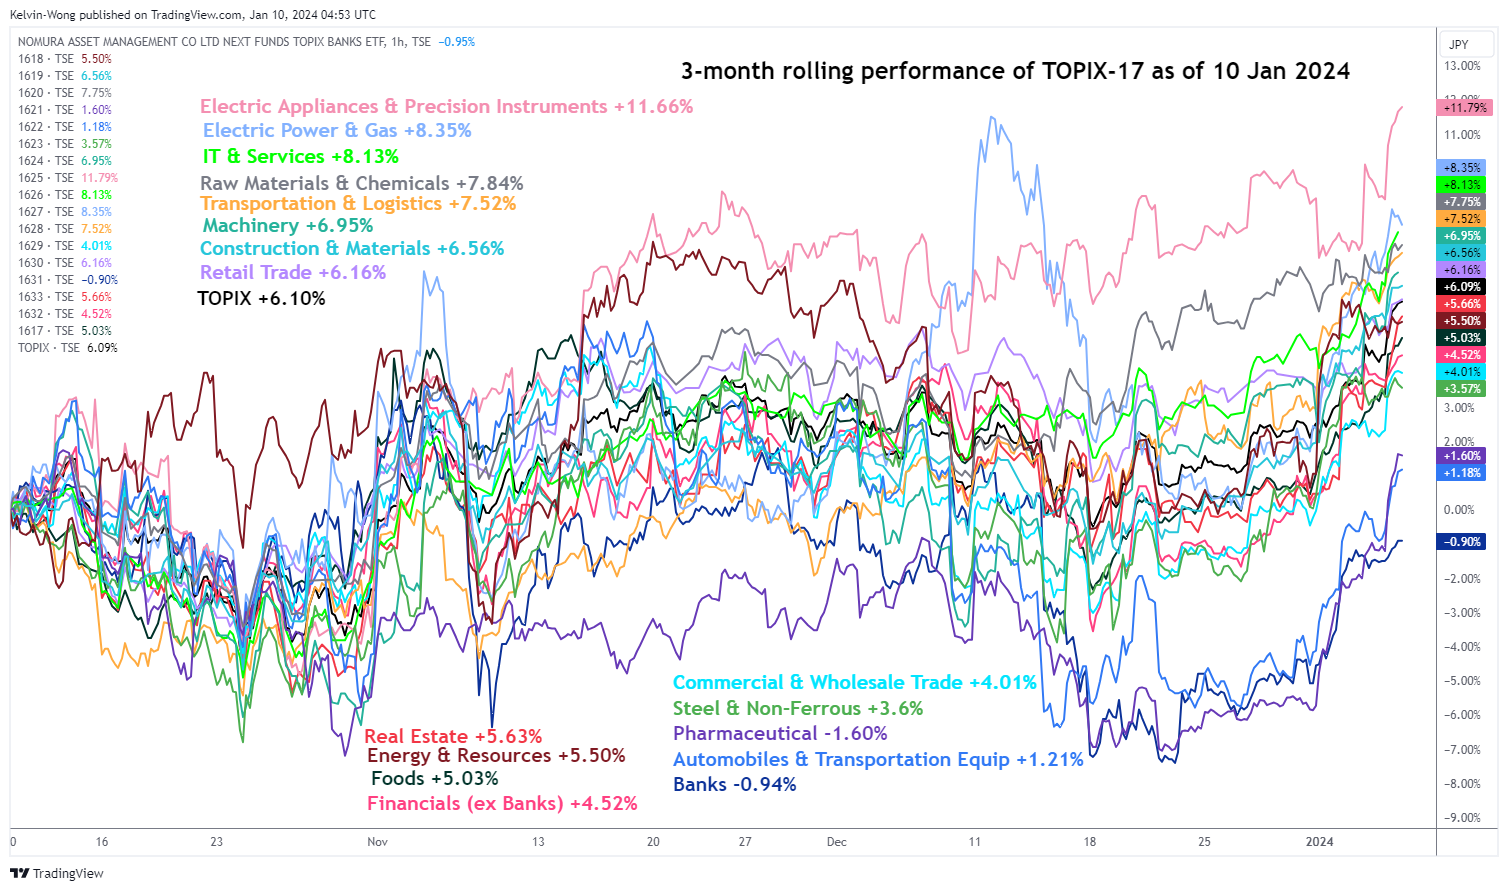
Fig 3: 3-month rolling performances of 17 TOPIX Sectors as of 10 Jan 2024 (Source: TradingView, click to enlarge chart)
From a medium-term sector rotation perspective (3-month rolling performance) among the 17 core TOPIX sectors, several domestic demand-oriented sectors such as IT & Services (+8.13%), Transportation & Logistics (+7.52%), Construction & Materials (+6.65%) outperformed the general market (TOPIX +6.10%). In contrast, sectors that tend to depend on a weaker JPY underperformed; Commercial & Wholesale Trade (+4%), and Automobiles & Transportation Equipment (+1.21%) (see Fig 3).
36,600 next major resistance to watch on Nikkei 225
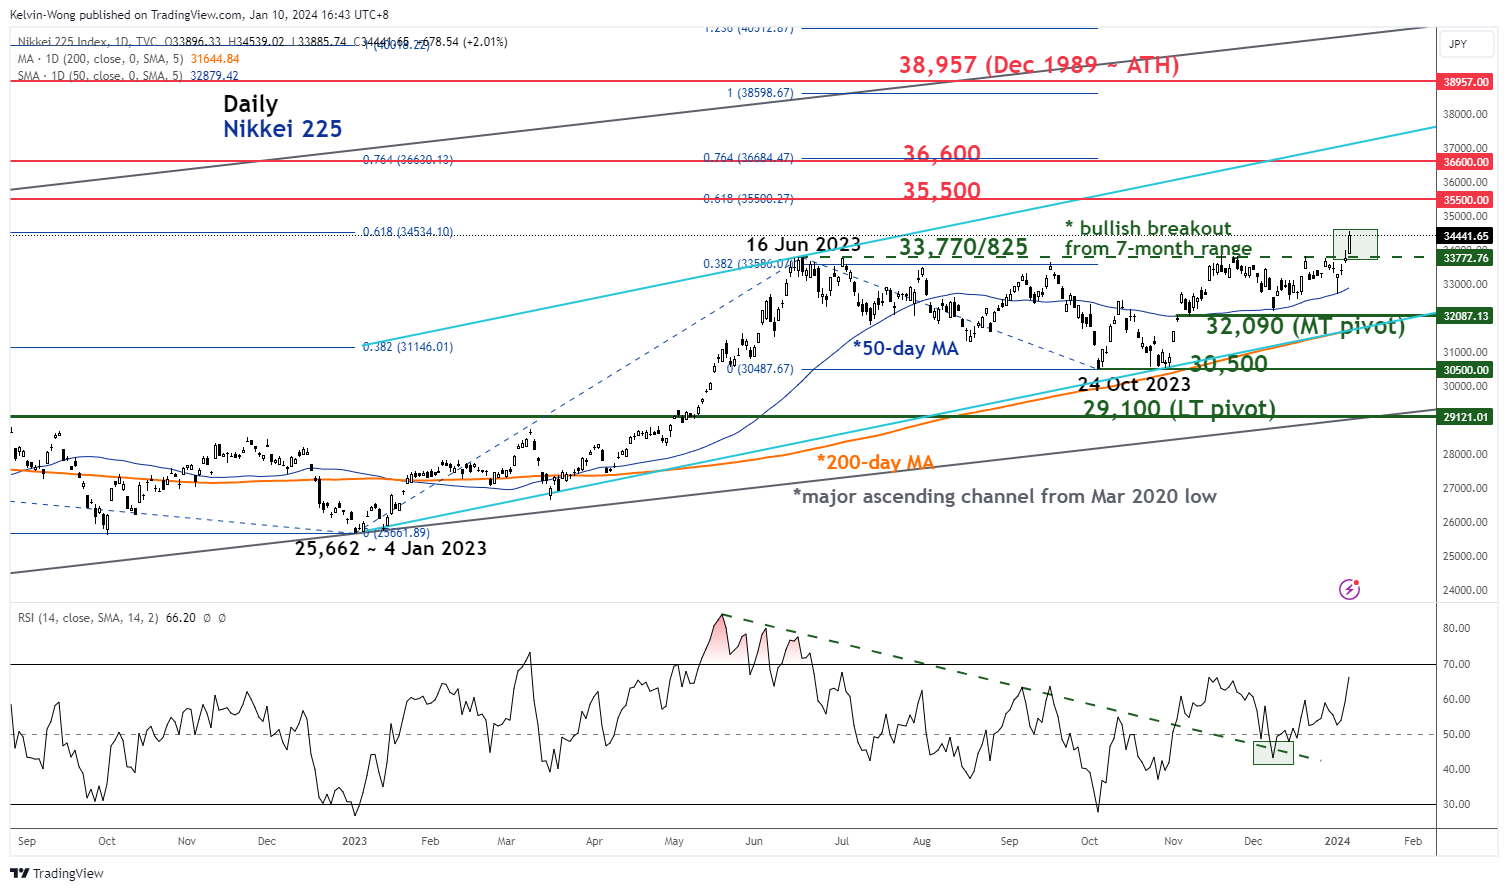
Fig 4: Nikkei 225 major & medium-term trends as of 10 Jan 2024 (Source: TradingView, click to enlarge chart)
In the lens of technical analysis, the Nikkei 225 is likely to have kickstarted a potential fresh major uptrend phase with its key medium-term pivotal support at 32,090 (the lower boundary of the ascending channel from 4 January 2023 low & upward sloping 200-day moving average).
The next major resistance stands at 36,600 which is defined by the upper boundary of the ascending channel and a cluster of Fibonacci extension levels.
In addition, the daily RSI momentum indicator has continued to exhibit bullish momentum conditions and has not reached an extreme overbought region (above 70 level).
On the other hand, failure to hold at 32,090 negates the bullish tone to expose the next medium-term support at 30,500 in the first step.


 and rallied to a 34-year high at 34,440.)