
DXY:
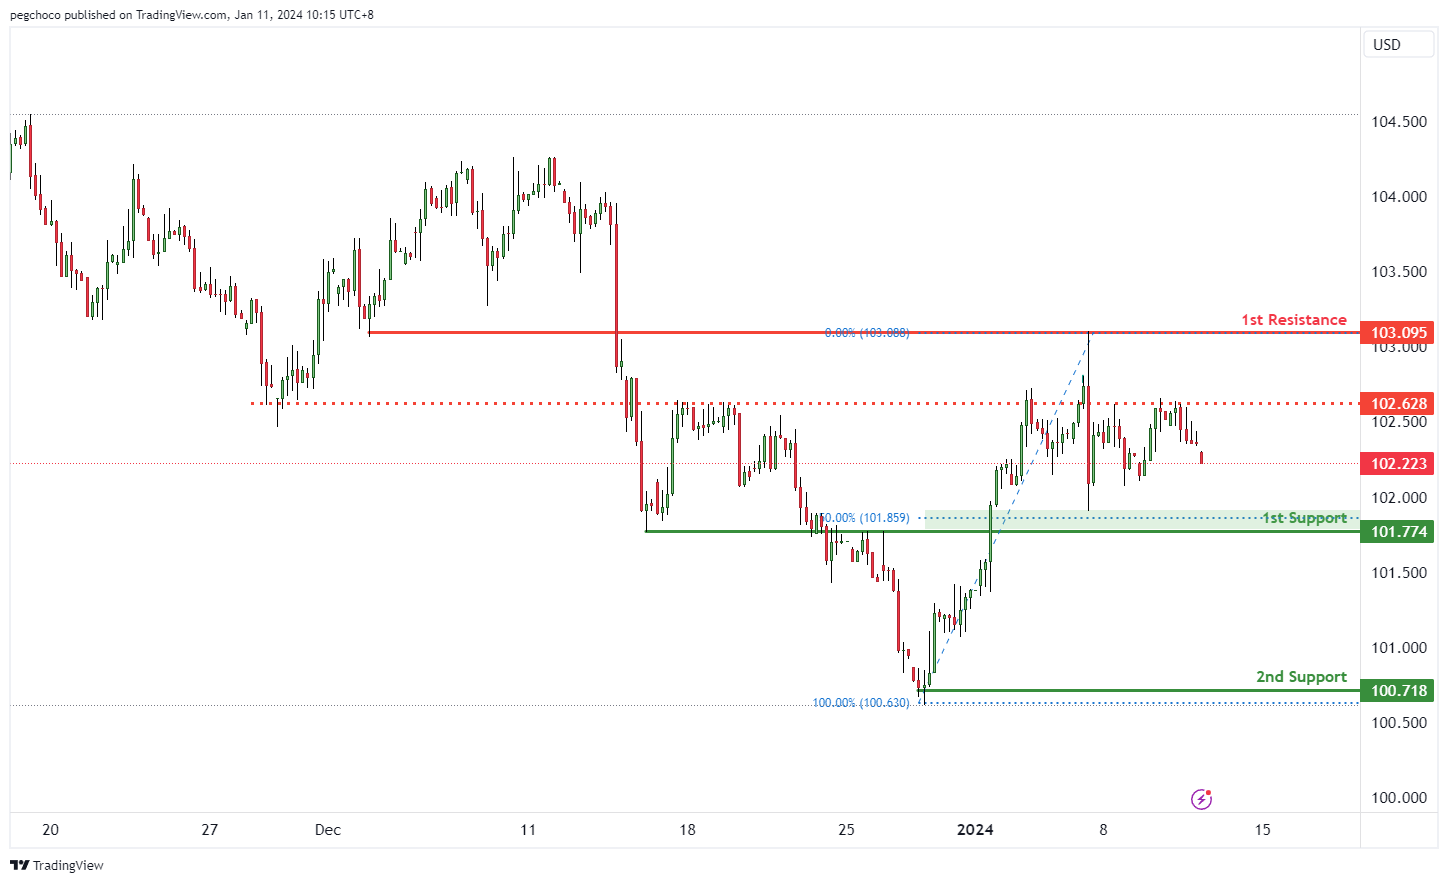
The DXY chart currently exhibits a bearish overall momentum, indicating a weakened US Dollar. In this scenario, there’s potential for a bearish continuation towards the 1st support level.
The 1st support at 101.77 is significant for several reasons. It is categorized as an overlap support and coincides with the 50% Fibonacci Retracement level, making it a strong potential support zone. This level may serve as a point where buying interest could potentially emerge, providing temporary support for the DXY.
The 2nd support at 100.71 is identified as a swing low support, further reinforcing its significance as a potential support area.
On the resistance side, the 1st resistance at 103.09 is marked as an overlap resistance, indicating a potential barrier where selling interest could intensify.
Intermediate resistance at 102.62 is also categorized as an overlap resistance, further supporting the idea of potential resistance in the short term.
EUR/USD:
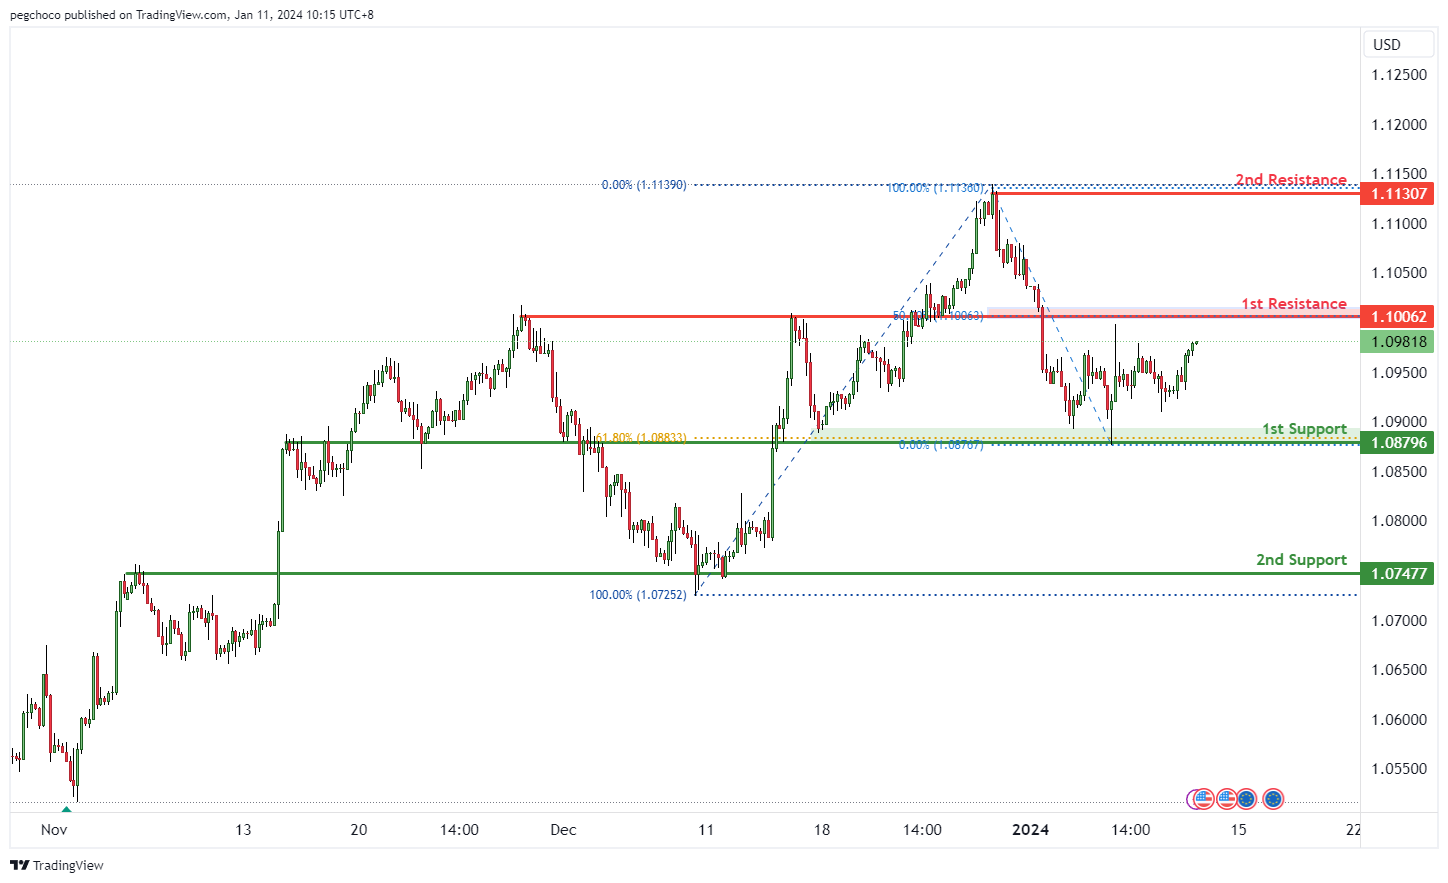
The EUR/USD chart currently has a bullish overall momentum, indicating strength in the Euro relative to the US Dollar.
In the short term, there’s potential for a bullish continuation towards the 1st resistance level.
The 1st support at 1.0879 is significant for several reasons. It is an overlap support, and it also aligns with the 61.80% Fibonacci Retracement level.
The 2nd support at 1.0747 is identified as an overlap support, further reinforcing its significance as a potential support area.
On the resistance side, the 1st resistance at 1.1006 is categorized as an overlap resistance.
The 2nd resistance at 1.1130 is considered a swing high resistance, often marking points of reversal or resistance in price movement.
EUR/JPY:
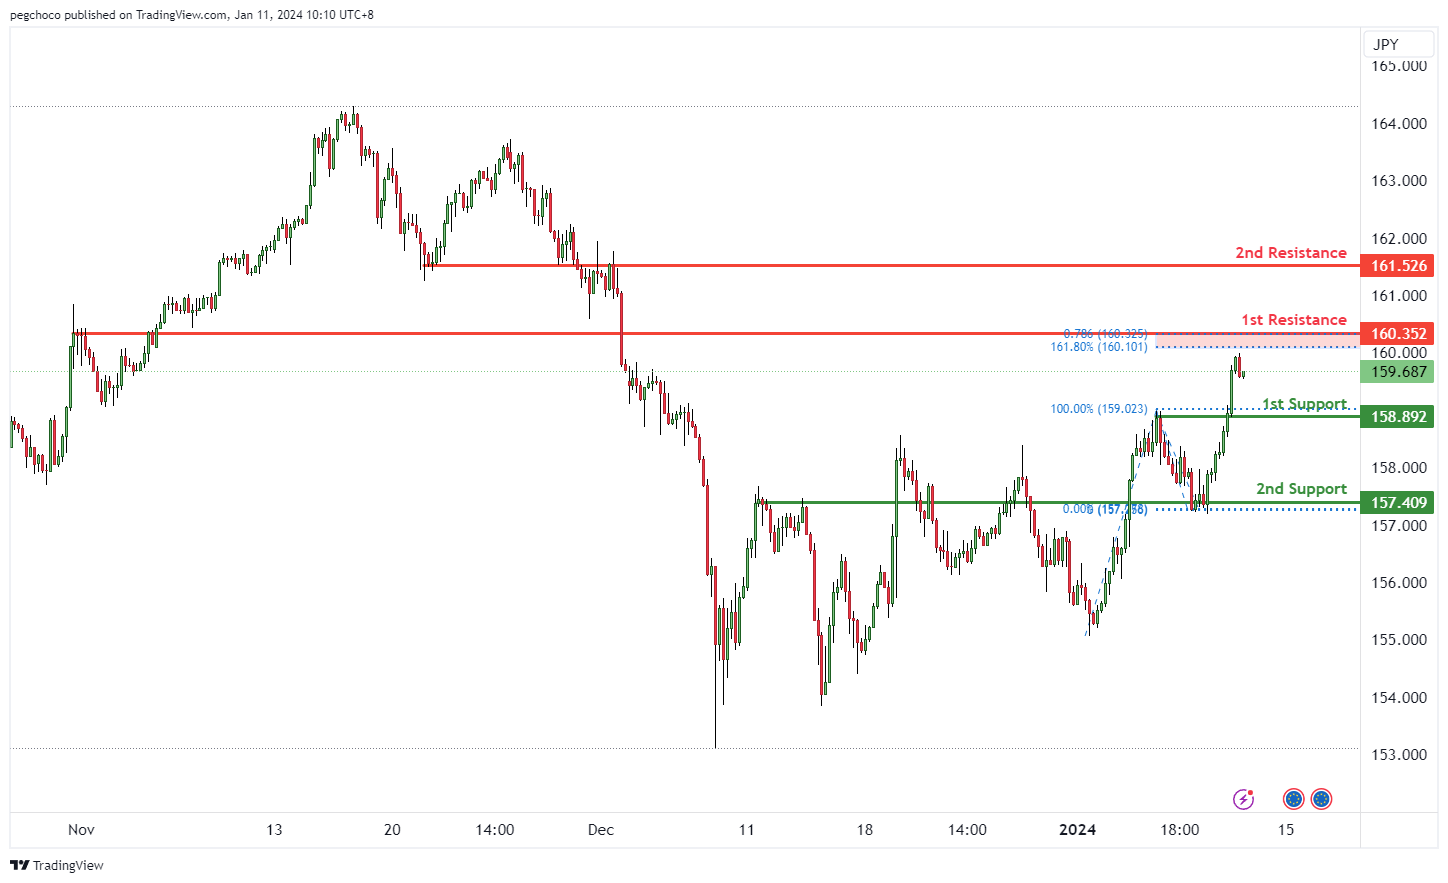
The EUR/JPY chart currently displays a bearish overall momentum, indicating weakness in the Euro compared to the Japanese Yen. This momentum suggests the potential for a bearish reaction off the 1st resistance level.
The 1st support at 158.89 is considered a pullback support, and it coincides with the 50% Fibonacci Retracement level. This confluence of factors makes it a noteworthy level where selling pressure may ease, offering temporary support for EUR/JPY.
The 2nd support at 157.40 is identified as an overlap support, underscoring its significance as a potential area where buyers could step in.
On the resistance side, the 1st resistance at 169.35 is classified as a pullback resistance, indicating a level where the price may encounter selling interest or potential reversal.
The 2nd resistance at 161.52 is characterized as an overlap resistance, adding to its importance as a potential barrier to the price’s upward movement.
EUR/GBP:
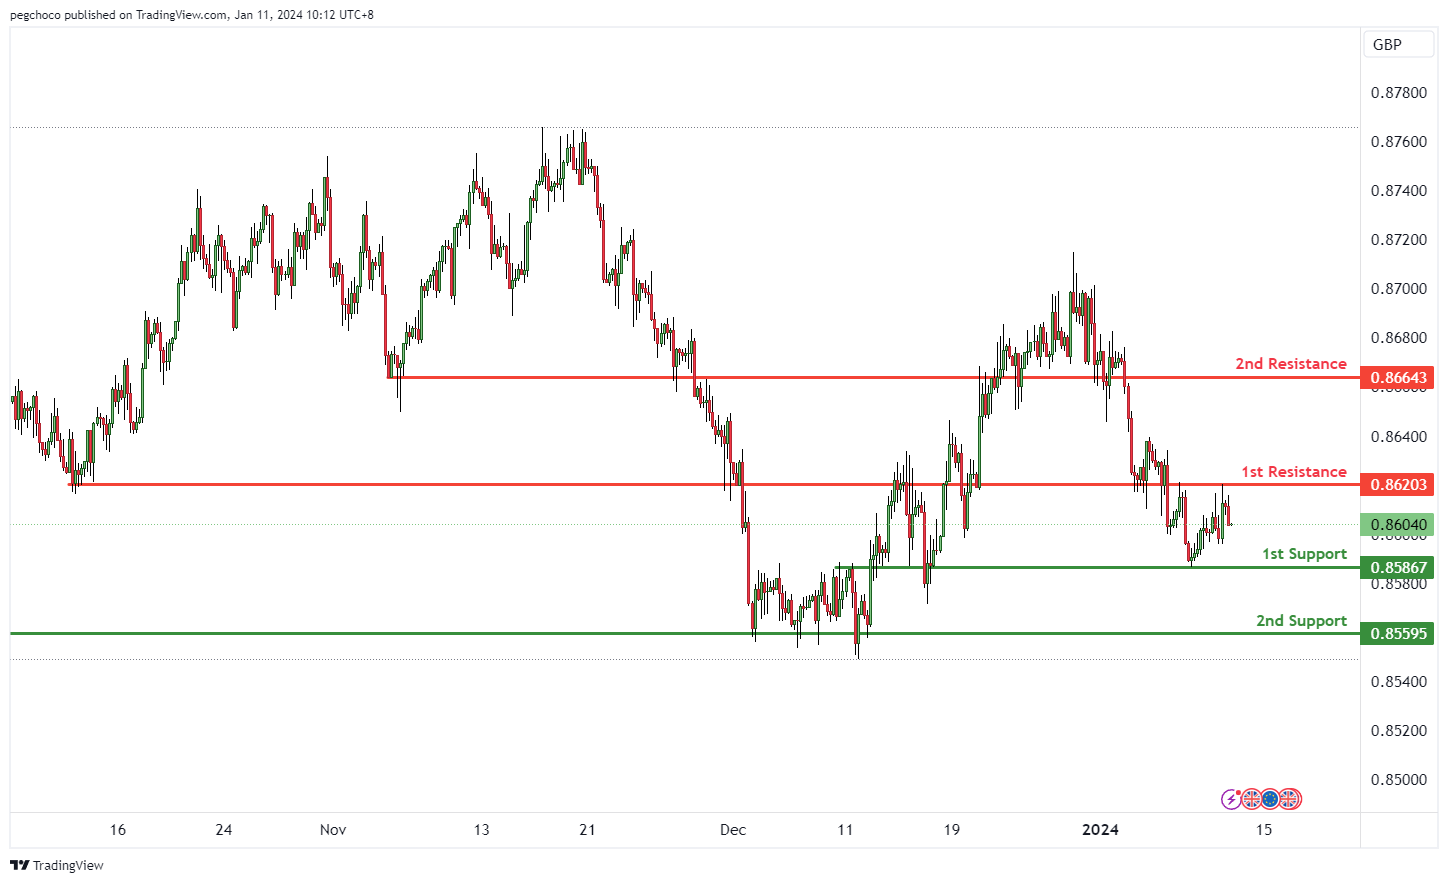
The EUR/GBP chart is currently showing a bearish overall momentum, indicating a preference for the British Pound over the Euro. This momentum suggests the potential for a bearish continuation towards the 1st support level.
The 1st support at 0.8586 is classified as an overlap support, signifying its significance as a potential level where buying interest may emerge, providing temporary support for EUR/GBP.
The 2nd support at 0.8559 is characterized as multi-swing low support, further reinforcing its importance as a potential support zone.
On the resistance side, the 1st resistance at 0.8620 is identified as an overlap resistance, suggesting a level where selling pressure or a potential reversal may occur.
The 2nd resistance at 0.8664 is categorized as a pullback resistance, underscoring its significance as a potential barrier to the price’s upward movement.
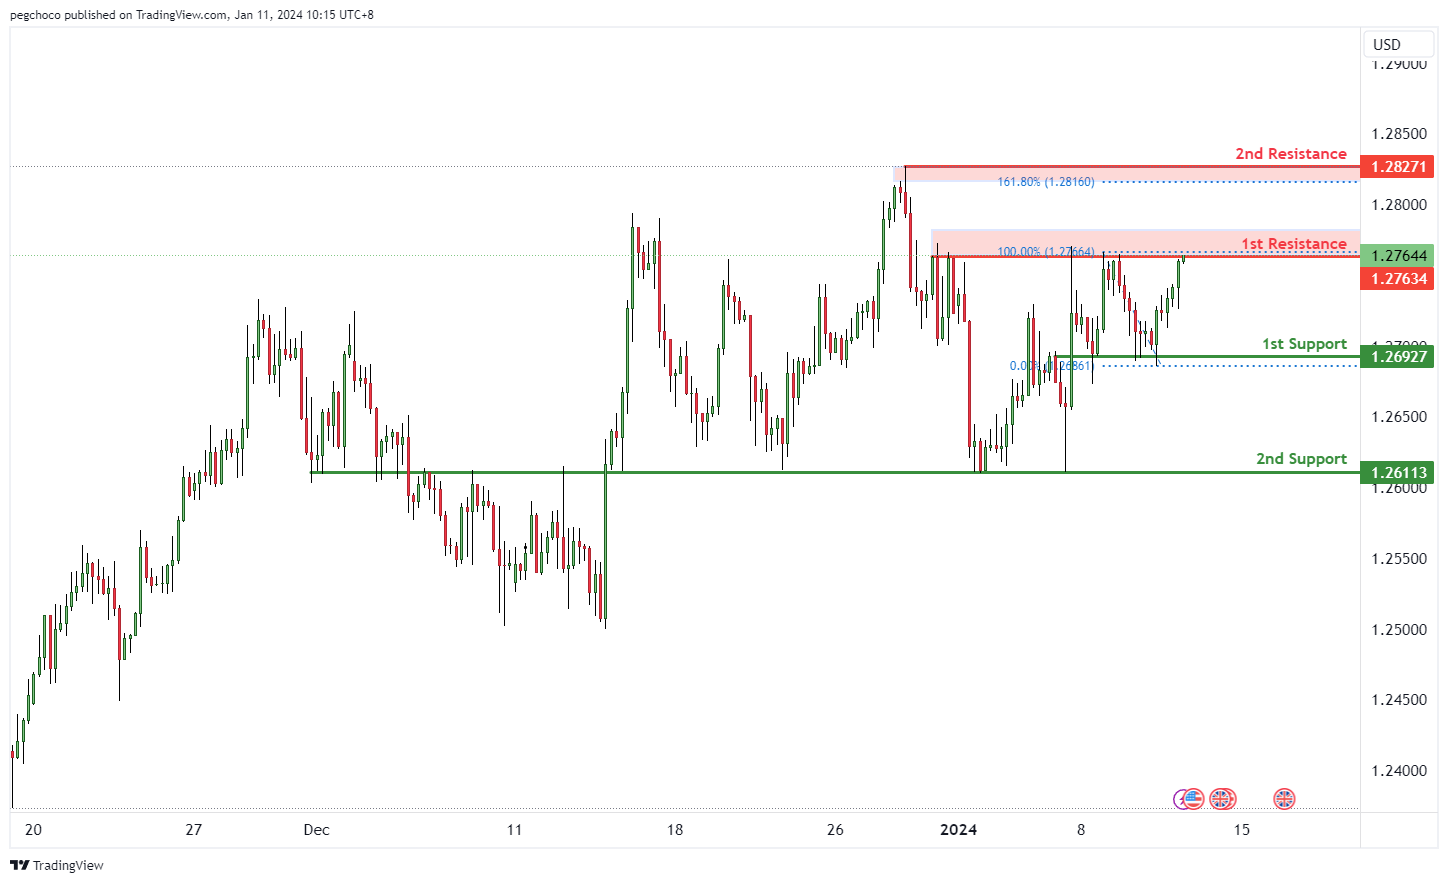
GBP/USD:
The GBP/USD chart currently has a bullish overall momentum, suggesting that the British Pound is stronger compared to the US Dollar.
In the short term, there’s potential for the price to drop further to the 1st support level before bouncing from there and rising to the 1st resistance.
The 1st support at 1.2692 is considered a significant level as it is an overlap support.
The 2nd support at 1.2611 is also identified as an overlap support, reinforcing its significance as a potential support zone.
On the resistance side, the 1st resistance at 1.2763 is categorized as a multi-swing high resistance, which often represents a strong barrier where selling interest may emerge.
The 2nd resistance at 1.2827 is noted as a swing high resistance, further indicating a potential point of reversal or resistance in price movement.
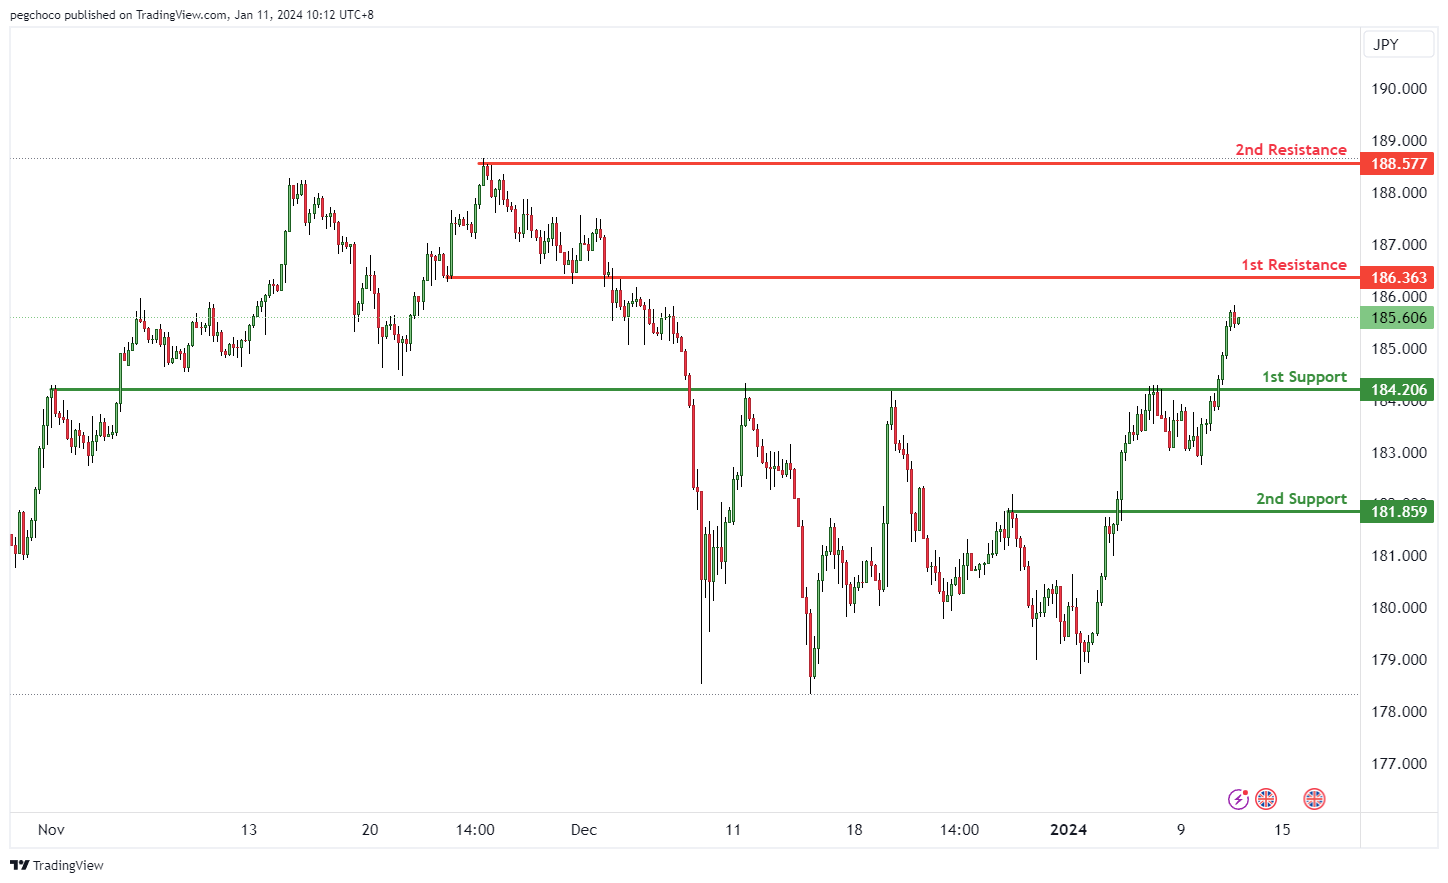
GBP/JPY:
The GBP/JPY (British Pound/Japanese Yen) chart currently demonstrates a bullish overall momentum, suggesting that the British Pound is displaying strength relative to the Japanese Yen.
Traders should be aware of the potential for a bullish continuation towards the 1st resistance level in this market.
The 1st support at 184.20 is considered significant as it aligns with a pullback support level, indicating a potential area where buyers might step in and provide temporary support for the GBP/JPY pair.
A 2nd support level at 181.85 is also identified as a pullback support, further reinforcing its significance as a potential support area.
On the resistance side, the 1st resistance at 186.36 is categorized as an overlap resistance, which could act as a barrier to upward price movement.
The 2nd resistance at 188.57 is described as a swing high resistance, making it another potential area of resistance for the GBP/JPY pair.
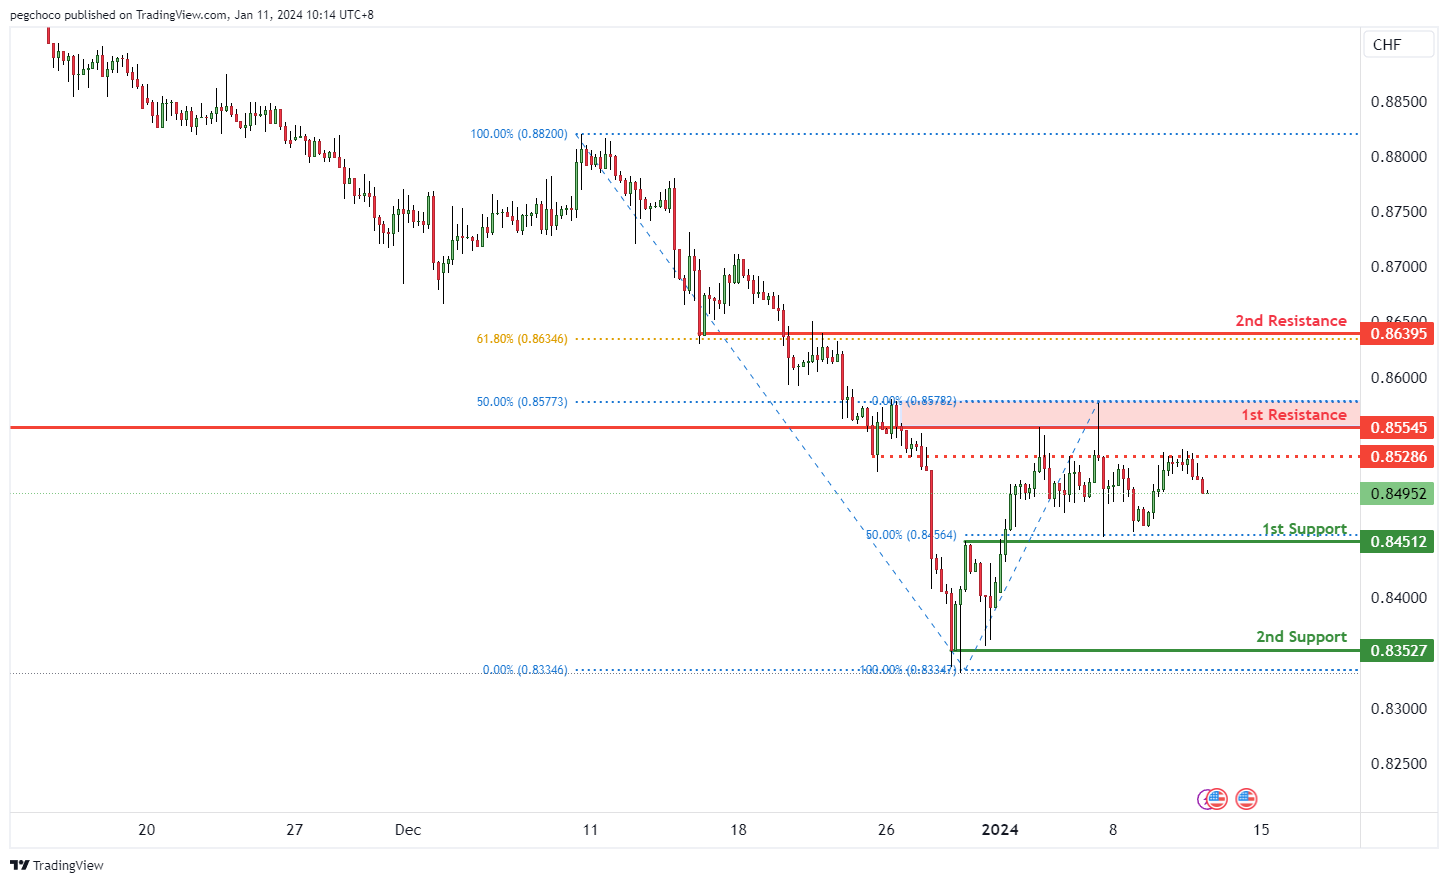
USD/CHF:
The USD/CHF chart currently shows a bearish overall momentum, indicating that the US Dollar is weaker compared to the Swiss Franc.
Price is likely to continue its bearish movement towards the 1st support level.
The 1st support at 0.8451 is significant for several reasons. It is an overlap support and aligns with the 50% Fibonacci Retracement level. This confluence of factors makes it a strong potential support zone, where buying interest may emerge, providing temporary support for the USD/CHF pair.
The 2nd support at 0.8352 is identified as a multi-swing low support, further reinforcing its significance as a potential support area.
On the resistance side, the 1st resistance at 0.8554 is categorized as an overlap resistance, and it coincides with the 50% Fibonacci Retracement level.
The 2nd resistance at 0.8639 is also an overlap resistance and aligns with the 61.80% Fibonacci Retracement level.
An intermediate resistance level at 0.8528 is noted as an overlap resistance as well.
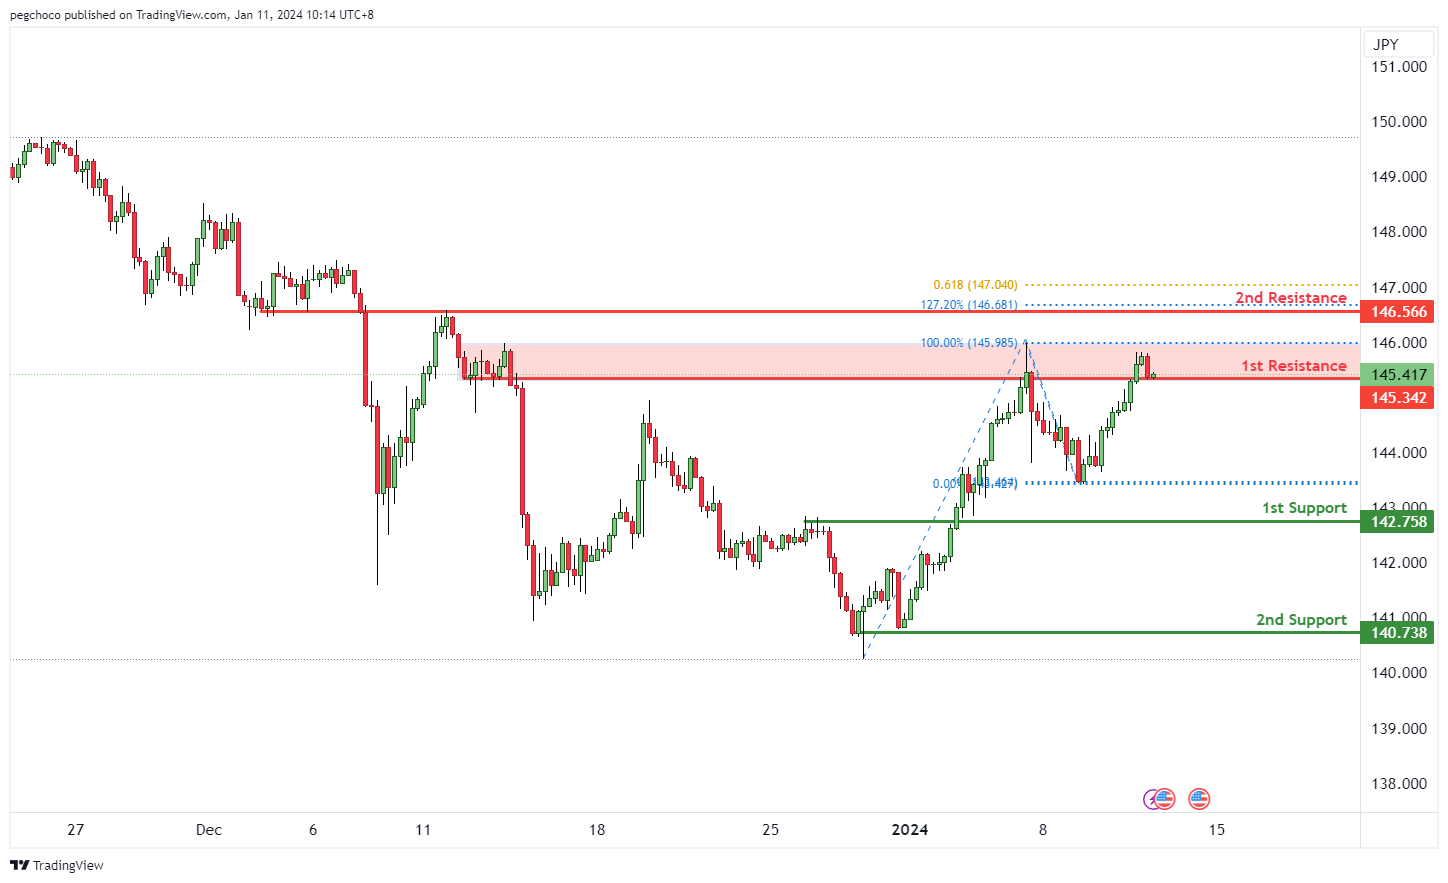
USD/JPY:
The USD/JPY chart is currently displaying a bearish overall momentum, indicating that the US Dollar is weaker relative to the Japanese Yen.
Price is expected to continue its bearish movement towards the 1st support level.
The 1st support at 142.75 is considered significant as it aligns with a pullback support level. This level may attract buying interest, potentially providing temporary support for the USD/JPY pair.
The 2nd support at 140.73 is a multi-swing low support, further strengthening its significance as a potential support area.
On the resistance side, the 1st resistance at 145.34 is categorized as a swing high resistance, often acting as a barrier to upward price movement.
The 2nd resistance at 146.56 is identified as an overlap resistance and coincides with the 127.20% Fibonacci Extension level, making it a potentially strong resistance level.
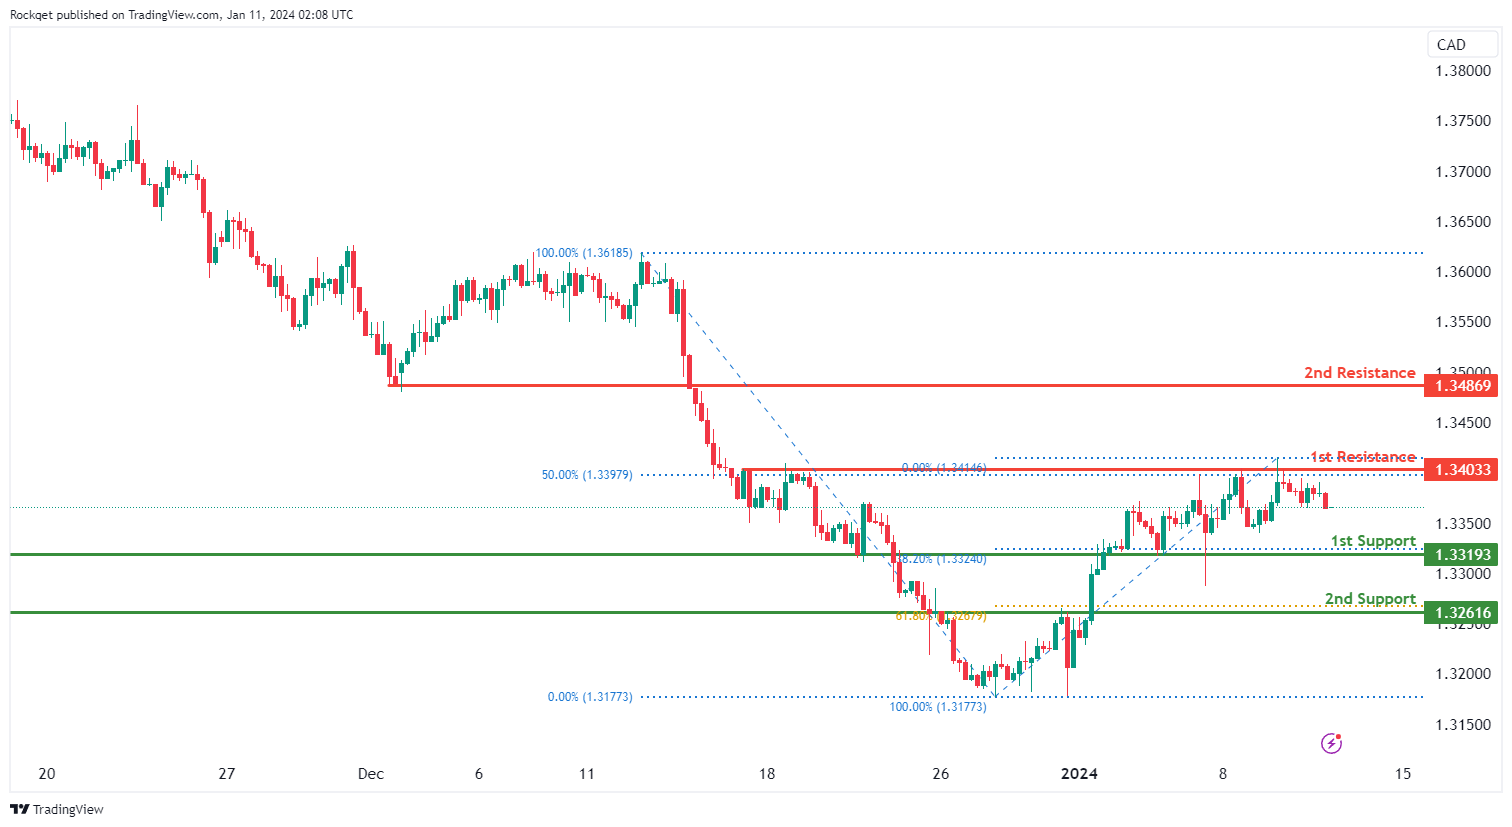
USD/CAD:
The USD/CAD chart currently exhibits an overall bullish momentum. However, there is a potential scenario for price to make a bearish drop towards the 1st support.
The 1st support level at 1.3319 is identified as a pullback support that aligns with the 38.20% Fibonacci retracement level. Further below, the 2nd support level at 1.3261 is marked as an overlap support that aligns with the 61.80% Fibonacci retracement level, further reinforcing its importance as a key support level.
To the upside, the 1st resistance level at 1.3403 is identified as a pullback resistance that aligns with the 50.00% Fibonacci retracement level. Higher up, the 2nd resistance level at 1.3486 is also noted as a pullback resistance, further reinforcing its significance as a potential resistance zone.
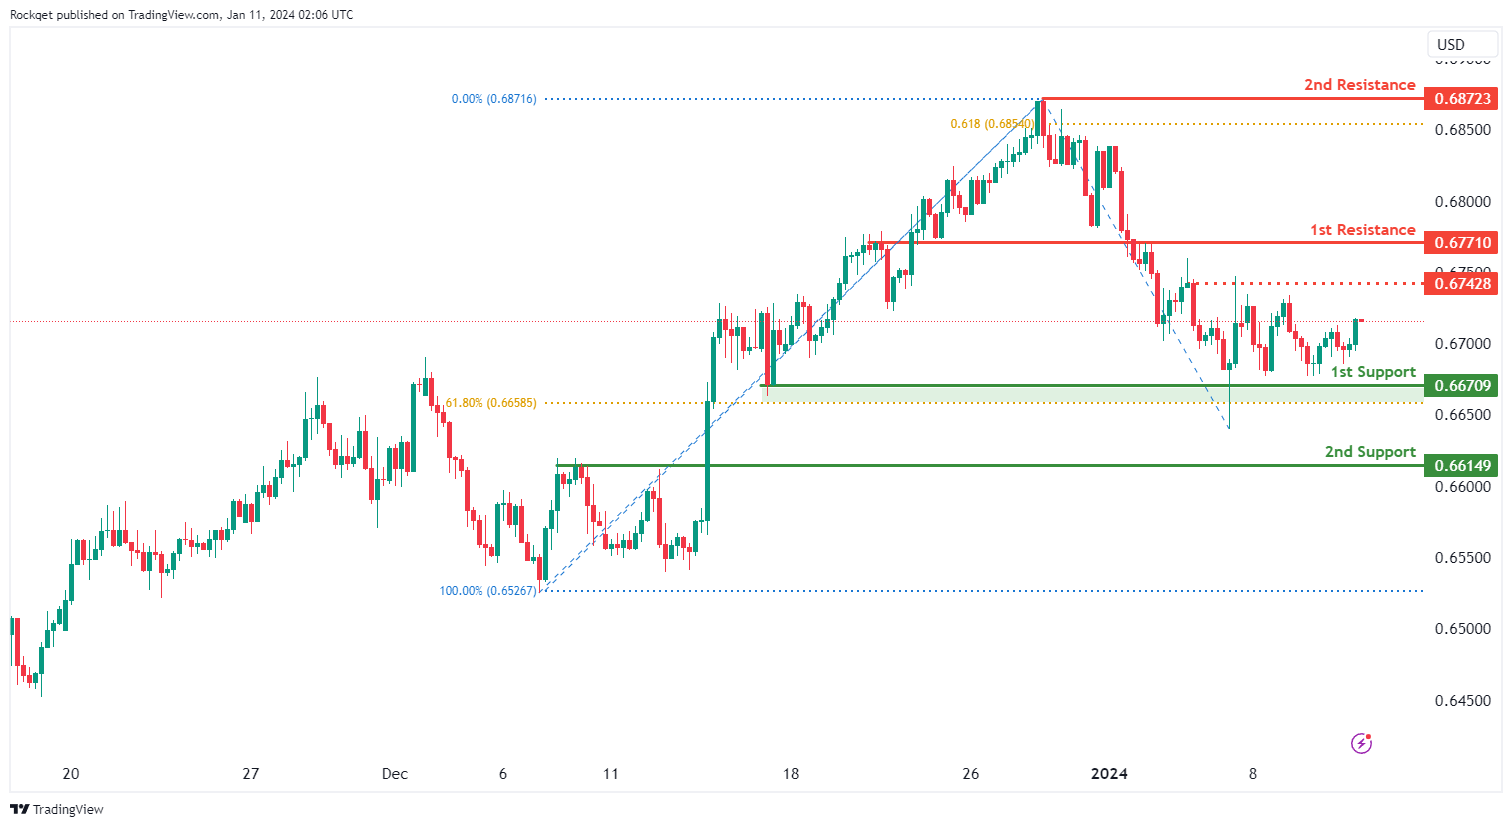
AUD/USD:
The AUD/USD chart currently exhibits a neutral bias. However, there is a potential scenario for price to make a bullish rise towards the 1st resistance should it break above the intermediate resistance.
The intermediate resistance level at 0.6742 is identified as a pullback resistance while the 1st resistance level at 0.6771 is identified as an overlap resistance. Higher up, the 2nd resistance level at 0.6872 is noted as a swing-high resistance that aligns close to the 61.80% Fibonacci projection level, suggesting a potential barrier for further upside movement.
To the downside, the 1st support level at 0.6670 is identified as a pullback support that aligns close to the 61.80% Fibonacci retracement level. Further below, the 2nd support level at 0.6614 is also marked as an pullback support, further reinforcing its importance as a key support level.
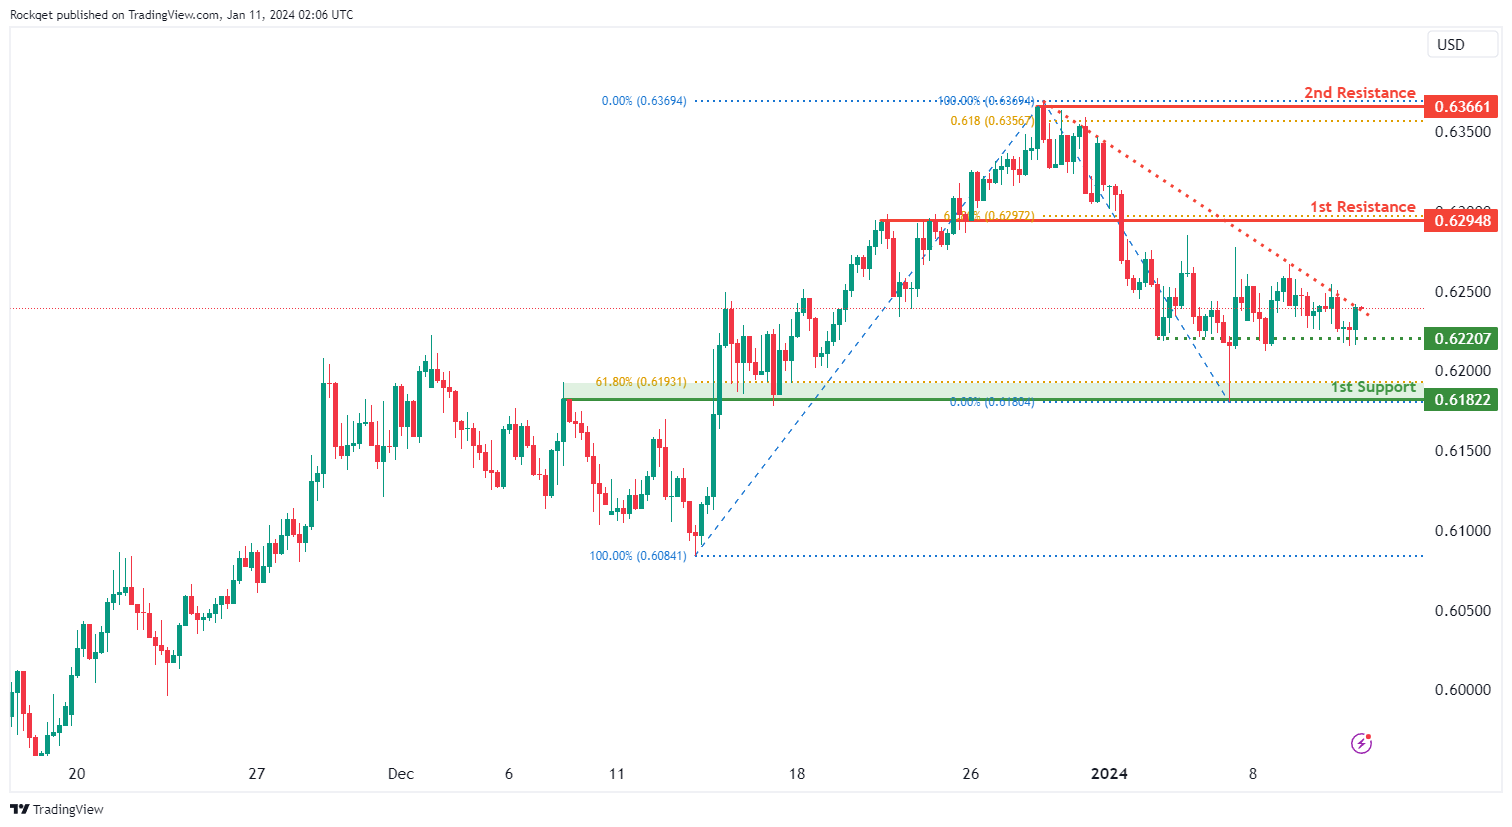
NZD/USD
The NZD/USD chart currently exhibits a neutral bias. However, there is a potential scenario for price to make a bullish rise towards the 1st resistance should it break above the descending trendline.
The 1st resistance level at 0.6294 is identified as an overlap resistance that aligns with the 61.80% Fibonacci retracement level. Higher up, the 2nd resistance level at 0.6366 is noted as a swing-high resistance that aligns close to the 61.80% Fibonacci projection level, suggesting a potential barrier for further upside movement.
To the downside, the intermediate support level at 0.6220 is identified as a pullback support. Further below, the 1st support level at 0.6182 is marked as an overlap support that aligns close to the 61.80% Fibonacci retracement level, further reinforcing its importance as a key support level.
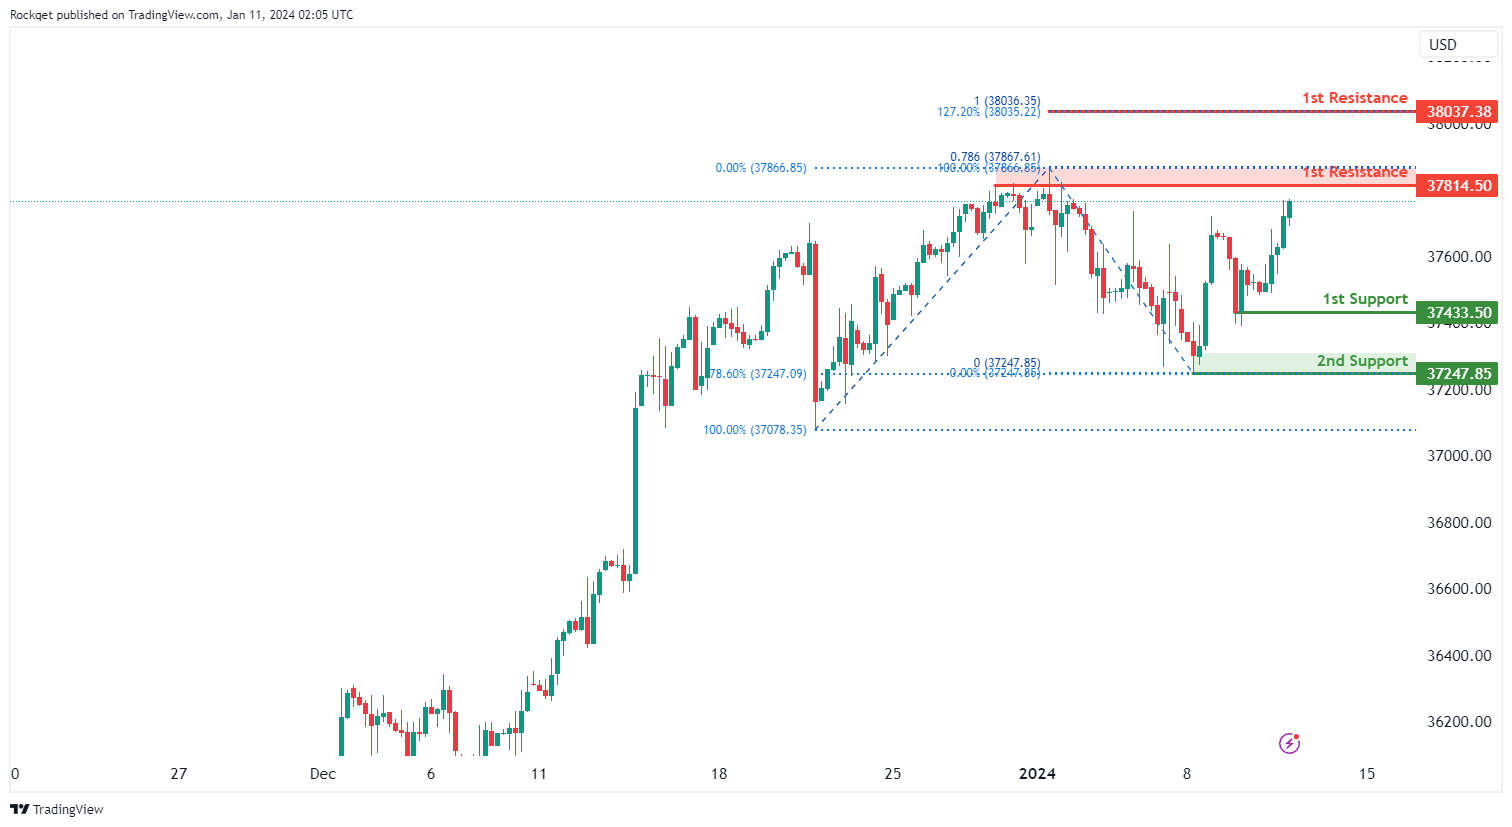
DJ30:
The DJ30 chart currently displays an overall bullish momentum. In this context, there is a potential scenario for price to make a bullish continuation towards the 1st resistance.
The 1st resistance level at 37,814.50 is identified as a pullback resistance that aligns close to the 78.60% Fibonacci projection level. Higher up, the 2nd resistance level at 38,037.38 is recognized as a resistance that aligns with a confluence of Fibonacci levels i.e. the 127.20% extension and the 100.00% projection, adding significance to this potential resistance level.
On the support side, the 1st support level at 37,433.50 is identified as a pullback support. Further below, the 2nd support level at 37,247.85 is also recognized as a pullback support that aligns with the 78.60% Fibonacci retracement level, further adding to its potential as a key support zone.
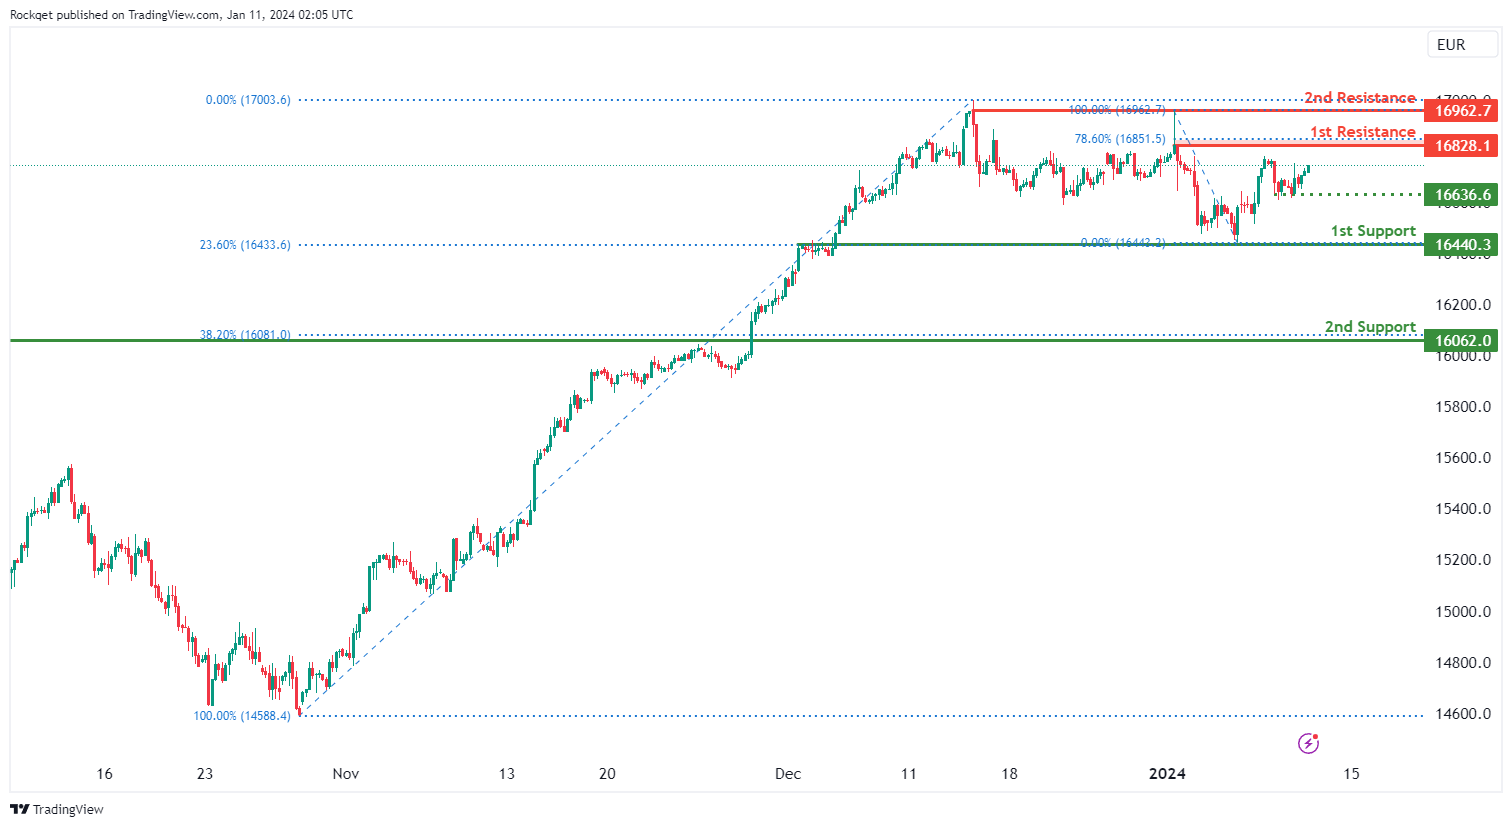
GER40:
The GER40 chart currently displays an overall bullish momentum. In this context, there is a potential scenario for price to make a bullish continuation towards the 1st resistance.
The 1st resistance level at 16,828.10 is identified as a pullback resistance that coincides with the 78.60% Fibonacci retracement level. Higher up, the 2nd resistance level at 16,962.70 is also noted as a pullback resistance, further reinforcing its potential as a barrier to upward movement.
On the support side, the intermediate support level at 16,636.60 is recognized as a pull back support while the 1st support level at 16,440.30 is identified as an overlap support that aligns with the 23.60% Fibonacci retracement level. The 2nd support level at 16,062.00 is recognized as a pullback support that aligns with the 38.20% Fibonacci retracement level, adding to its potential significance as a level of historical importance.
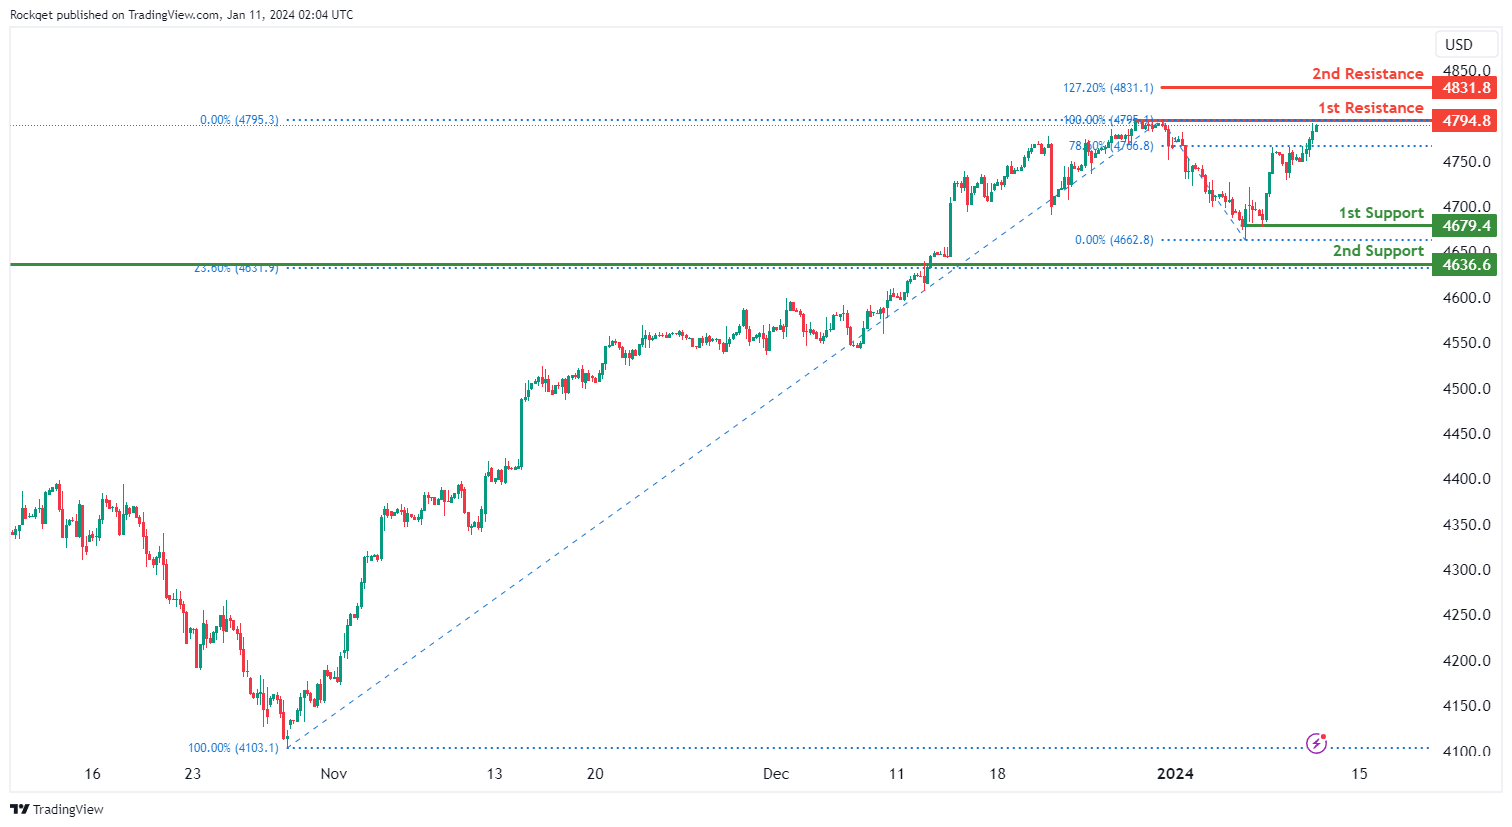
US500:
The US500 chart currently displays an overall bullish momentum. In this context, there is a potential for price to make a bullish continuation towards the 1st resistance.
The 1st resistance level at 4,794.80 is identified as a pullback resistance. Higher up, the 2nd resistance level at 4,831.80 is identified as a resistance that aligns with the 127.20% Fibonacci extension level.
On the support side, the 1st support level at 4,679.40 is identified as a pullback support. Further below, the 2nd support level at 4,636.60 is also recognized as a pullback support that aligns with the 23.60% Fibonacci retracement level, adding to its potential as a support level.
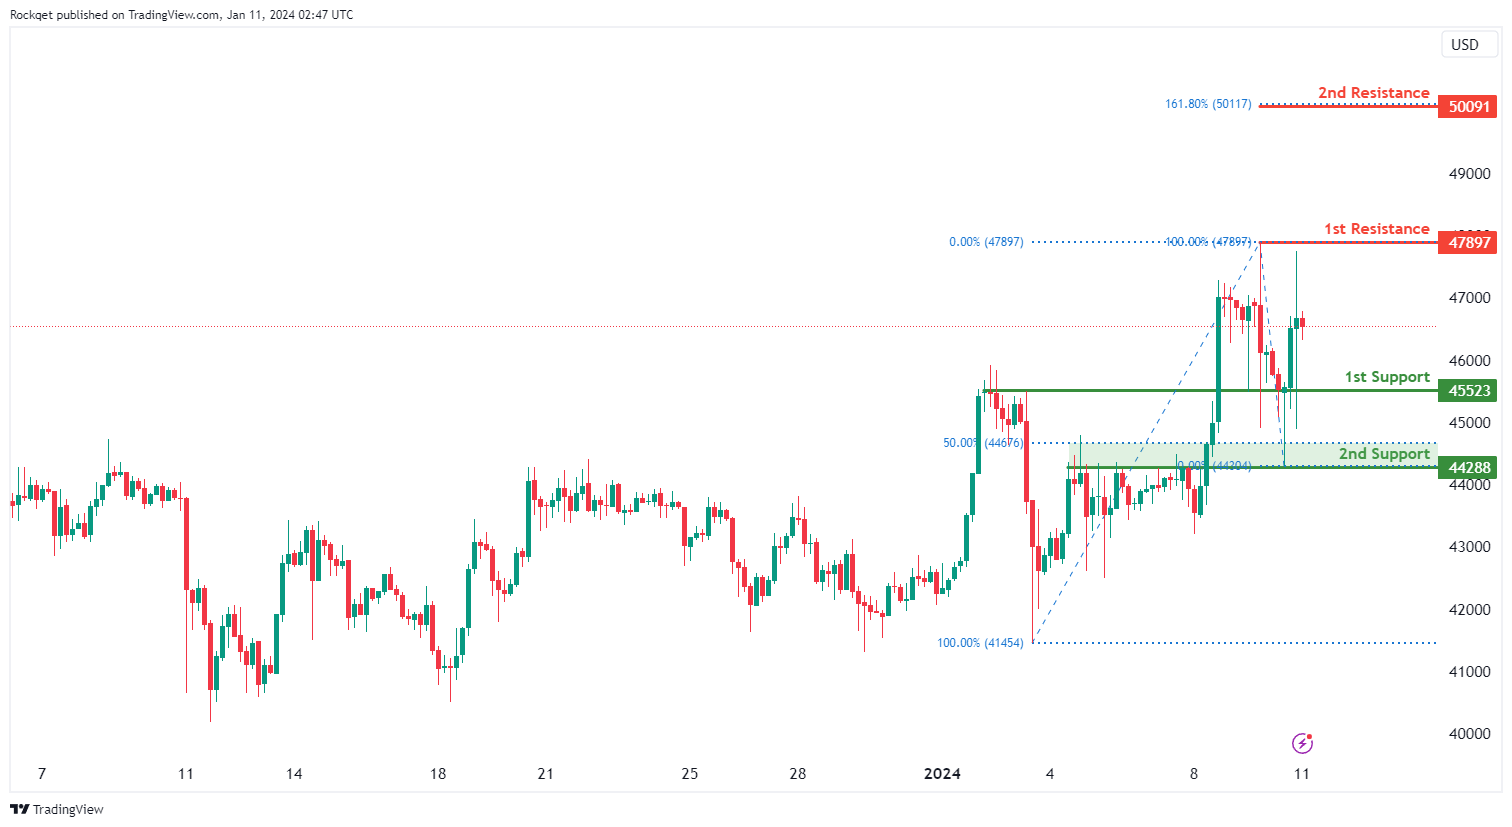
BTC/USD:
The BTC/USD chart currently exhibits a neutral bias, indicating a potential for price to fluctuate between the 1st resistance and the 1st support.
The 1st support level at 45,523 is identified as an overlap support. Further below, the 2nd support level at 44,288 is also recognized as an overlap support that aligns close to the 50.00% Fibonacci retracement level, adding to its potential as a key support.
On the resistance side, the 1st resistance level at 47,897 is identified as a pullback resistance. Higher up, the 2nd resistance level at 50,091 is recognized as a resistance that aligns with the 161.80% Fibonacci extension level, suggesting a level where selling interest could materialize.
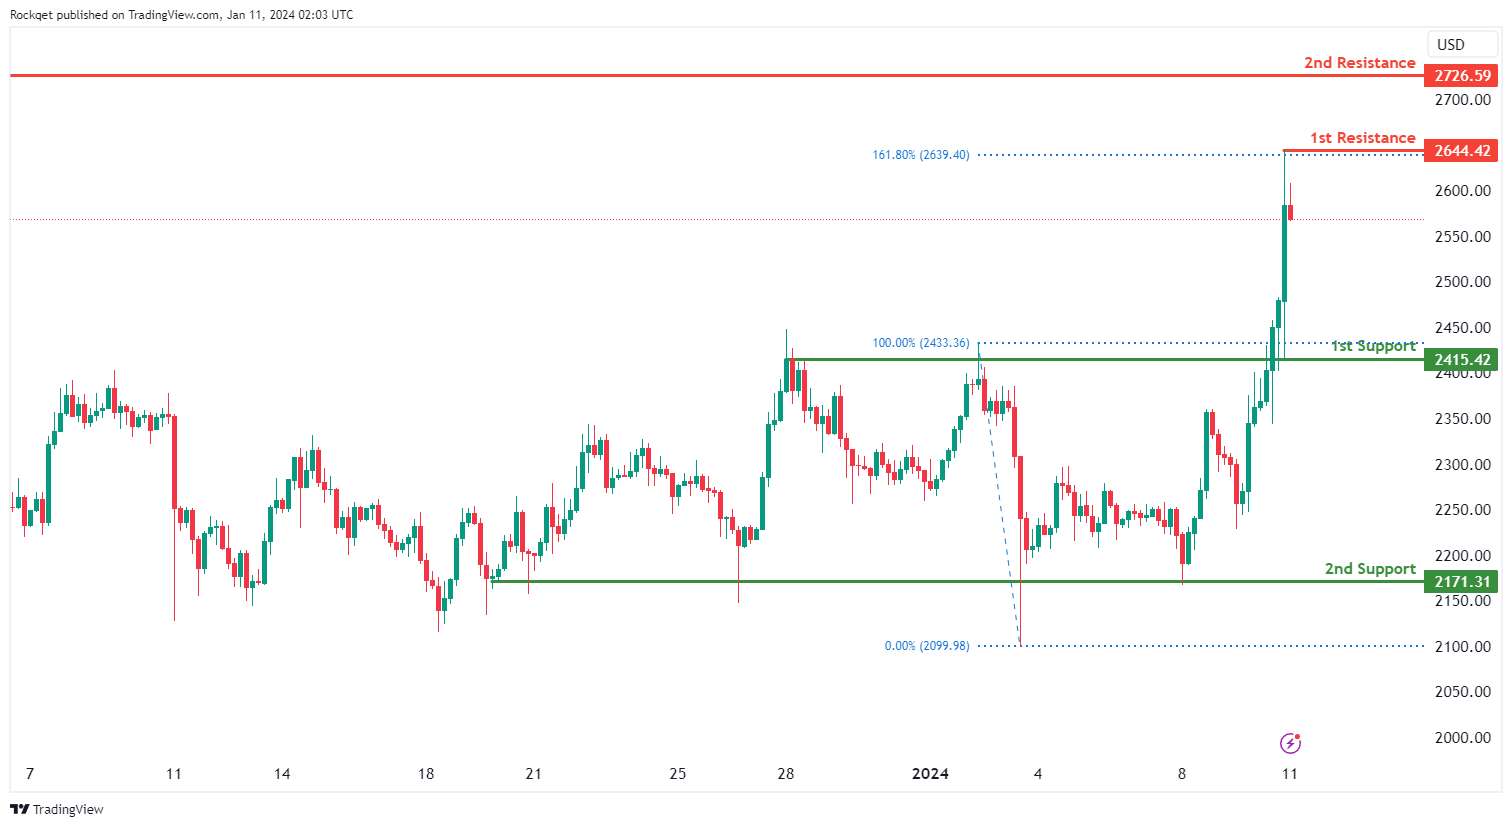
ETH/USD:
The ETH/USD chart currently exhibits an overall bullish momentum. However, there is a potential scenario for price to fall towards the 1st support.
The 1st support level at 2,415.42 is identified as a pullback support. Further below, the 2nd support level at 2,171.31 is recognized as a multi-swing-low support, adding to its potential as a key support.
On the resistance side, the 1st resistance level at 2,644.42 is identified as a pullback resistance that aligns with the 161.80% Fibonacci extension level. Higher up, the 2nd resistance level at 2,726.59 is recognized as a pullback resistance, suggesting a potential barrier for further upside movement.
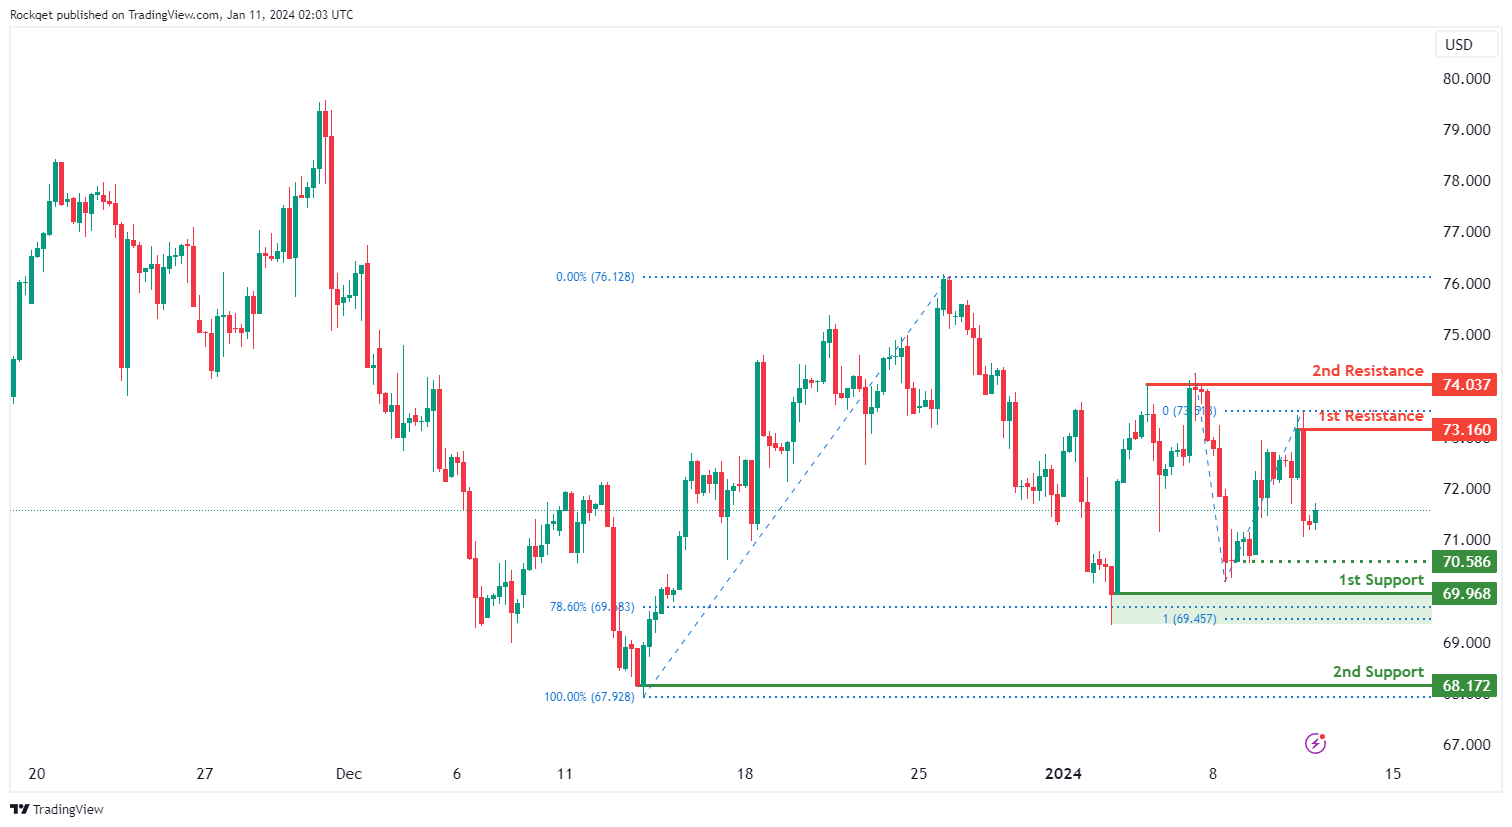
WTI/USD:
The WTI (West Texas Intermediate) chart currently exhibits a neutral bias, indicating a potential for price to fluctuate between the 1st resistance and the 1st support.
The 1st resistance level at 73.16 is identified as a pullback resistance. Higher up, the 2nd resistance level at 74.03 is also noted as a pullback resistance, suggesting a potential barrier for further upside movement.
To the downside, the intermediate support level at 70.58 is identified as a pullback support while the 1st support level at 69.96 is noted as a swing-low support that aligns close to a confluence of Fibonacci levels i.e. the 78.60% retracement and the 100.00% projection. Further below, the 2nd support level at 68.17 is also marked as a swing-low support, further reinforcing its importance as a key support level.
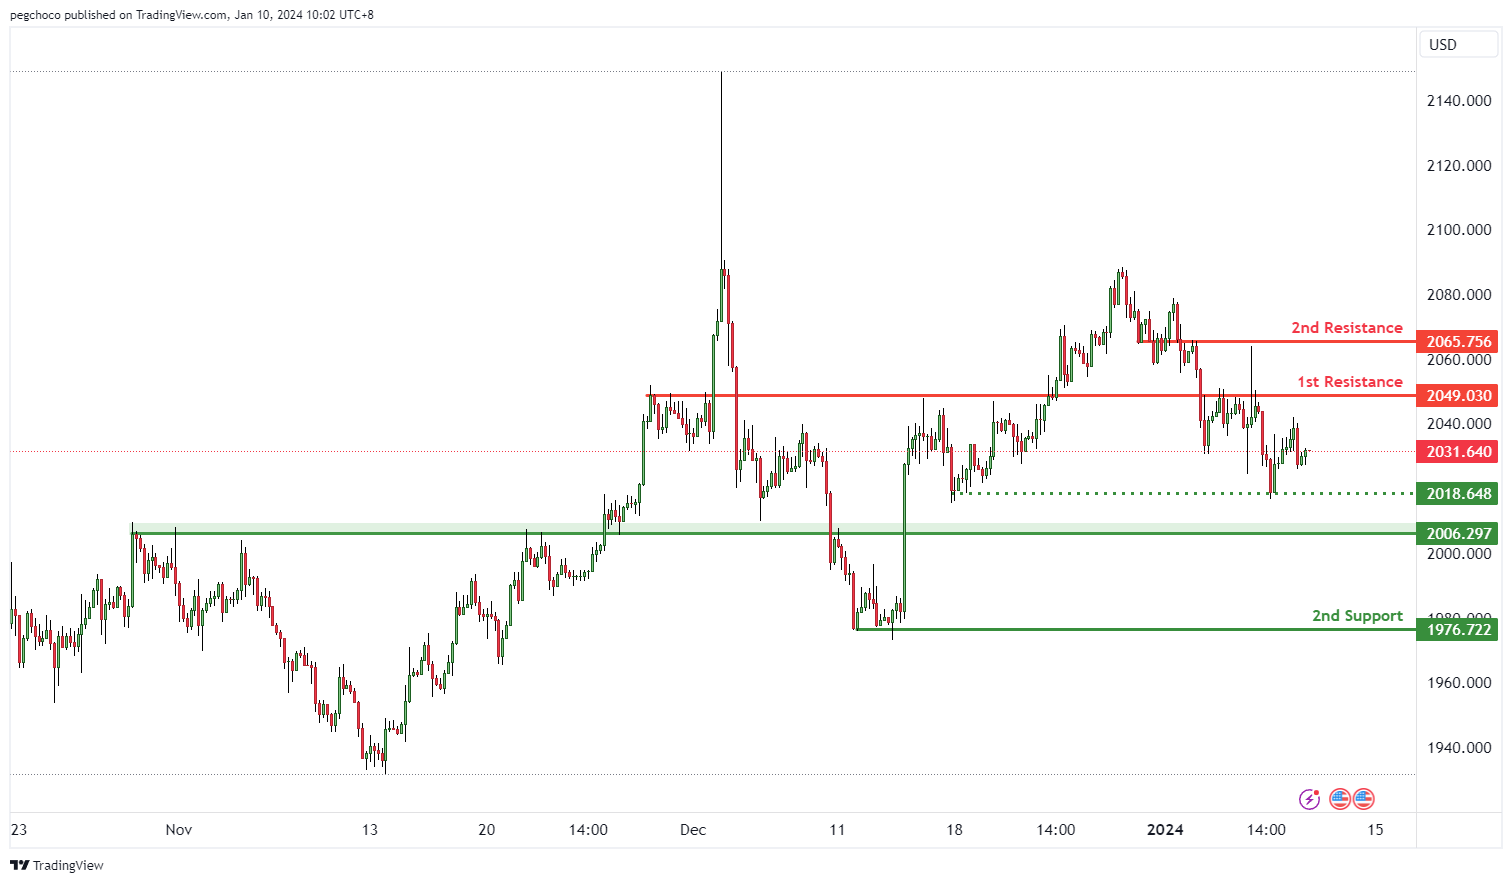
XAU/USD (GOLD):
The XAU/USD (Gold/US Dollar) chart currently exhibits a bullish overall momentum, indicating that Gold is showing strength relative to the US Dollar.
Price is anticipated to continue its bullish movement towards the 1st resistance level.
The 1st support at 2006.29 is considered significant as it aligns with a pullback support level. This level may act as a potential area for buyers to step in and provide temporary support for the XAU/USD pair.
An intermediate support level at 2017.00 is also noteworthy, as it aligns with a multi-swing low support, adding to its significance.
On the resistance side, the 1st resistance at 2049.03 is categorized as an overlap resistance, which can serve as a barrier to upward price movement.
The 2nd resistance at 2065.75 is identified as another overlap resistance, indicating a potential area of resistance for the XAU/USD pair.
An intermediate resistance level at 2038.44 is also present, further reinforcing the potential resistance zone.


