
DXY:
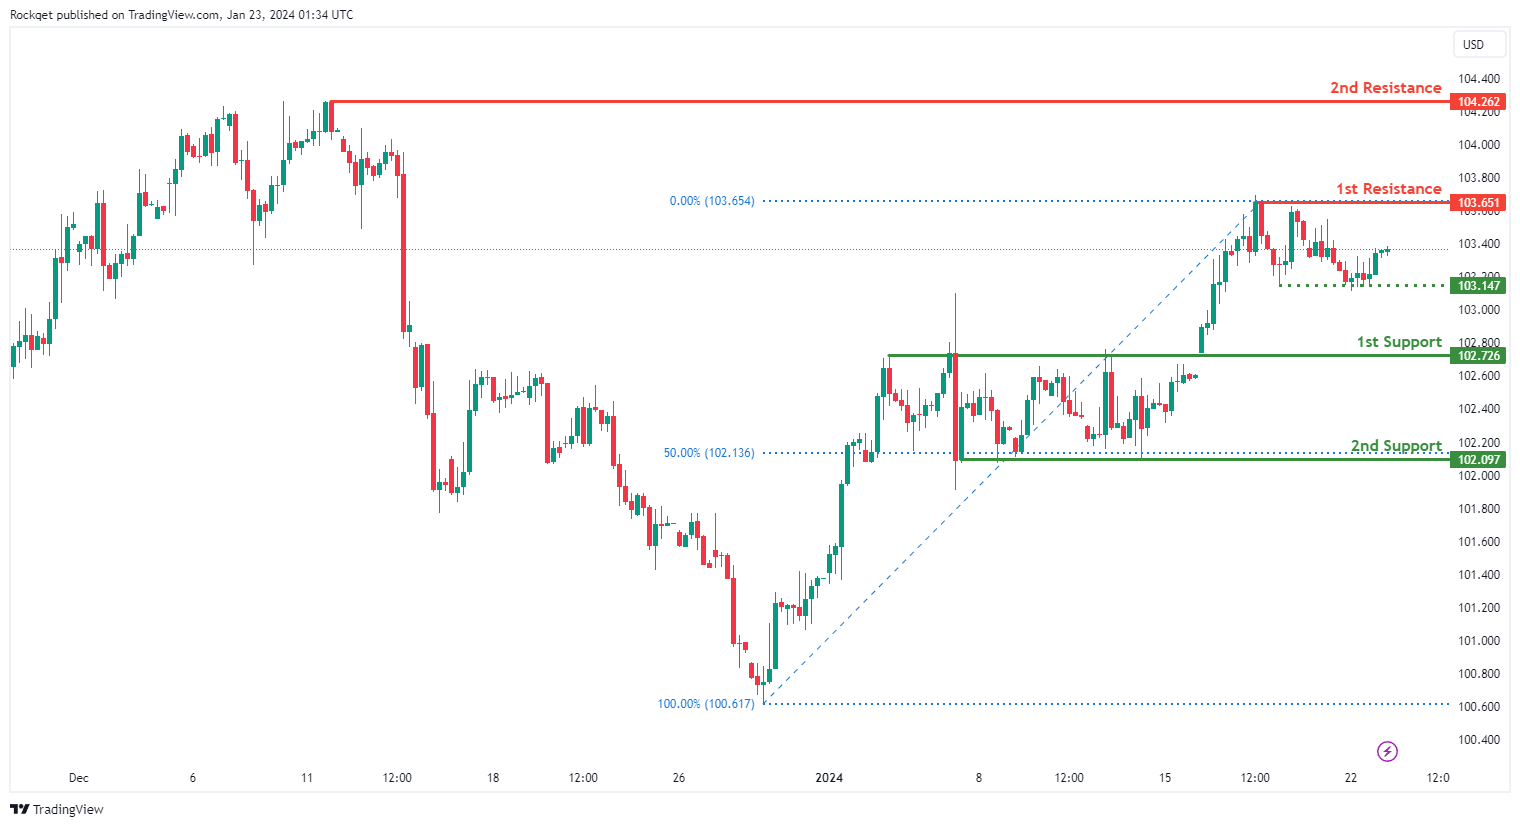
The DXY (US Dollar Index) chart currently exhibits an overall bullish momentum. In this context, there is a potential scenario for price to fall towards the intermediate support before resuming the uptrend towards the 1st resistance.
The intermediate support level at 103.14 is identified as a pullback support while the 1st support at 102.72 is also noted as a pullback support. Further below, the 2nd support level at 102.09 is also marked as a pullback support that aligns with the 50.00% Fibonacci retracement level, reinforcing this level as a key support area.
On the resistance side, the 1st resistance level at 103.65 is recognized as a pullback resistance. Higher up, the 2nd resistance level at 104.26 is also identified as a pullback resistance, highlighting its potential as a significant resistance zone.
EUR/USD:
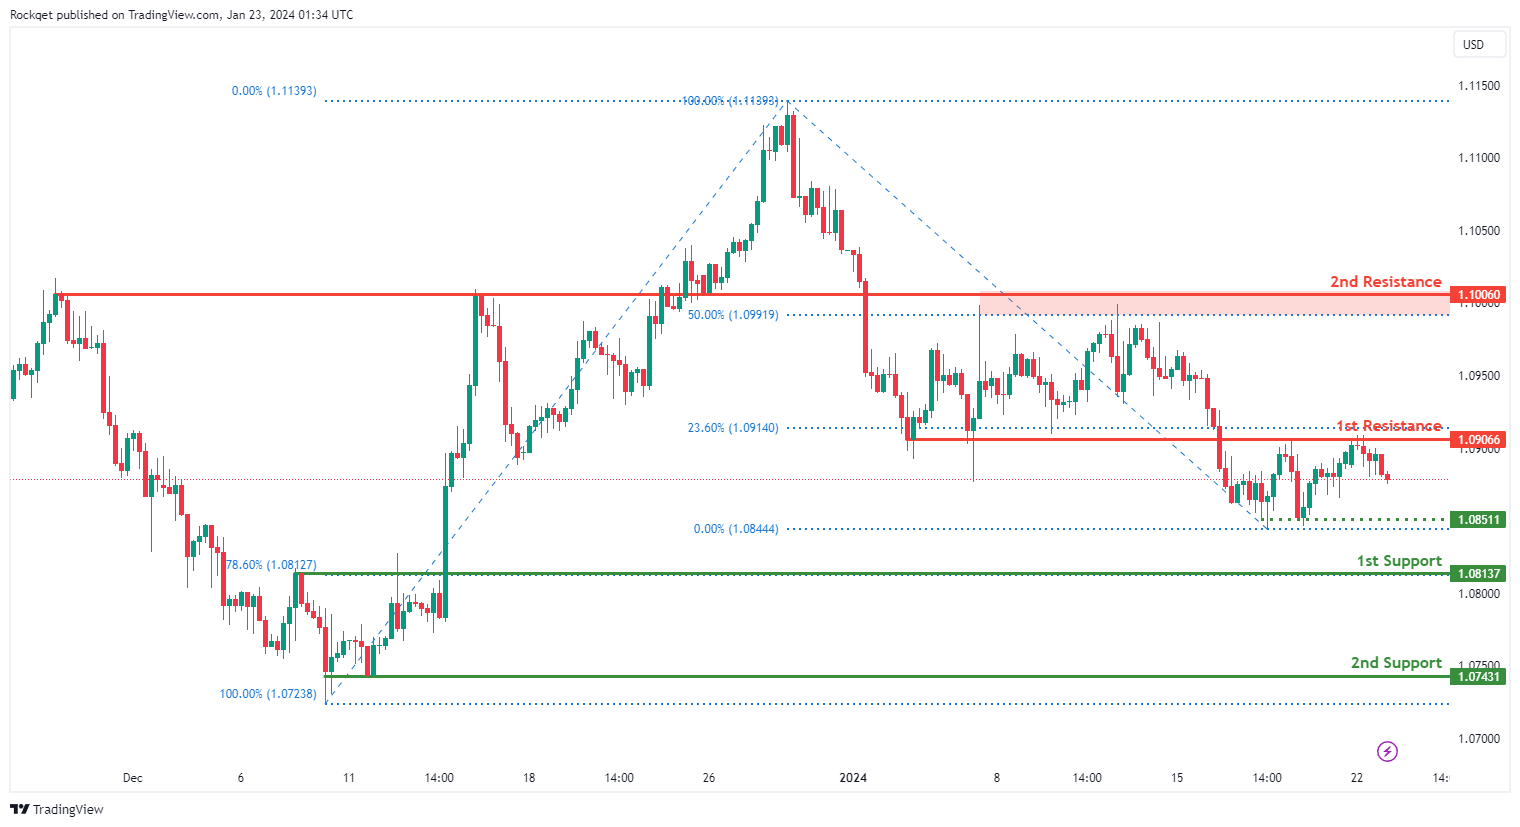
The EUR/USD chart currently exhibits an overall bearish momentum. In this context, there is a potential scenario for price to retrace higher towards the 1st resistance before resuming the downtrend.
The 1st resistance level at 1.0906 is identified as an overlap resistance that aligns close to the 23.60% Fibonacci retracement level. Higher up, the 2nd resistance level at 1.1006 is also noted as an overlap resistance that aligns close to the 50.00% Fibonacci retracement level, suggesting a potential barrier for further upside movement.
To the downside, the intermediate support level at 1.0851 is identified as a pullback support while the 1st support level at 1.0813 is also noted as a pullback support that aligns with the 78.60% Fibonacci retracement level. Further below, the 2nd support level at 1.0743 is marked as a swing-low support, further reinforcing its importance as a key support level.
EUR/JPY:
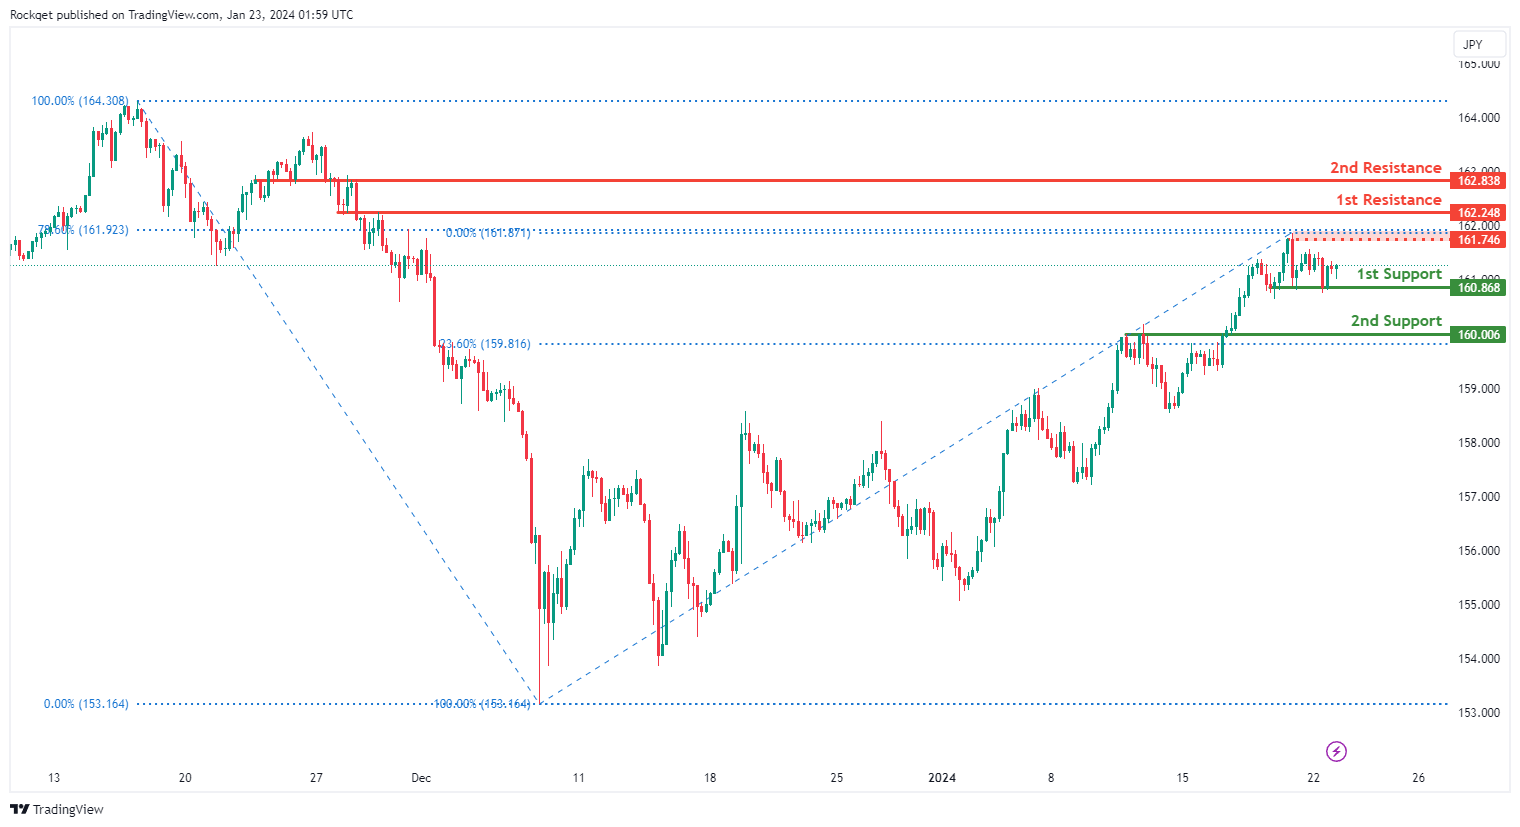
The EUR/JPY chart currently shows a bearish overall momentum, indicating a downward trend direction. There is a potential scenario where the price could continue its bearish movement towards the 1st support level.
The 1st support at 160.87 is considered favorable as it aligns with multiple swing lows, suggesting a historical level where buying interest has previously emerged. Additionally, the 2nd support at 160.01 is identified as an overlap support and coincides with the 23.60% Fibonacci Retracement, adding confluence to its potential as a support level.
On the resistance side, the 1st resistance at 162.25 is recognized as an overlap resistance, indicating a historical level where selling interest has been present. The 2nd resistance at 162.84 is also acknowledged as an overlap resistance.
Furthermore, an intermediate resistance level at 161.75 is identified, marked by a swing high resistance and the 78.60% Fibonacci Retracement. This level adds additional strength to the potential resistance zone.
EUR/GBP:
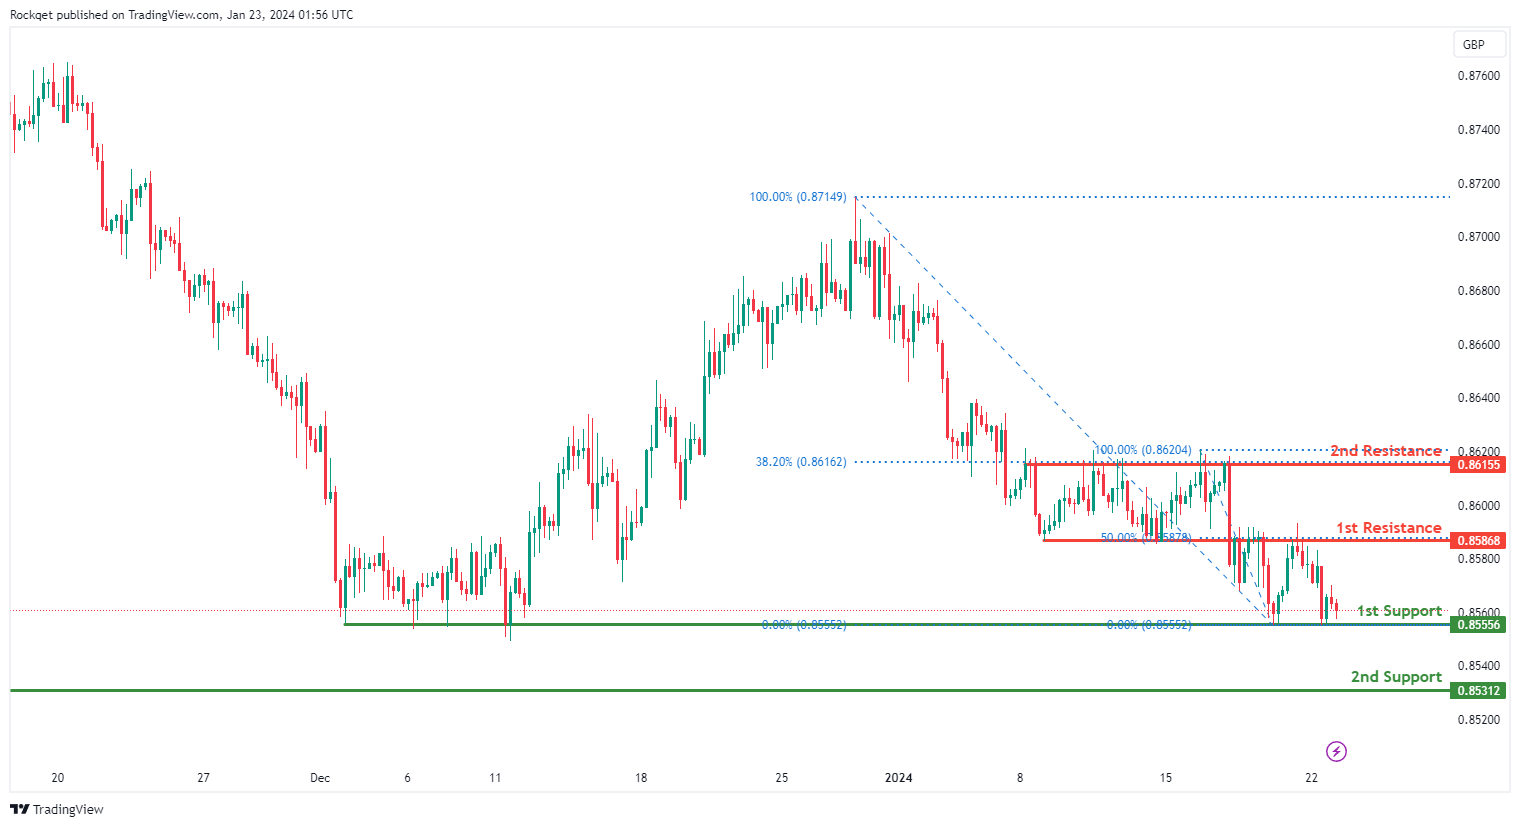
The EUR/GBP chart currently demonstrates a bullish overall momentum, indicating a positive trend direction. In the short term, there is a potential scenario where the price could experience a drop to the 1st support level before bouncing from there and subsequently rising towards the 1st resistance.
The 1st support at 0.8556 is considered a favorable level due to its identification as a swing low support, suggesting historical significance as a level where buying interest has previously emerged. Additionally, the 2nd support at 0.8531 is recognized as a multi-swing low support, providing additional strength to the support zone.
On the resistance side, the 1st resistance at 0.8587 is identified as an overlap resistance and corresponds to the 50% Fibonacci Retracement. This confluence of technical factors adds strength to the potential resistance level. Furthermore, the 2nd resistance at 0.8616 is acknowledged as a multi-swing high resistance and aligns with the 38.20% Fibonacci Retracement, adding significance to this potential resistance zone.
GBP/USD:
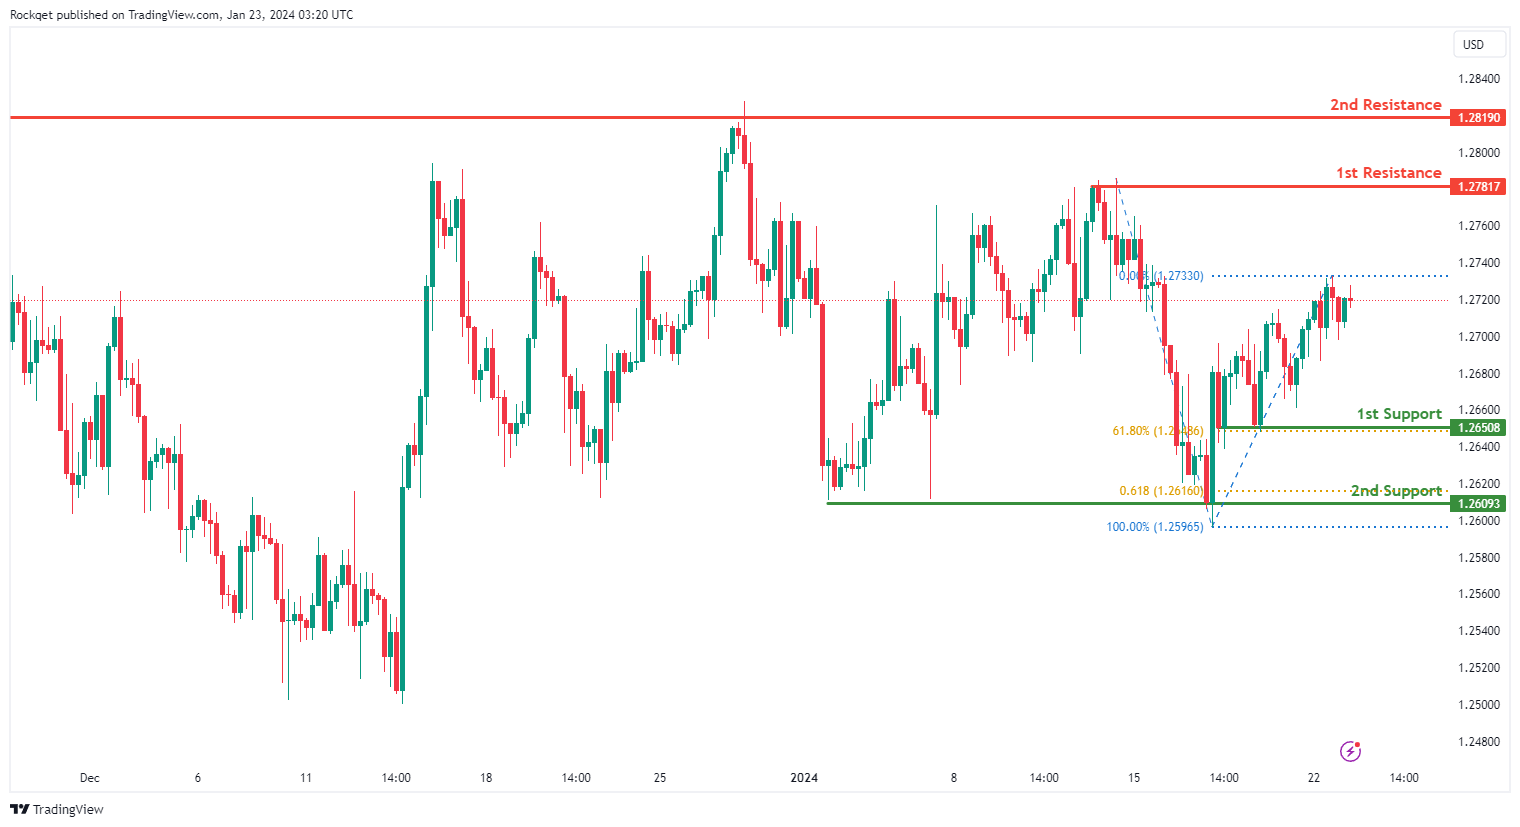
The GBP/USD chart currently exhibits a neutral bias. In this context, there is a potential scenario for price to fluctuate between the 1st resistance and the 1st support.
The 1st support level at 1.2650 is identified as a pullback support that aligns with the 61.80% Fibonacci retracement level. Further below, the 2nd support level at 1.2609 is noted as a multi-swing-low support that aligns with the 61.80% Fibonacci projection level, reinforcing its potential as a key support level.
On the resistance side, the 1st resistance level at 1.2781 is recognized as a swing-high resistance. Higher up, the 2nd resistance level at 1.2819 is marked as a multi-swing-high resistance, reinforcing its significance as a potential resistance zone.
GBP/JPY:
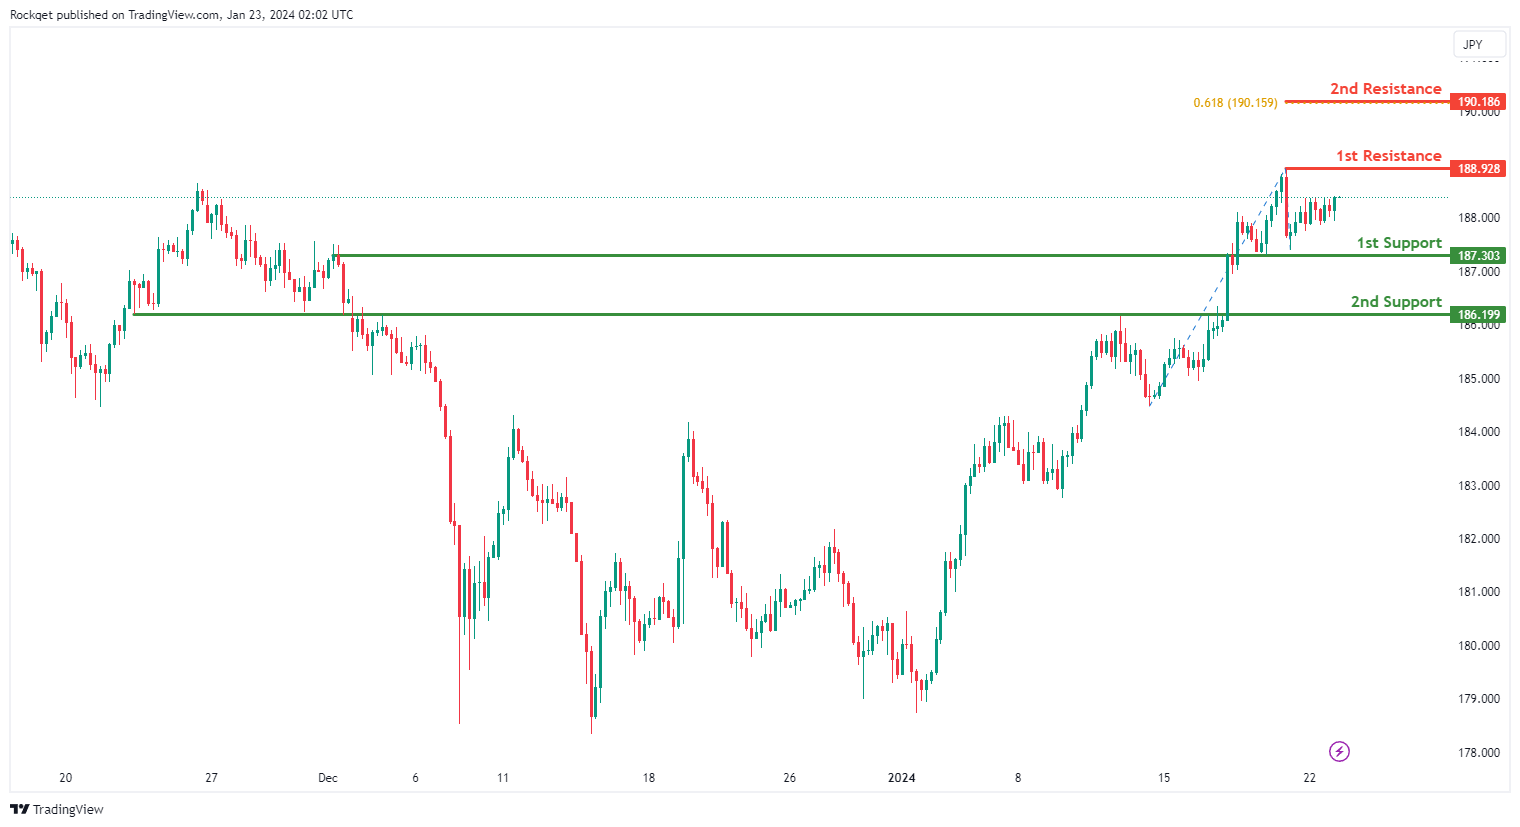
The GBP/JPY chart currently exhibits a bullish overall momentum, indicating a positive trend direction. There is a potential scenario where the price could continue its bullish movement towards the 1st resistance.
The 1st support at 187.30 is considered favorable due to its identification as an overlap support, suggesting historical significance as a level where buying interest has previously emerged. Additionally, the 2nd support at 186.20 is recognized as another overlap support, providing additional strength to the support zone.
On the resistance side, the 1st resistance at 188.93 is identified as a swing high resistance, marking a level where selling interest has been historically observed. Furthermore, the 2nd resistance at 190.19 is noteworthy for the presence of the 61.80% Fibonacci Projection, adding significance to this potential resistance level.
USD/CHF:
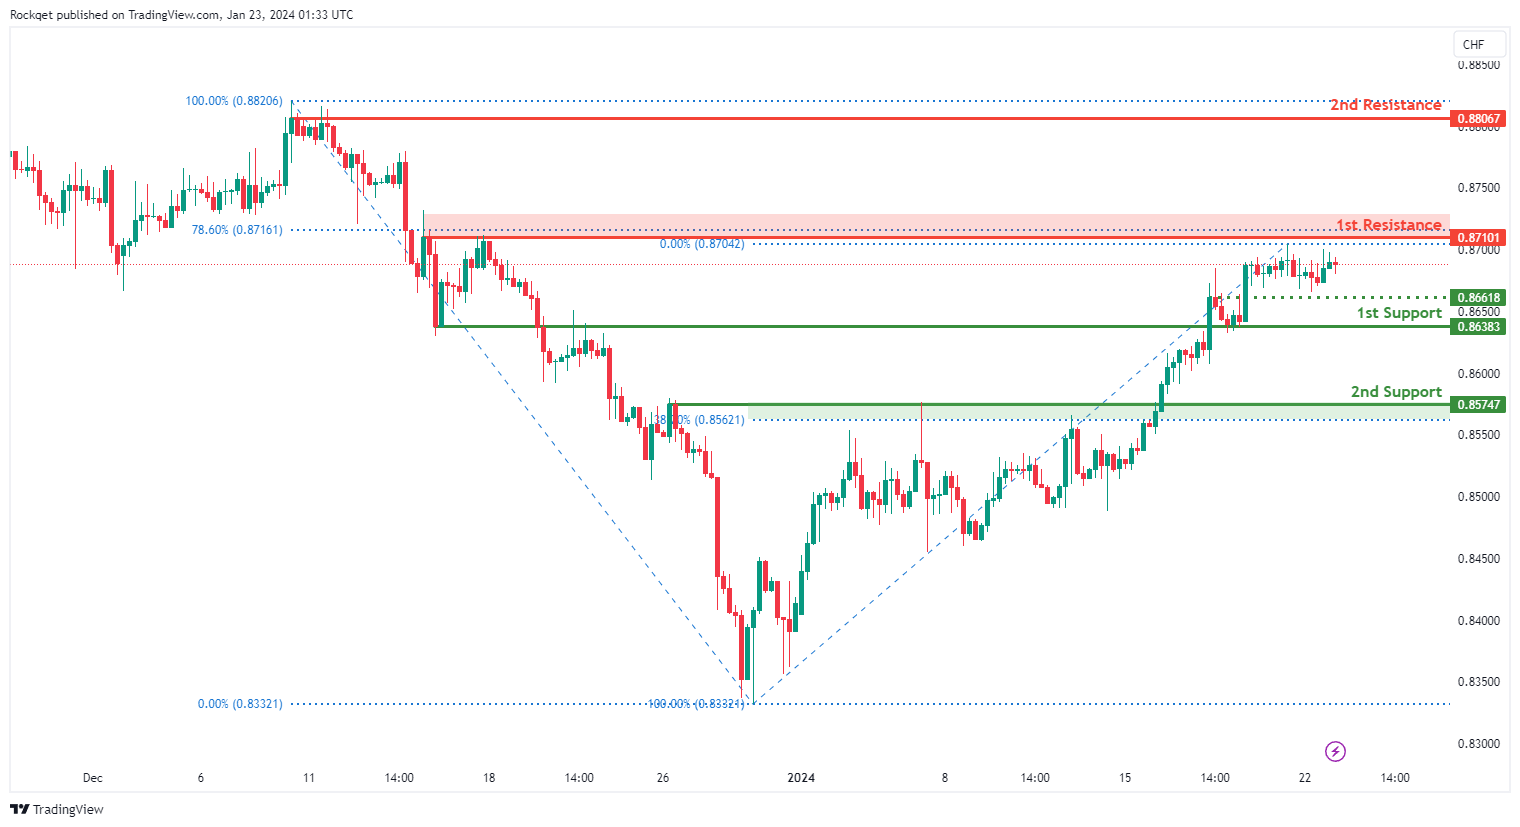
The USD/CHF chart currently exhibits an overall bullish momentum. In this context, there is a potential scenario for price to rise towards the 1st resistance.
The 1st resistance level at 0.8710 is identified as a pullback resistance that aligns with the 78.60% Fibonacci retracement level. Higher up, the 2nd resistance level at 0.8806 is also noted as a pullback resistance, further reinforcing its significance as a potential resistance zone.
To the downside, the intermediate support level at 0.8661 is identified as an overlap support while the 1st support level at 0.8638 is also noted as an overlap support. Further below, the 2nd support level at 0.8574 is marked as a pullback support that aligns close to the 38.20% Fibonacci retracement level, further reinforcing its importance as a key support level.
USD/JPY:
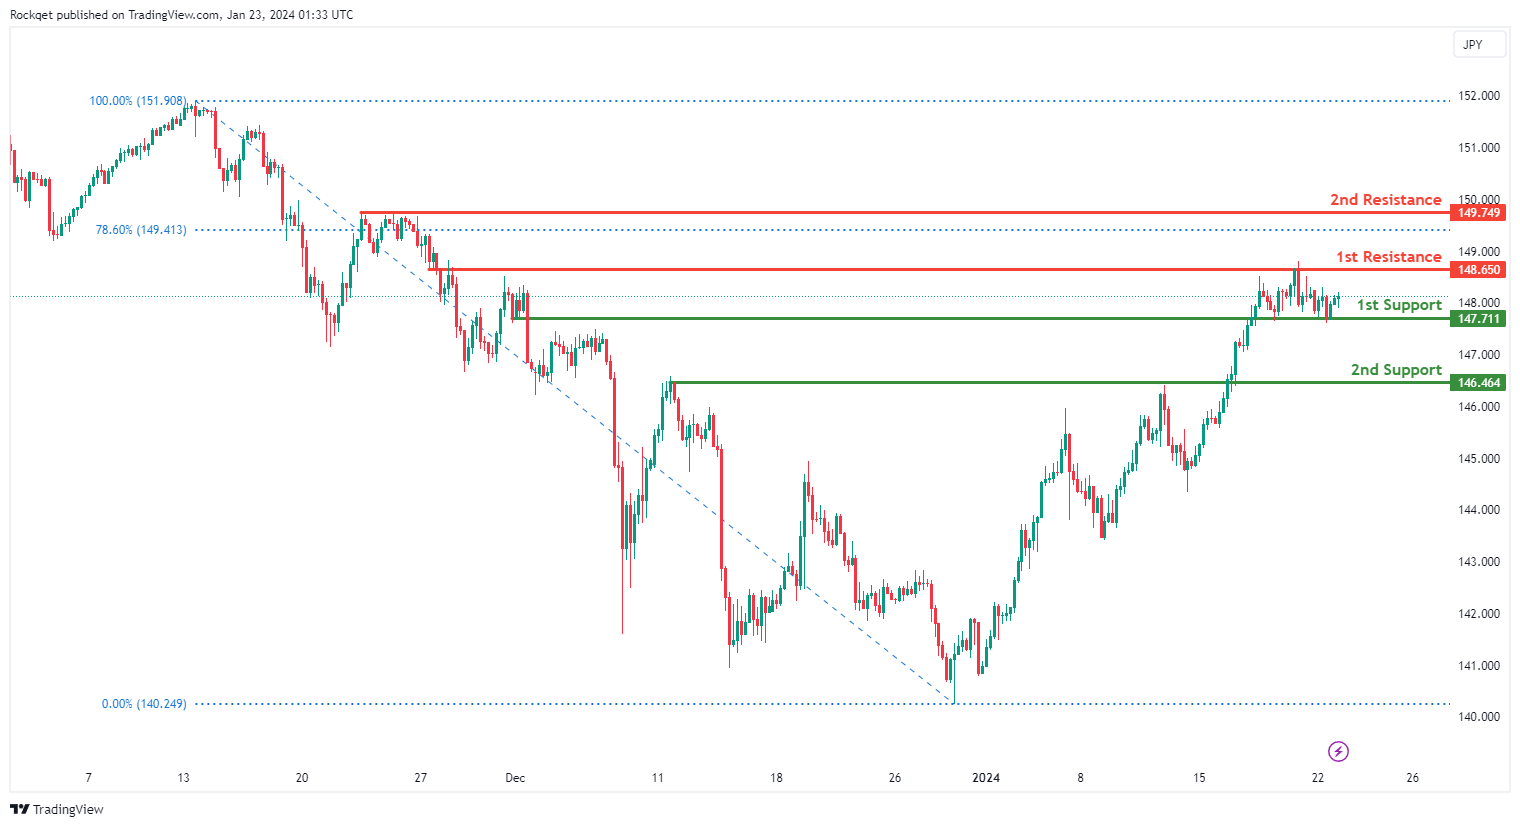
The USD/JPY chart currently exhibits an overall bullish momentum. In this context, there is a potential scenario for price to rise towards the 1st resistance.
The 1st resistance level at 148.65 is identified as an overlap resistance. Higher up, the 2nd resistance level at 149.74 is noted as a pullback resistance that aligns close to the 78.60% Fibonacci retracement level, further reinforcing its significance as a potential resistance zone.
To the downside, the 1st support level at 147.71 is identified as a pullback support. Further below, the 2nd support level at 146.46 is also marked as a pullback support, further reinforcing its importance as a key support level.
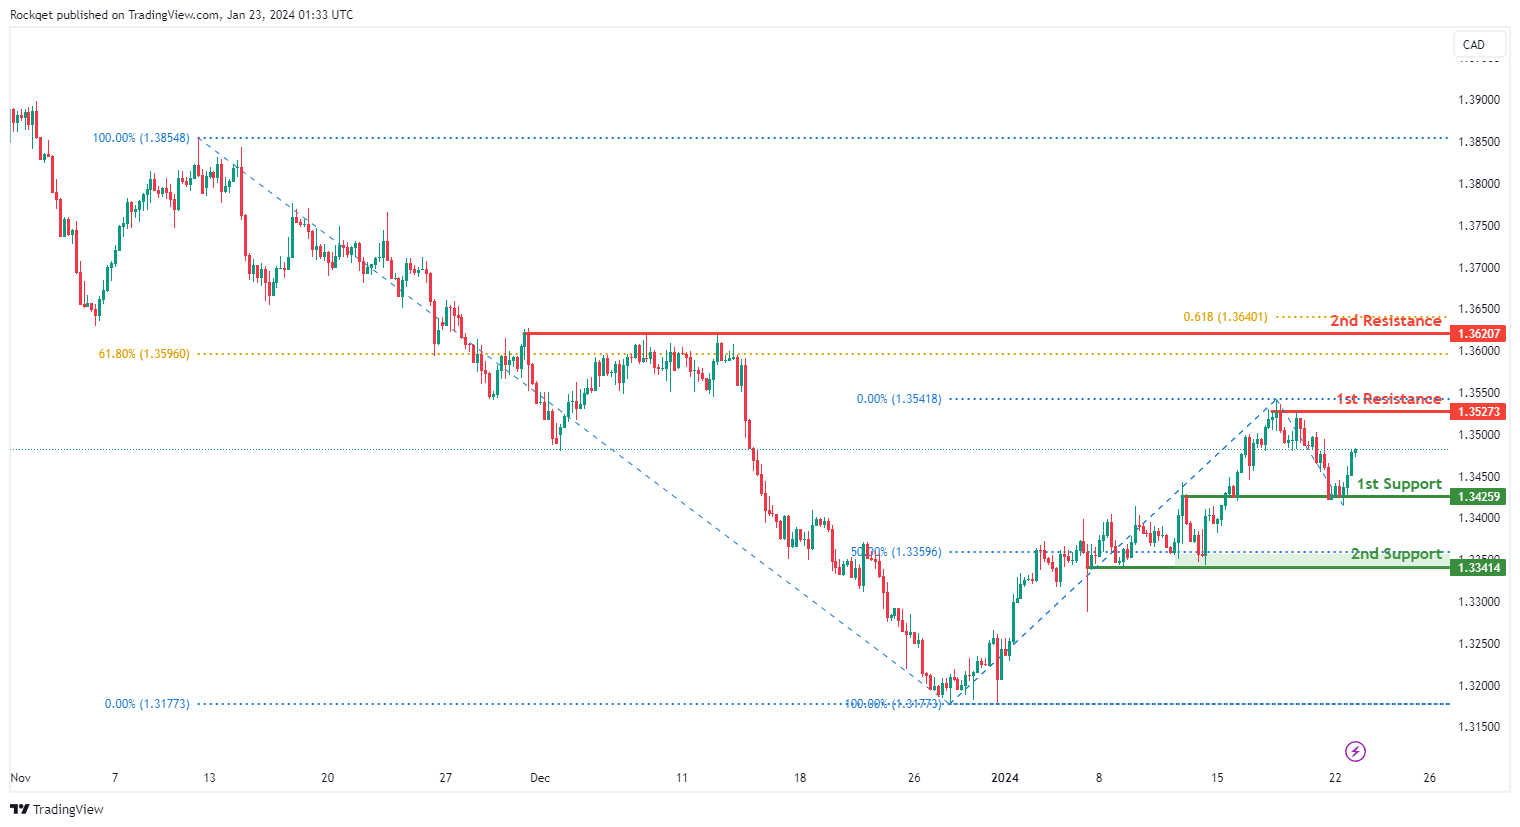
USD/CAD:
The USD/CAD chart currently exhibits an overall bullish momentum. In this context, there is a potential scenario for price to rise towards the 1st resistance.
The 1st resistance level at 1.3527 is identified as a pullback resistance. Higher up, the 2nd resistance level at 1.3620 is also noted as a pullback resistance that aligns close to a confluence of Fibonacci levels i.e. the 61.80% retracement and the 61.80% projection, further reinforcing its significance as a potential resistance zone.
To the downside, the 1st support level at 1.3425 is identified as an overlap support. Further below, the 2nd support level at 1.3341 is marked as a pullback support that aligns close to the 50.00% Fibonacci retracement level, further reinforcing its importance as a key support level.
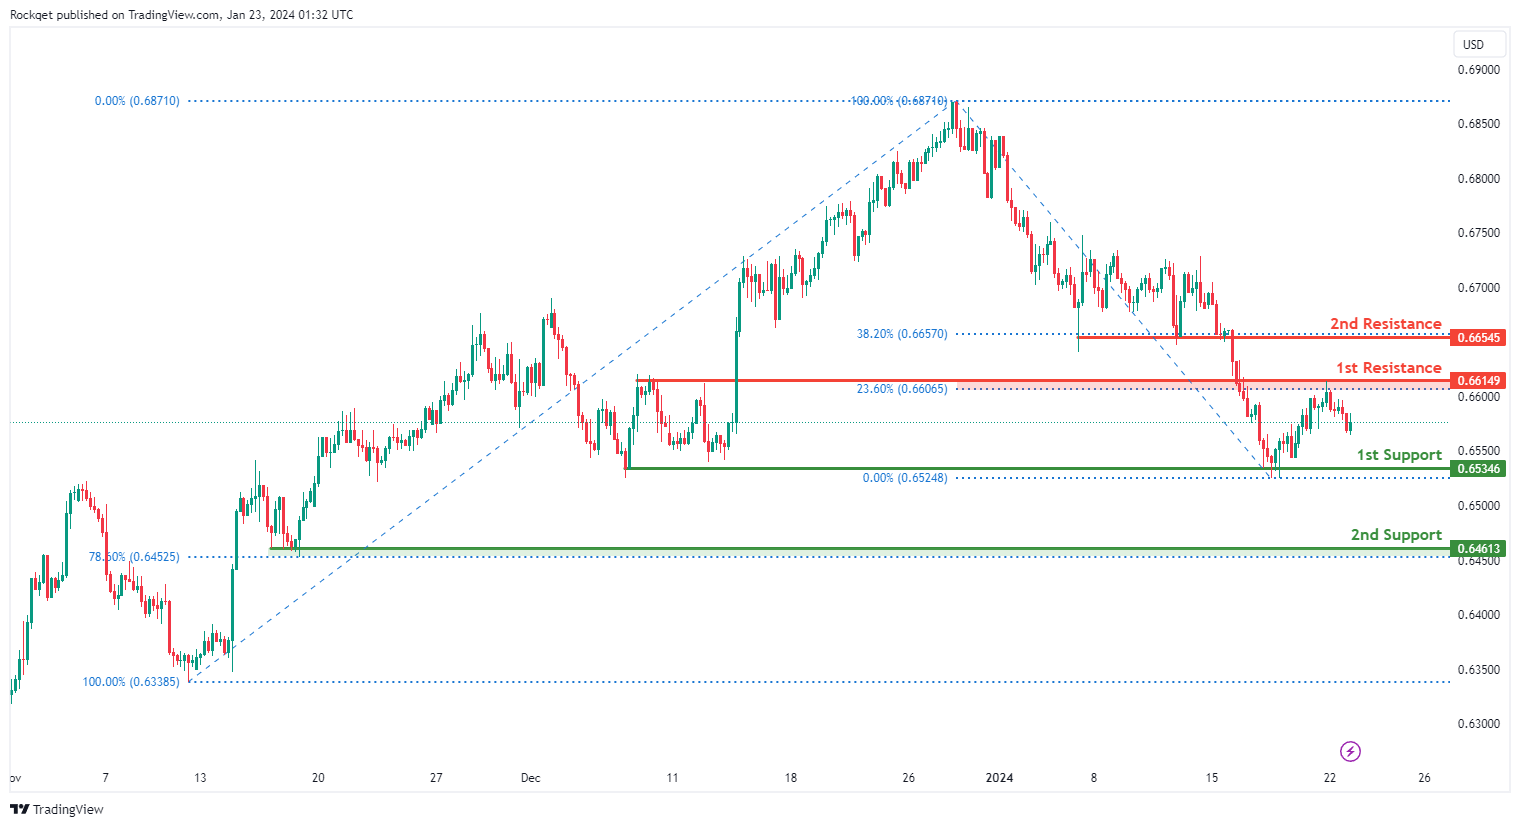
AUD/USD:
The AUD/USD chart currently exhibits an overall bearish momentum. In this context, there is a potential scenario for price to retrace higher towards the 1st resistance before resuming the downtrend.
The 1st resistance level at 0.6614 is identified as a pullback resistance that aligns with the 23.60% Fibonacci retracement level. Higher up, the 2nd resistance level at 0.6654 is also noted as a pullback resistance that aligns with the 38.20% Fibonacci retracement level, suggesting a potential barrier for further upside movement.
To the downside, the 1st support level at 0.6534 is identified as a pullback support. Further below, the 2nd support level at 0.6461 is also marked as a pullback support that aligns with the 78.60% Fibonacci retracement level, further reinforcing its importance as a key support level.
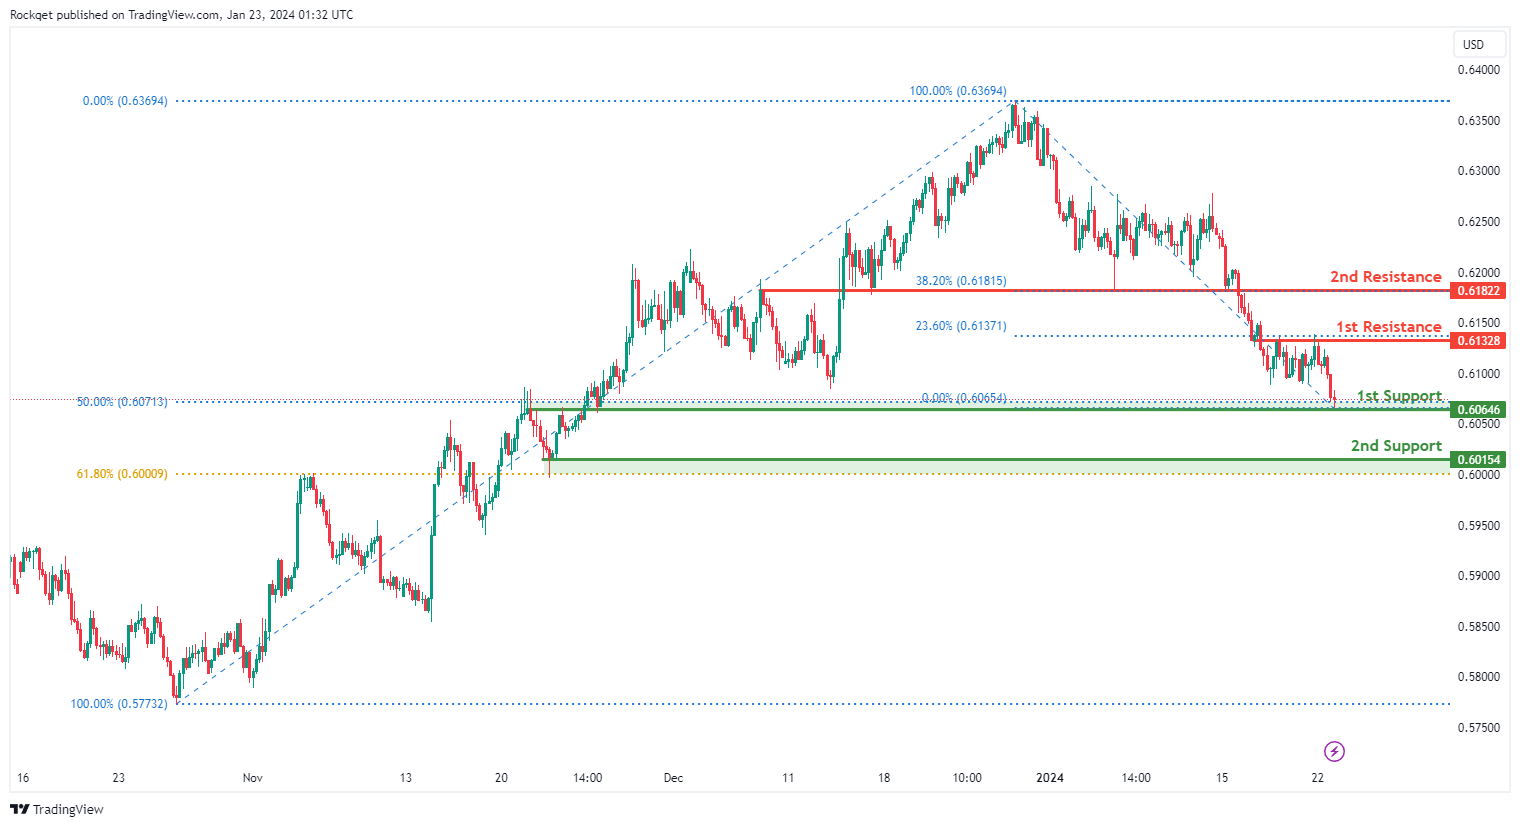
NZD/USD
The NZD/USD chart currently exhibits an overall bearish momentum. In this context, there is a potential scenario for price to retrace higher towards the 1st resistance before resuming the downtrend.
The 1st resistance level at 0.6132 is identified as an overlap resistance that aligns with the 23.60% Fibonacci retracement level. Higher up, the 2nd resistance level at 0.6182 is also noted as an overlap resistance that aligns with the 38.20% Fibonacci retracement level, suggesting a potential barrier for further upside movement.
To the downside, the 1st support level at 0.6064 is identified as an overlap support that aligns close to the 50.00% Fibonacci retracement level. Further below, the 2nd support level at 0.6015 is marked as a pullback support that aligns close to the 61.80% Fibonacci retracement level, further reinforcing its importance as a key support level.
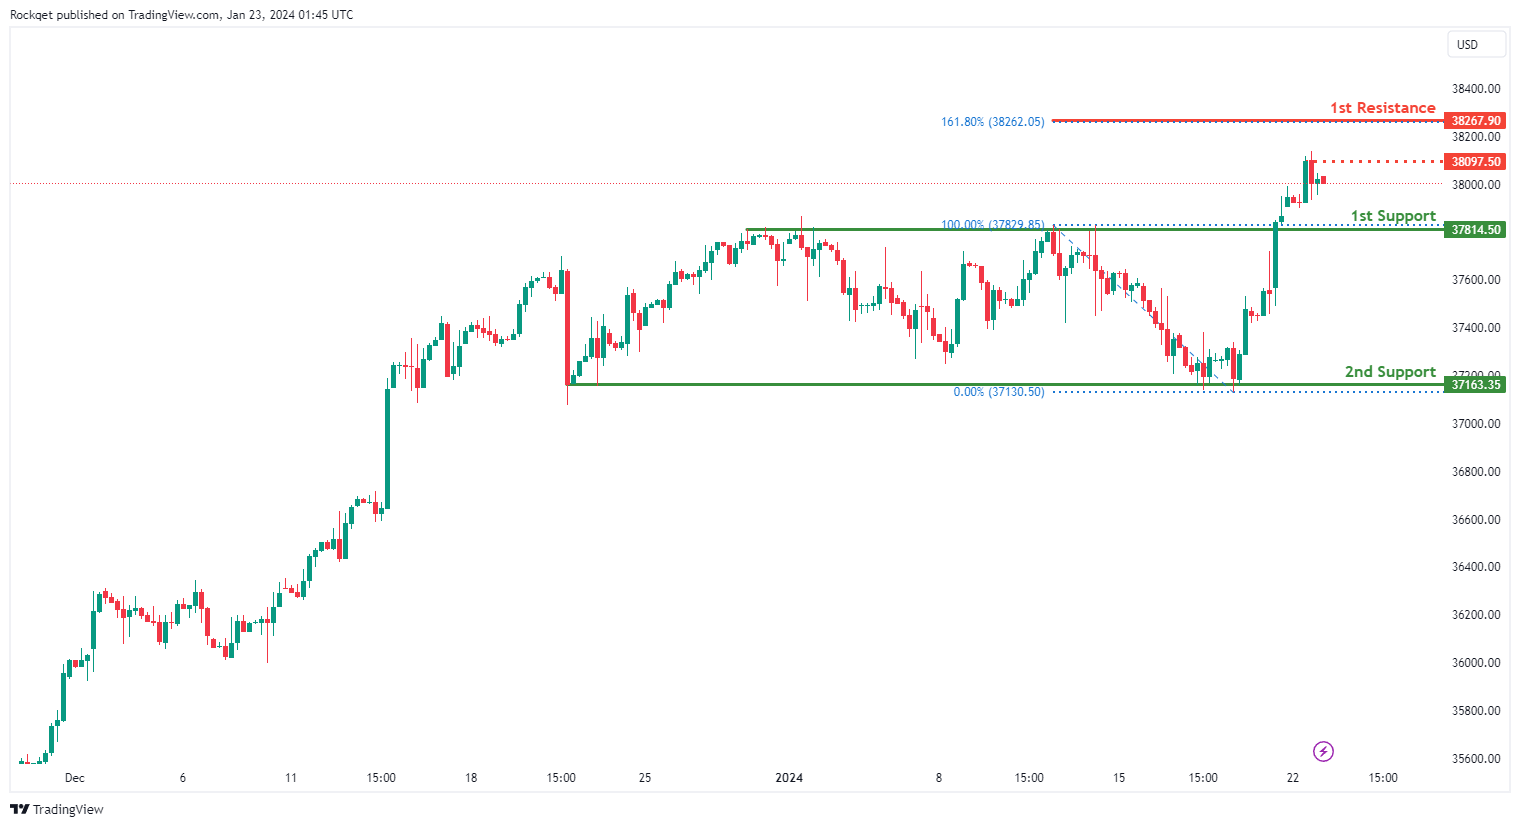
DJ30:
The DJ30 chart currently displays a neutral overall momentum, indicating a lack of a clear trend direction. There is a potential scenario where the price could fluctuate between the 1st resistance and 1st support levels.
The 1st support at 37814.50 is considered favorable as it is identified as a pullback support, suggesting historical significance as a level where buying interest has previously emerged. Additionally, the 2nd support at 37163.35 is recognized as a multi-swing low support, providing additional strength to the support zone.
On the resistance side, the intermediate resistance at 38097.50 is identified as a pullback resistance, suggesting a level where selling interest may be observed. Furthermore, the 1st resistance at 38267.90 is noteworthy for the presence of the 161.80% Fibonacci Extension, adding significance to this potential resistance level.
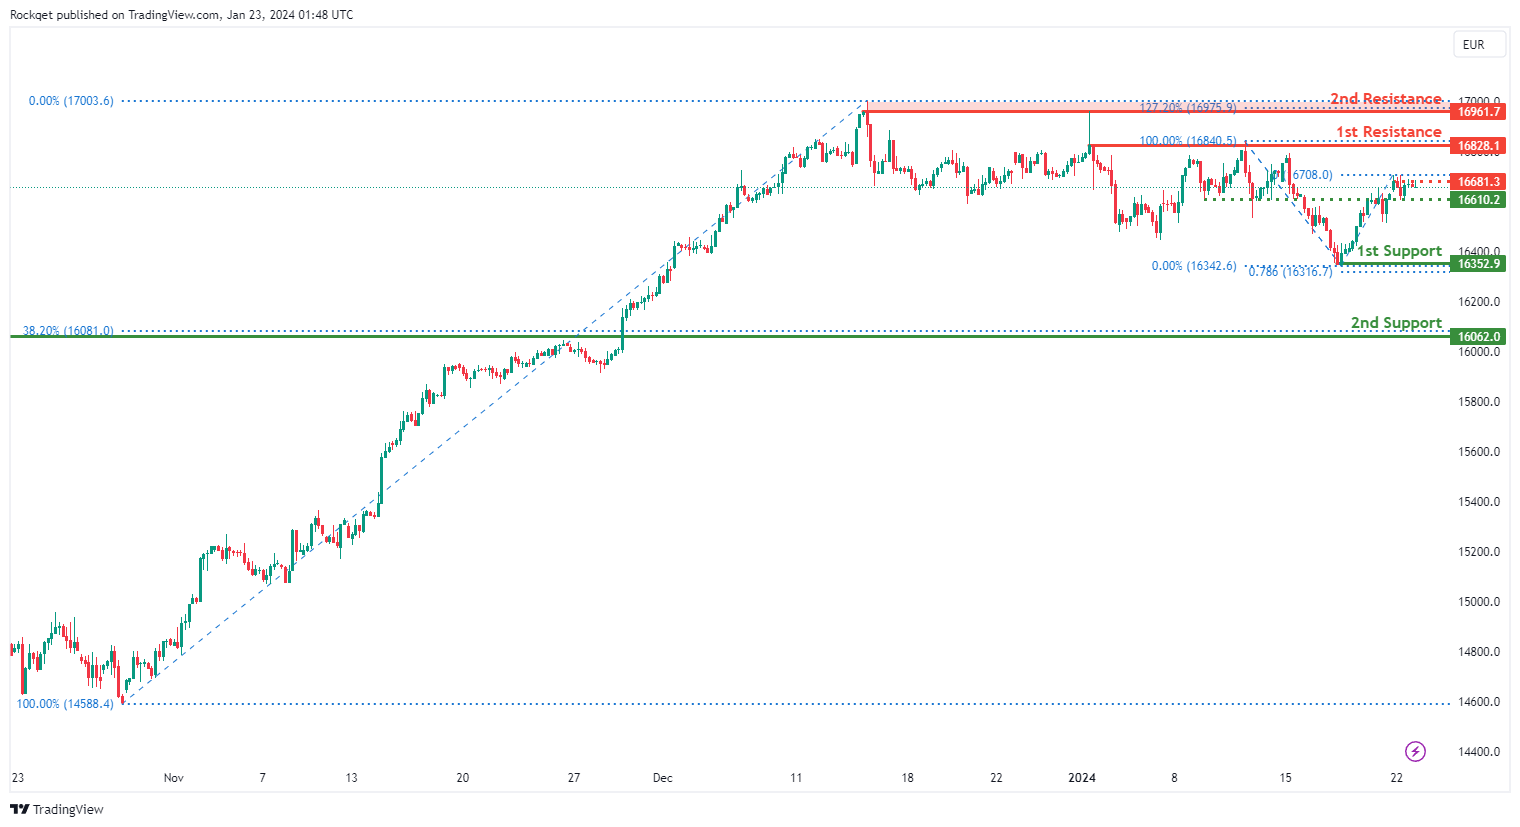
GER40:
The GER40 chart currently exhibits a weak bullish overall momentum with low confidence, indicating a tentative upward bias. Several factors contribute to this weak bullish momentum, and as a result, the price could potentially make a bullish continuation towards the 1st resistance.
The intermediate support at 16610.20 is recognized as a pullback support, suggesting a level where buying interest may emerge. Additionally, the 1st support at 16352.90 is considered favorable as a multi-swing low support, indicating historical significance as a level where buyers have been active. This support level also aligns with the 78.60% Fibonacci Projection, adding confluence to its potential as a support zone.
On the resistance side, the 1st resistance at 16828.10 is identified as a multi-swing high resistance, suggesting a historical point where selling interest has emerged. The 2nd resistance at 16961.70 is noteworthy for the presence of the 127.20% Fibonacci Extension, adding significance to this potential resistance level.
Furthermore, the intermediate resistance at 16681.30 is recognized as a pullback resistance, suggesting a level where selling interest may be observed, and it corresponds to the 78.60% Fibonacci Retracement.
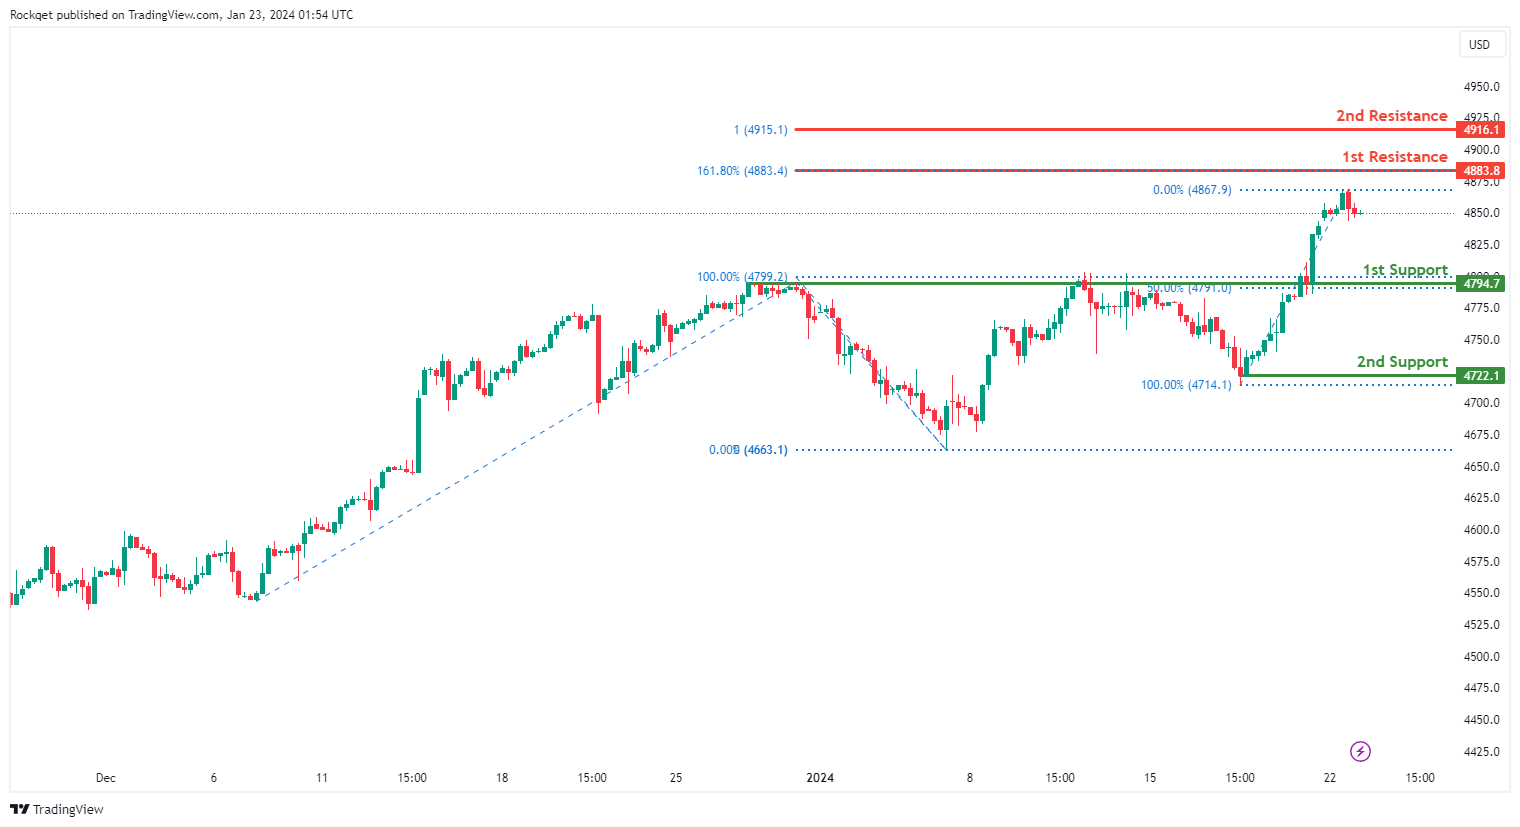
US500:
The US500 chart currently demonstrates a weak bullish overall momentum with low confidence, suggesting a tentative upward bias. Several factors contribute to this weak bullish momentum, and as a result, the price could potentially make a bullish continuation towards the 1st resistance.
The 1st support at 4794.7 is considered favorable due to its identification as an overlap support and coincides with the 50% Fibonacci Retracement, indicating historical significance as a level where buying interest has previously emerged. Additionally, the 2nd support at 4722.1 is recognized as a swing low support, providing additional strength to the support zone.
On the resistance side, the 1st resistance at 4883.8 is identified as a potential level for selling interest, and it corresponds to the 161.80% Fibonacci Extension, adding significance to this potential resistance level. Moreover, the intermediate resistance at 4818.4 is recognized for the presence of the 100% Fibonacci Projection, providing additional confluence to the potential resistance zone.
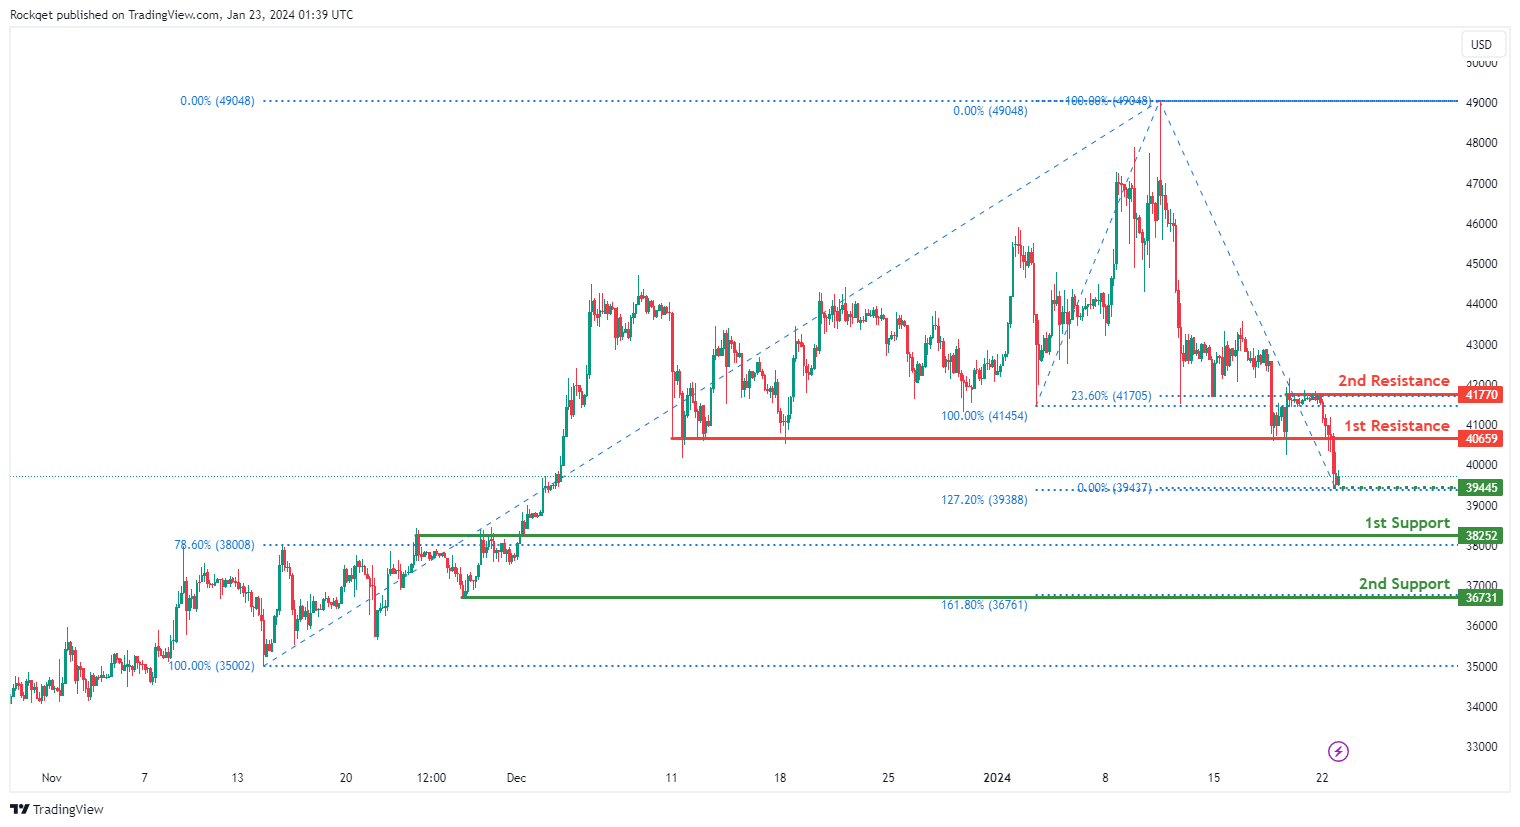
BTC/USD:
The BTC/USD chart currently exhibits a bearish overall momentum, indicating a downward trend in prices. There are several key levels that traders should pay attention to, suggesting a potential bearish continuation.
The 1st support at 38252 is identified as a critical level due to its designation as an overlap support and aligns with the 78.60% Fibonacci Retracement. This level has historical significance, representing a strong area where buying interest has previously emerged. Additionally, the 2nd support at 36731 is recognized as a swing low support and coincides with the 161.80% Fibonacci Extension, adding further strength to the support zone.
On the resistance side, the 1st resistance at 40659 is noted as a level where selling interest may intensify. This level corresponds to a pullback resistance, suggesting potential barriers to upward movement. Furthermore, the 2nd resistance at 41770 is significant for being a multi-swing high resistance and aligns with the 23.60% Fibonacci Retracement, providing additional confluence to this potential resistance zone.
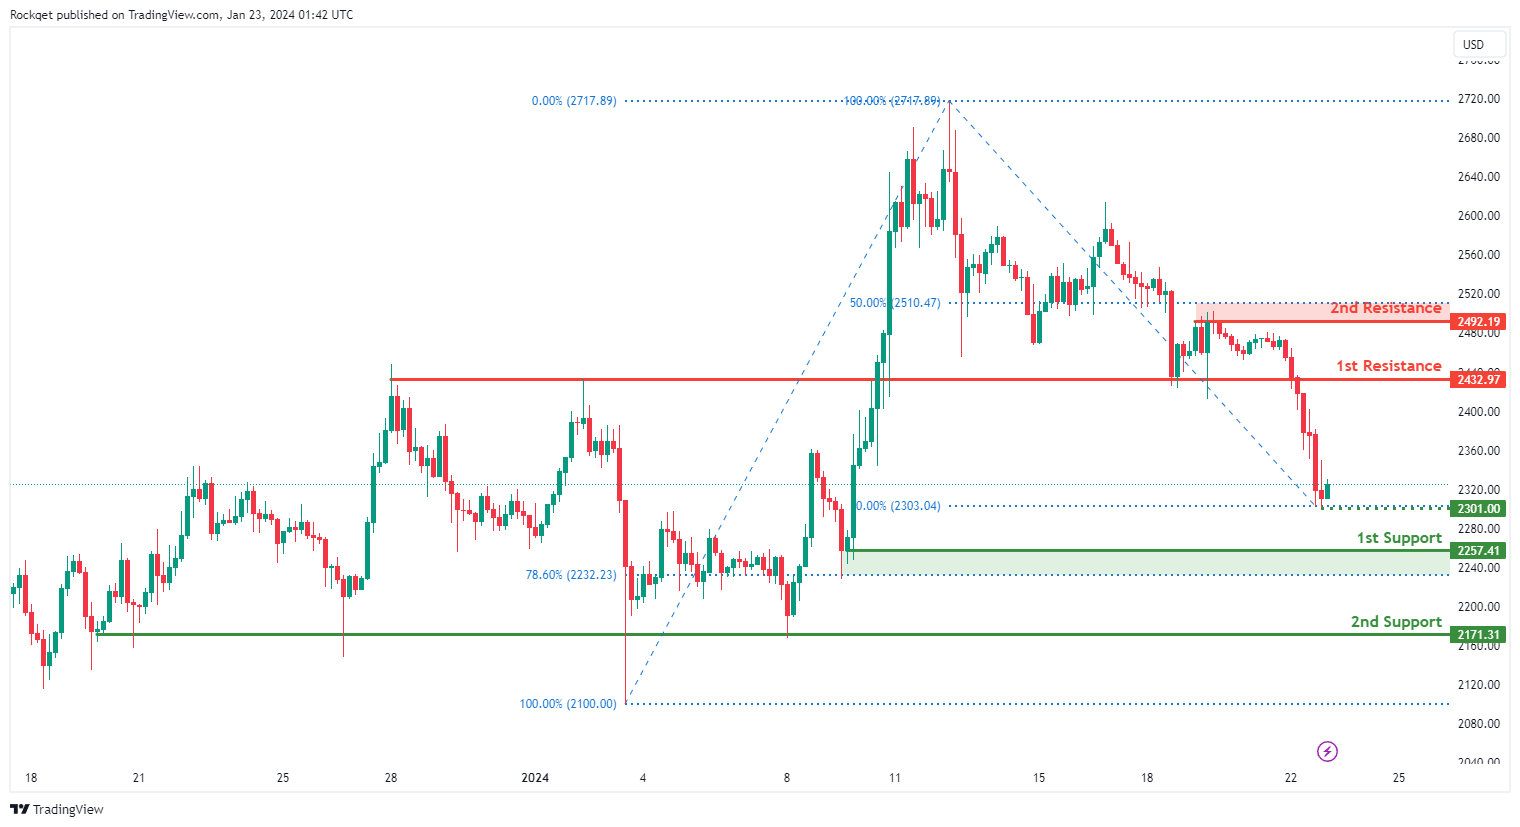
ETH/USD:
The ETH/USD chart currently displays a bearish overall momentum, suggesting a downward trend in prices. Traders should take note of key levels indicating a potential bearish continuation.
The 1st support at 2257.41 is considered a crucial level as it is identified as a pullback support and coincides with the 78.60% Fibonacci Retracement. This level holds historical significance, indicating a strong area where buying interest has previously emerged. Additionally, the 2nd support at 2171.31 is recognized as a multi-swing low support, providing added strength to the support zone.
On the resistance side, the 1st resistance at 2432.97 represents a level where selling interest may intensify. This level corresponds to an overlap resistance, suggesting potential barriers to upward movement. Furthermore, the 2nd resistance at 2492.19 is noteworthy for being a pullback resistance and aligns with the 50% Fibonacci Retracement, adding confluence to this potential resistance zone.
An intermediate support level at 2301.00 is also highlighted as a swing low support, providing an additional reference point for potential price reactions.
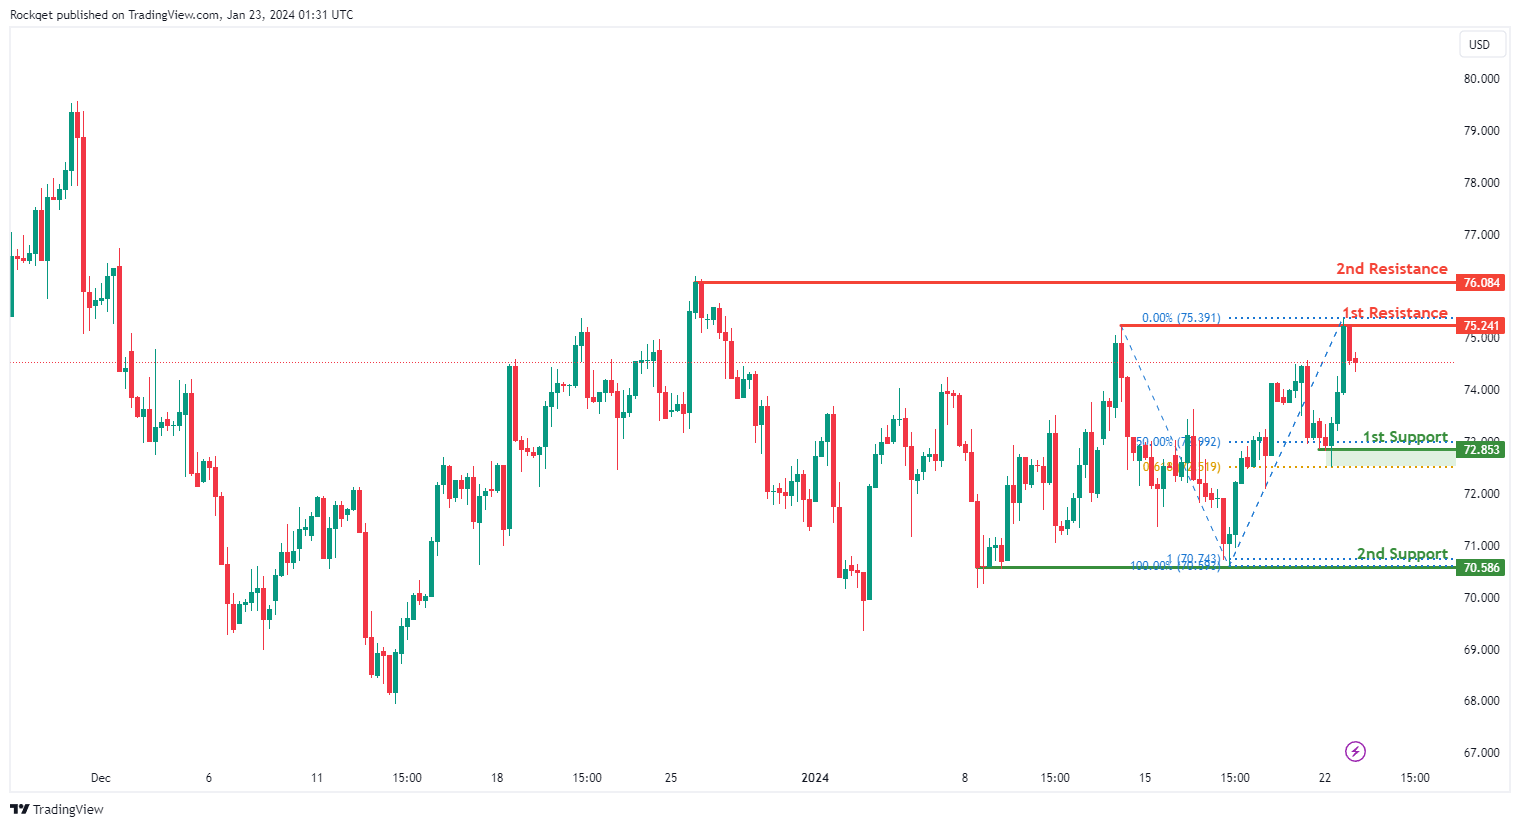
WTI/USD:
The WTI (West Texas Intermediate) chart currently exhibits a neutral bias. In this context, there is a potential scenario for price to fluctuate between the 1st resistance and the 1st support.
The 1st resistance level at 75.24 is identified as a pullback resistance. Higher up, the 2nd resistance level at 76.08 is also noted as a swing-high resistance, suggesting a potential barrier for further upside movement.
To the downside, the 1st support level at 72.85 is identified as a pullback support that aligns with a confluence of Fibonacci levels i.e. the 50.0% retracement and the 61.80% projection. Further below, the 2nd support level at 70.58 is marked as a pullback support, further reinforcing its importance as a key support level.
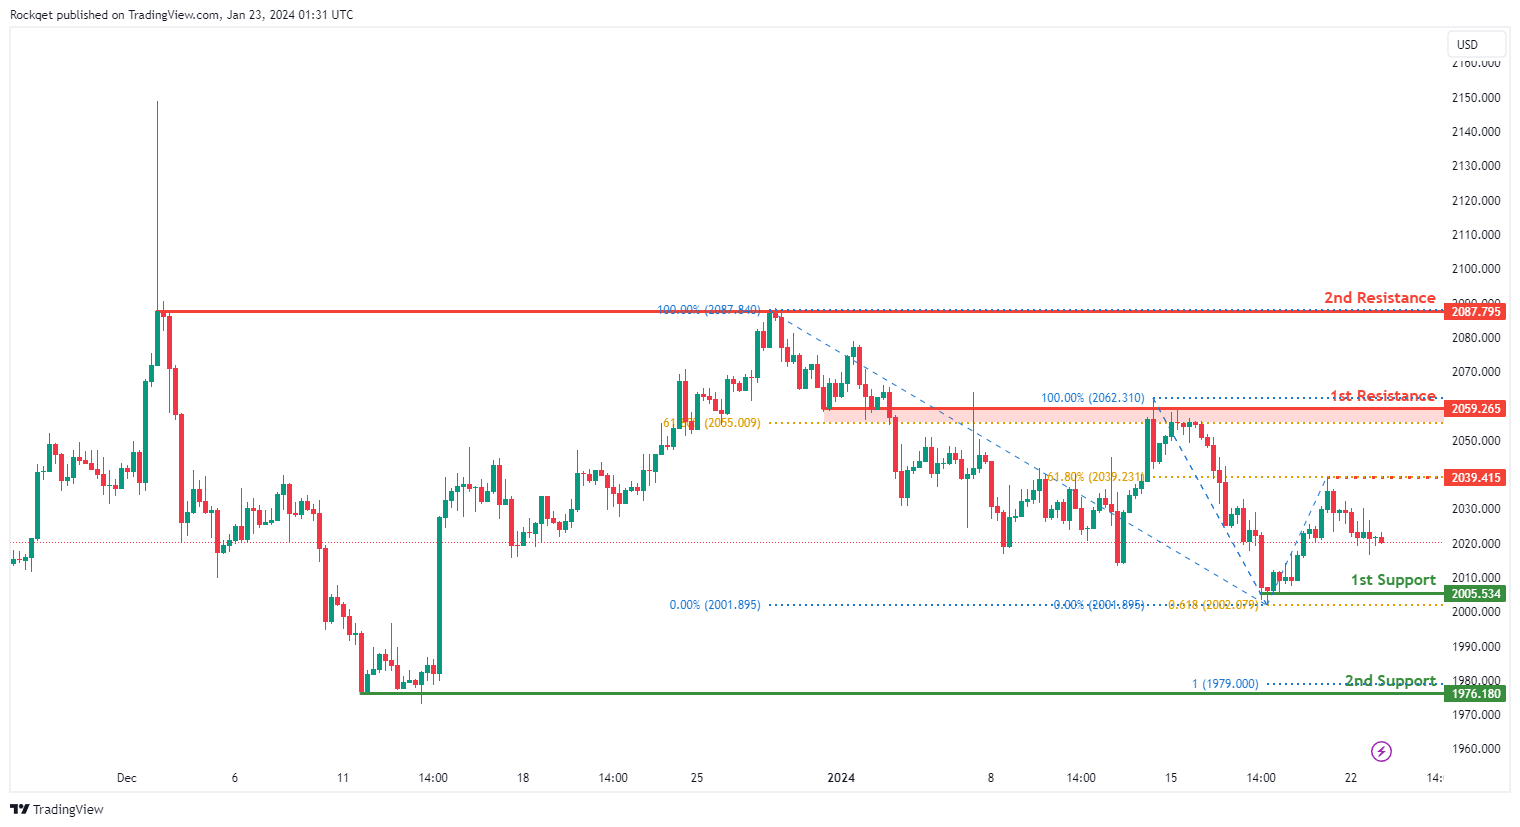
XAU/USD (GOLD):
The XAUUSD (Gold/US Dollar) chart presently displays an overall bearish momentum. In this context, there is a potential scenario for price to fall towards the 1st support.
The 1st support level at 2,005.53 is recognized as a pullback support that aligns with the 61.80% Fibonacci projection level. Further below, the 2nd support level at 1,976.18 is categorized as a swing-low support that aligns with the 100.00% Fibonacci projection level, further reinforcing its importance as a key support level.
To the upside, the intermediate resistance level at 2,039.41 is identified as a pullback resistance that aligns with the 61.80% Fibonacci retracement level while the 1st resistance level at 2,059.26 is noted as an overlap resistance that aligns with the 61.80% Fibonacci retracement level. Higher up, the 2nd resistance level at 2,087.79 is marked as a multi-swing-high resistance, signifying its significance as a potential hurdle for further upward price movement.


