
Bullish Scenario: Consider buying at levels 1.3428 or 1.3462 with take profit targets at 1.3990 (TP1), 135.00 (TP2), and 1.3510 in extension (TP3). It is recommended to set a stop loss (S.L.) below 1.3410 or at least 1% of the account capital**.
Bearish Scenario: Selling below 1.3460 (waiting for a retracement to the zone) with TP1 at 1.3430, TP2 at 1.3415, and TP3 at 1.34 in extension. It is advised to place a stop loss above 1.3477 or at least 1% of the account capital**. A trailing stop can be utilized.
Fundamental Analysis
Today, Wednesday, January 24, the Bank of Canada (BoC) issues its first policy statement of 2024 at 14:45. No change in the current interest rate of 5.00% is expected.
According to recent data, core inflation in Canada exceeded expectations in December, ruling out a significant shift in the dovish direction of the BoC in today’s meeting. Despite this, some reports have highlighted the negative impact that high rates are having on other sectors of the economy.
The latest BoC Business Outlook Survey reported weakened demand and less favourable business conditions in the fourth quarter for investments, leading most companies to not plan new hires. However, lower inflation is still the primary goal of high rates and may soften in the coming months, favouring potential rate cuts starting in the second quarter, likely in April.
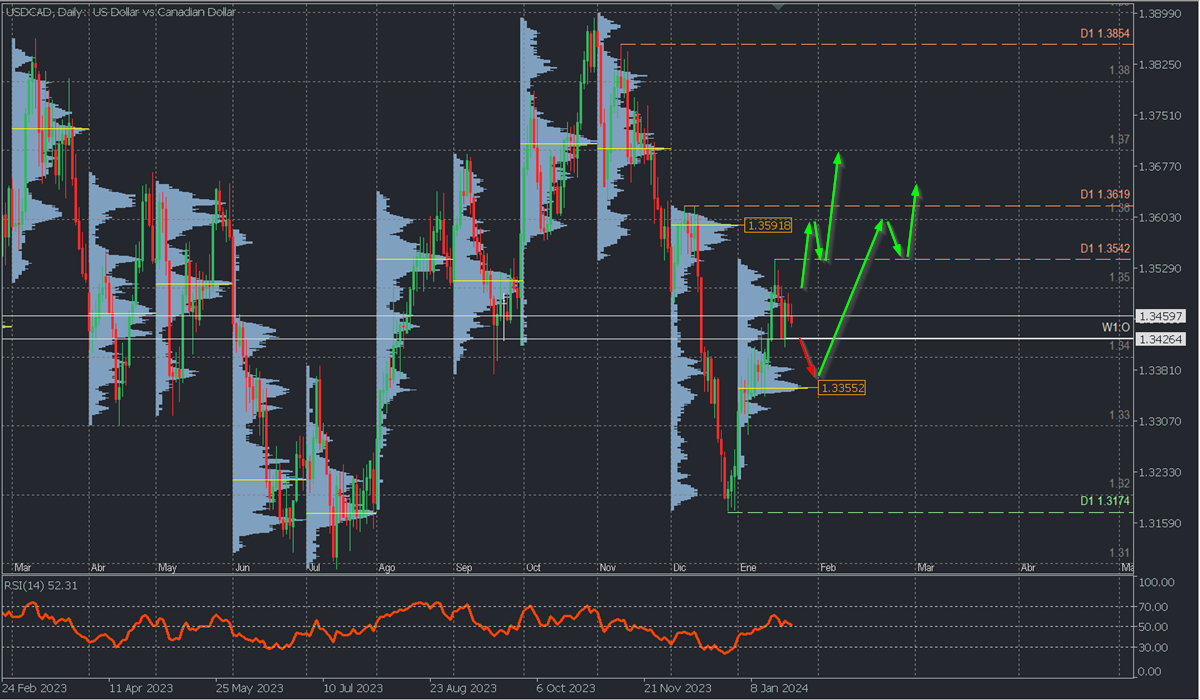
Daily Chart Analysis
The USDCAD pair has been in a macro bullish correction since the beginning of the month, reaching a peak at 1.3542 and forming a high-volume node that could be interpreted as a selling zone. From here, we evaluate key levels for two possible scenarios:
Bearish Scenario:
If quotes fall below the week’s opening at 1.3426, sales towards the current Point of Control (POC) of the month (which may vary as the month has not ended) at 1.3355 can be expected. This level formed the last price buying zone and coincides with a Fibonacci retracement of 50%. This zone can act as a pivot defended by the bulls or be broken by bearish force.
Only a decisive breakout of the high-volume node forming the buying zone will indicate a continued downtrend with a target at the macro support of 1.3174.
Bullish Scenario:
After a 50% correction, a rebound from 1.3355 will offer an opportunity to activate a new upward impulse towards 1.3542, the next selling zone from December around 1.3592, and resistance at 1.3619, reversing the macro downtrend with a decisive or confirmed breakout with two rising highs.
Anticipated: An early rebound will occur with the failure of the price to break below the weekly opening of 1.3426 and the rapid surpassing of 1.35 and 1.3542, opening the door to further ascent towards 1.3619 and beyond into February.
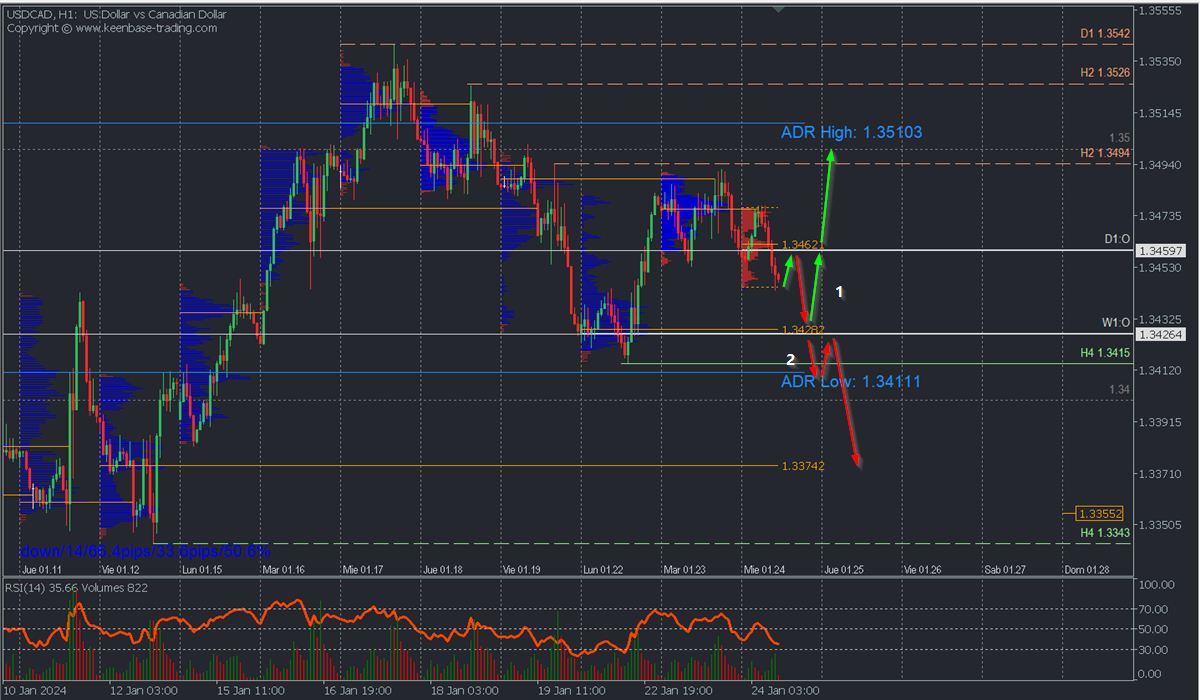
H1 Chart Scenario:
The formation of a reversal pattern below the resistance at 1.3494 anticipates a short-term bearish scenario, especially with quotes below the uncovered POC* of the early sessions at 1.3462, near the day’s opening.
1. The first intraday scenario: Aims for sales at Monday’s uncovered POC* at 1.3428, converging with the weekly opening. This buying zone is expected to be defended by the bulls, causing a new price rebound towards 1.35 and the Average Daily Range (ADR) High at 1.3510, signalling an intraday sequence change.
2. The second intraday scenario: Will be activated after the decisive breakout (candle body) of the buying zone around 1.3428, with a possible breakdown of support at 1.3415, indicating greater bearish strength seeking the next buying liquidity zone around 1.3374, likely in the next day.
*Uncovered POC: POC = Point of Control: It is the level or zone where the highest volume concentration occurred. If there was a bearish move previously from it, it is considered a selling zone and forms a resistance area. Conversely, if there was a bullish impulse previously, it is considered a buying zone, usually located at lows, forming support zones.
**Consider this risk management suggestion
It is crucial that risk management is based on capital and traded volume. For this, a maximum risk of 1% of the capital is recommended. It is suggested to use risk management indicators such as the Easy Order.


 issues its first policy statement of 2024 at 14:45. No change in the current interest rate of 5.00% is expected.)