
DXY:
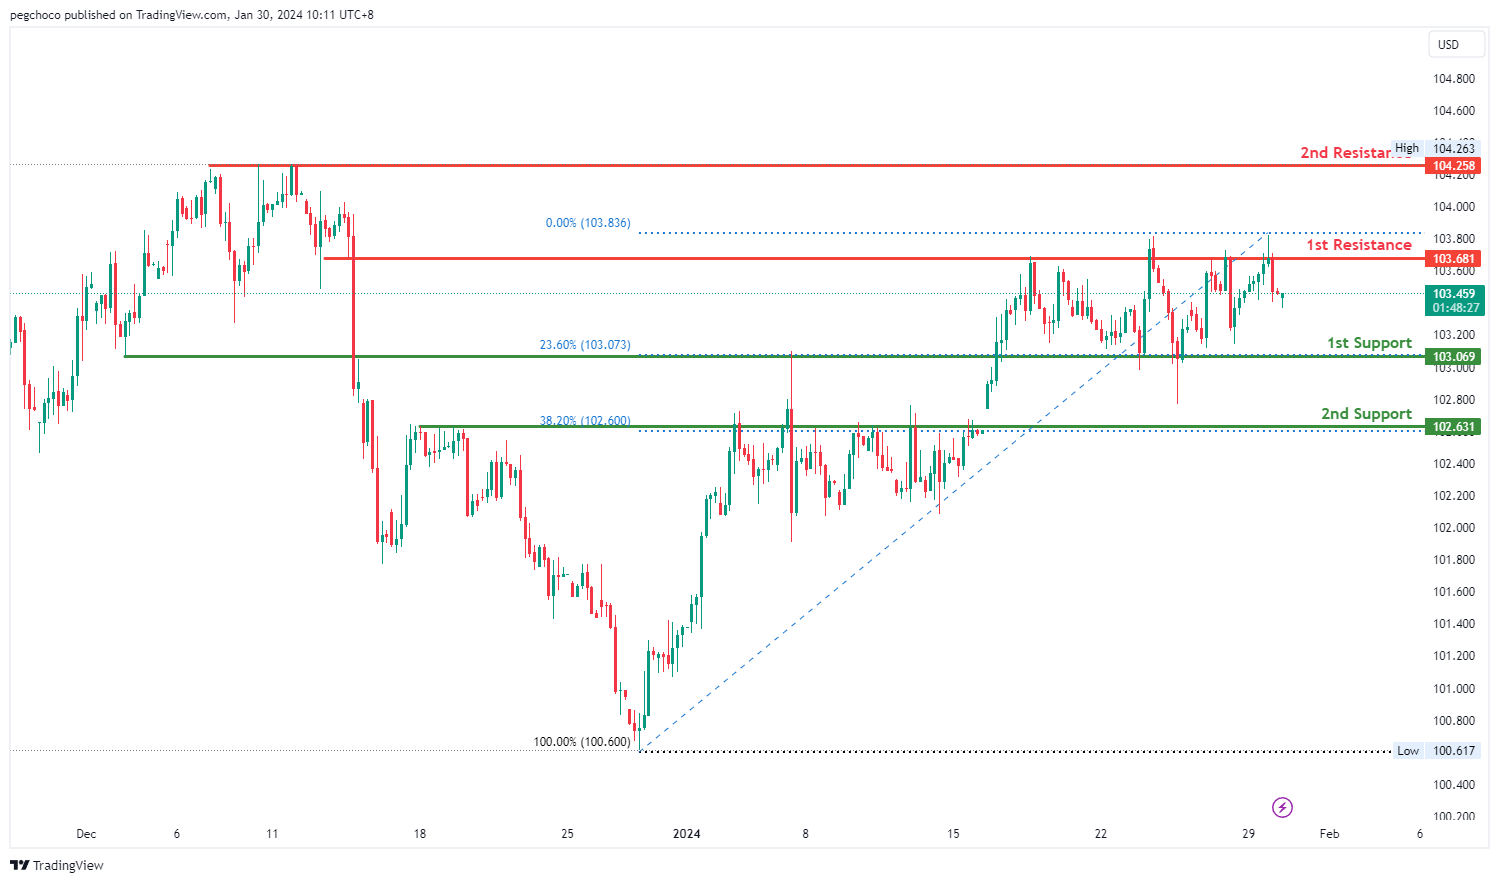
The DXY (US Dollar Currency Index) chart currently exhibits a neutral overall momentum, indicating a lack of a strong directional bias. Your analysis suggests that the price could potentially fluctuate between the 1st resistance and 1st support levels.
The 1st support level at 103.06 is identified as an overlap support and coincides with the 23.60% Fibonacci Retracement level. This level represents a potential area where buying interest may emerge, providing temporary support for the US Dollar. The Fibonacci Retracement adds to its importance as a potential support zone.
The 2nd support level at 102.63 is characterized as a pullback support and corresponds to the 38.20% Fibonacci Retracement level, indicating its historical significance as a support level.
On the resistance side, the 1st resistance level at 103.68 is identified as an overlap resistance, suggesting that it represents a historical point where the price has encountered resistance.
The 2nd resistance level at 104.25 is categorized as a multi-swing high resistance, indicating that it represents a historical point where the price has encountered significant resistance.
EUR/USD:
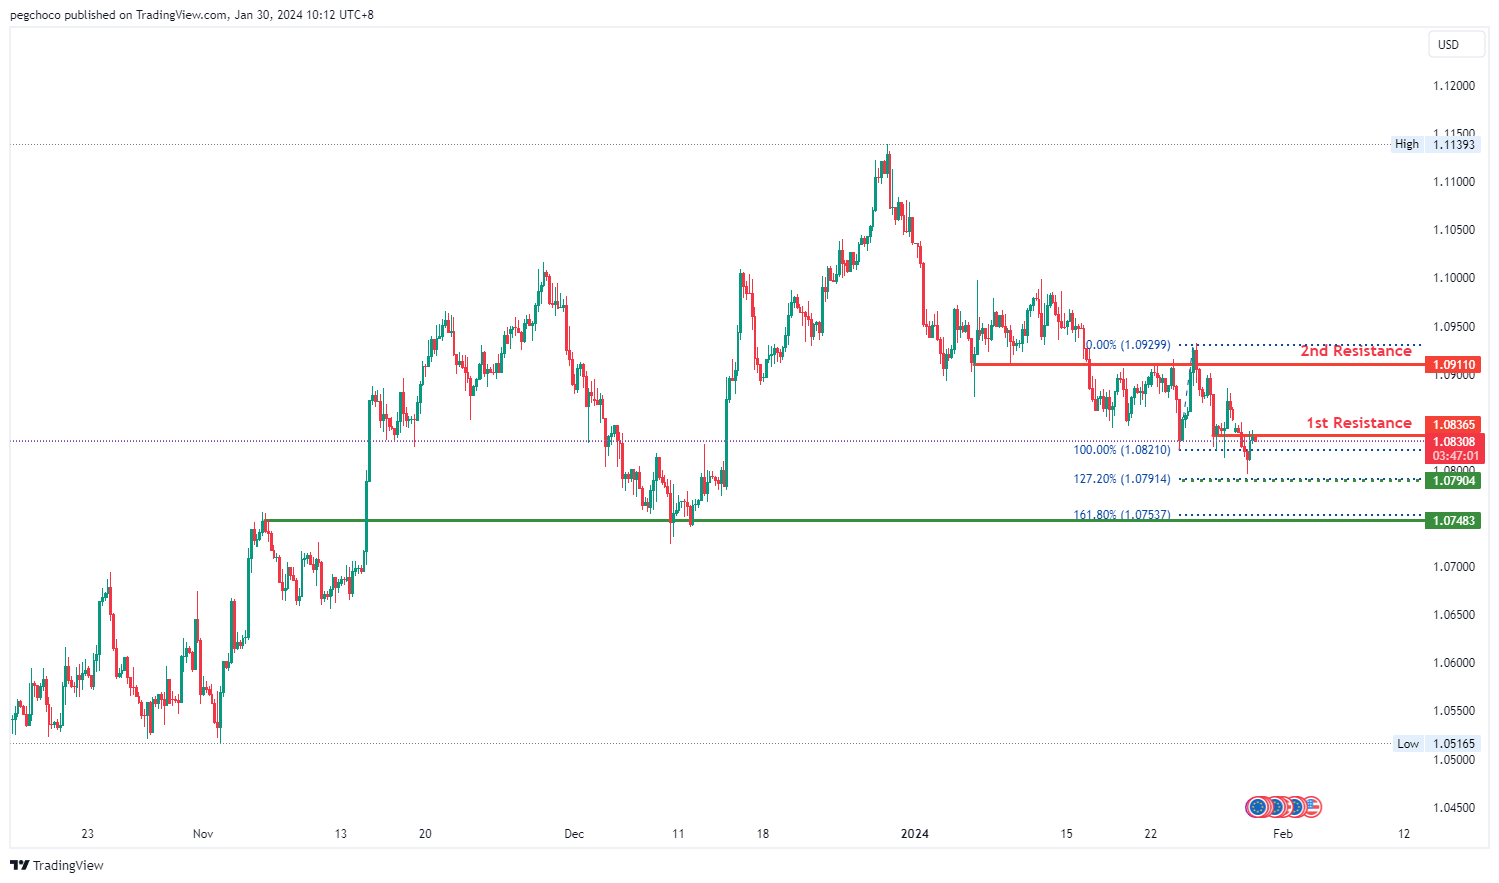
The EUR/USD chart currently exhibits a bearish overall momentum, indicating a downward trend. Your analysis suggests that the price could potentially continue in a bearish direction towards the 1st support level.
The 1st support level at 1.0748 is identified as an overlap support and coincides with the 161.80% Fibonacci Extension level. This level represents a significant historical support level, and the Fibonacci Extension adds to its importance as a potential support zone.
An intermediate support level is noted at 1.079, and it is identified as a multi-swing low support. Additionally, it coincides with the 127.20% Fibonacci Extension level, which further strengthens its potential as a support area.
On the resistance side, the 1st resistance level at 1.0836 is categorized as an overlap resistance, indicating that it represents a historical point where the price has encountered resistance.
The 2nd resistance level at 1.0911 is also identified as an overlap resistance, suggesting that it is another historical point where the price has faced resistance.
EUR/JPY:
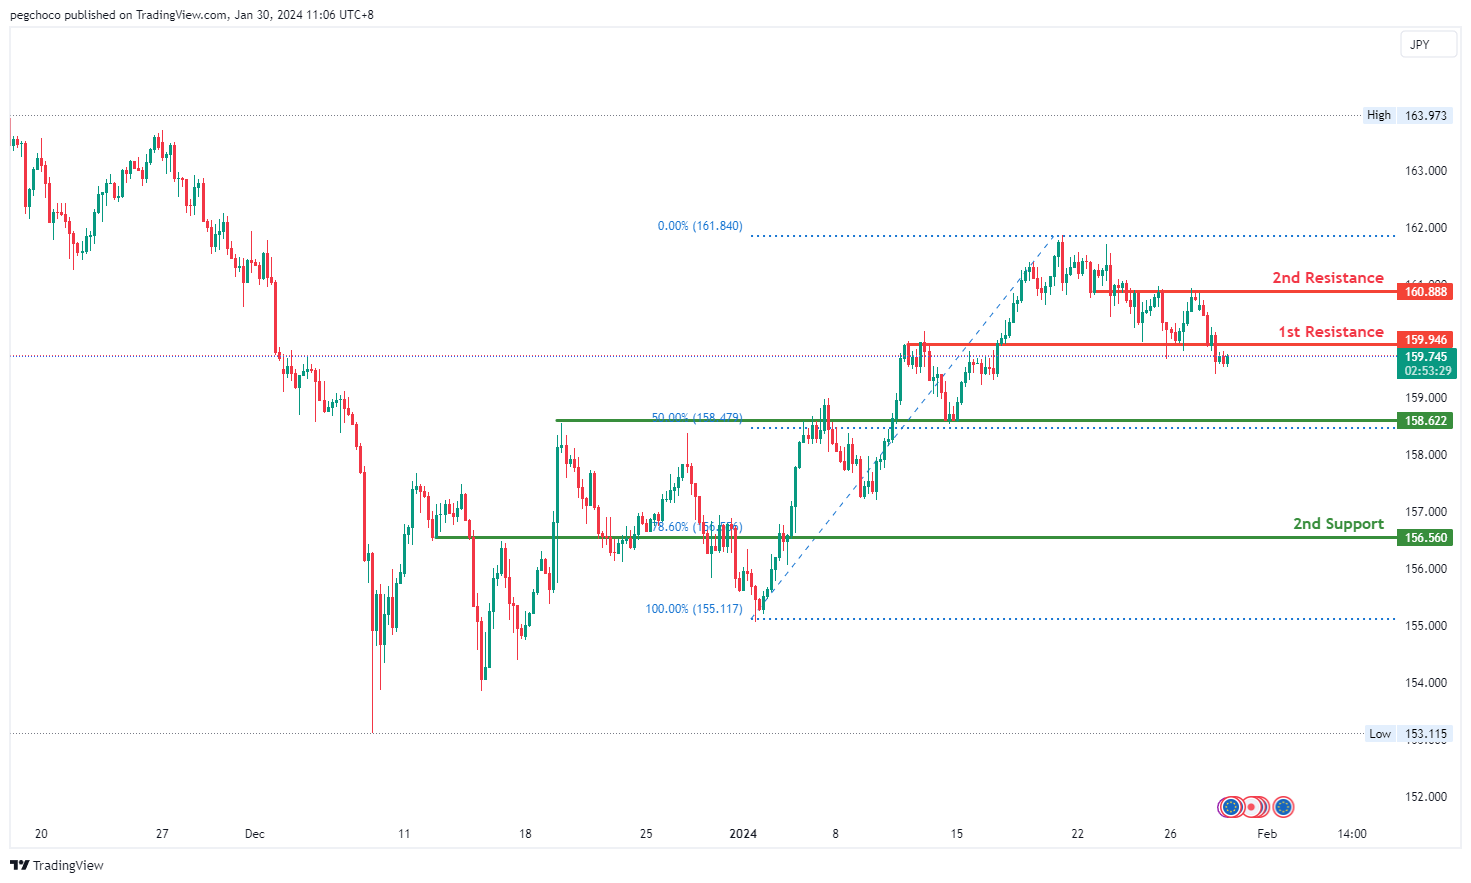
The EUR/JPY chart analysis indicates a bearish overall momentum, suggesting a downward trend. Based on your analysis, there is potential for a bearish reaction off the 1st resistance level and a subsequent drop towards the 1st support level.
The 1st support level at 158.62 is identified as an overlap support and is reinforced by the presence of the 50% Fibonacci Retracement. This suggests that it has historical significance and could potentially act as a strong support level where buying interest may emerge.
The 2nd support level at 156.56 is described as a pullback support and is associated with the 78.60% Fibonacci Retracement, further emphasizing its importance as a potential support zone.
On the resistance side, the 1st resistance level at 159.94 is categorized as a pullback resistance, indicating that it is a historical level where the price has encountered resistance in the past.
The 2nd resistance level at 160.88 is identified as an overlap resistance, suggesting that it represents another historical point where the price has faced resistance.
EUR/GBP:
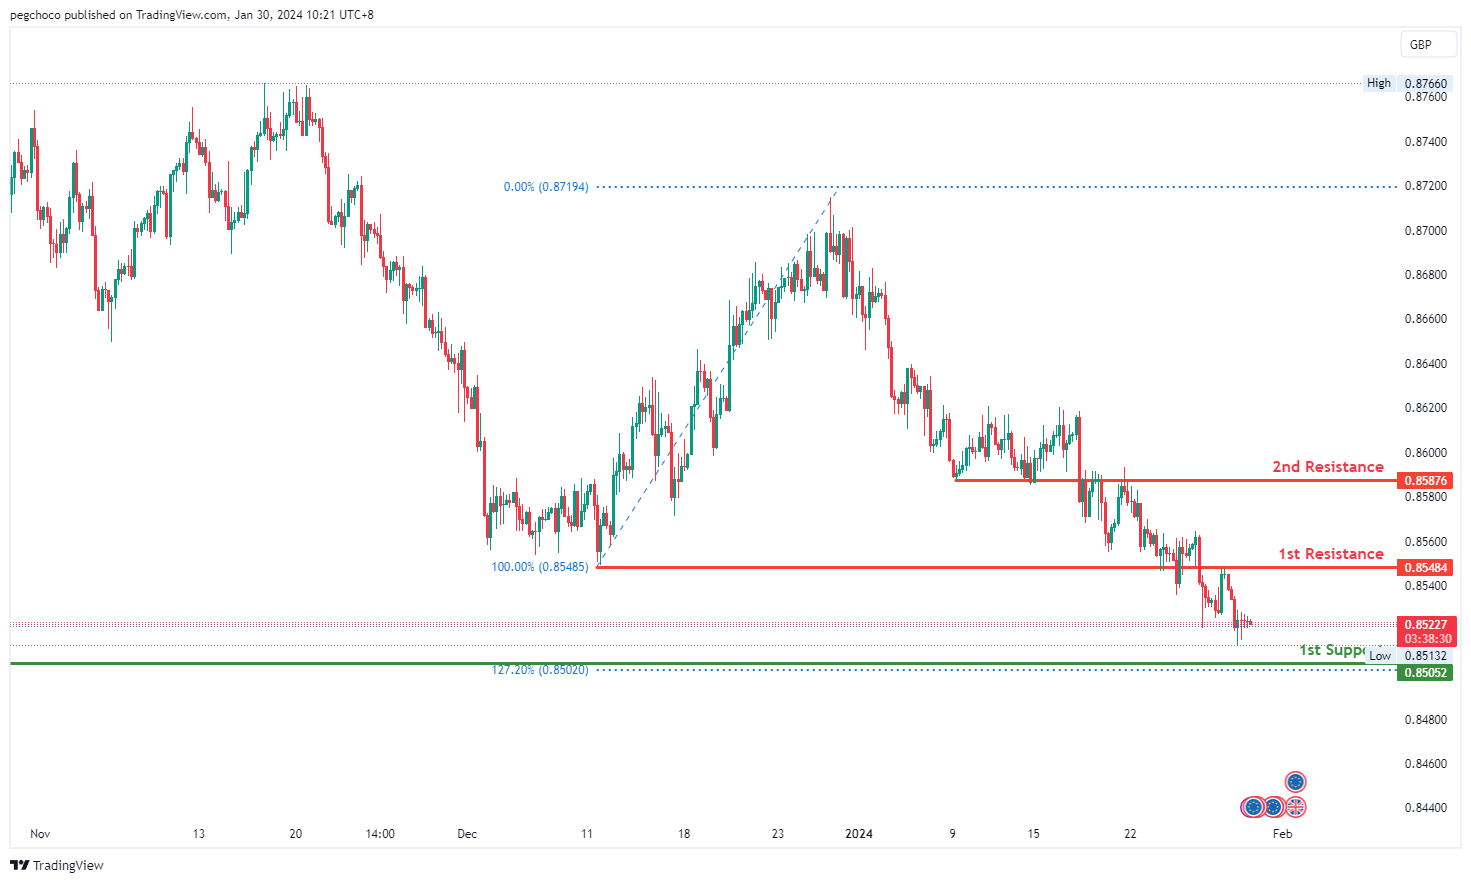
The EUR/GBP chart analysis indicates a bearish overall momentum, suggesting a downward trend. Based on your analysis, there is potential for a bearish continuation towards the 1st support level.
The 1st support level at 0.8505 is described as a multi-swing low support and is reinforced by the presence of the 127.20% Fibonacci Extension. This suggests that it has historical significance and could potentially act as a strong support level where buying interest may emerge.
On the resistance side, the 1st resistance level at 0.8548 is categorized as an overlap resistance, indicating that it represents a historical point where the price has encountered resistance in the past.
The 2nd resistance level at 0.8587 is also identified as an overlap resistance, further emphasizing its potential role as a significant barrier to upward movement.
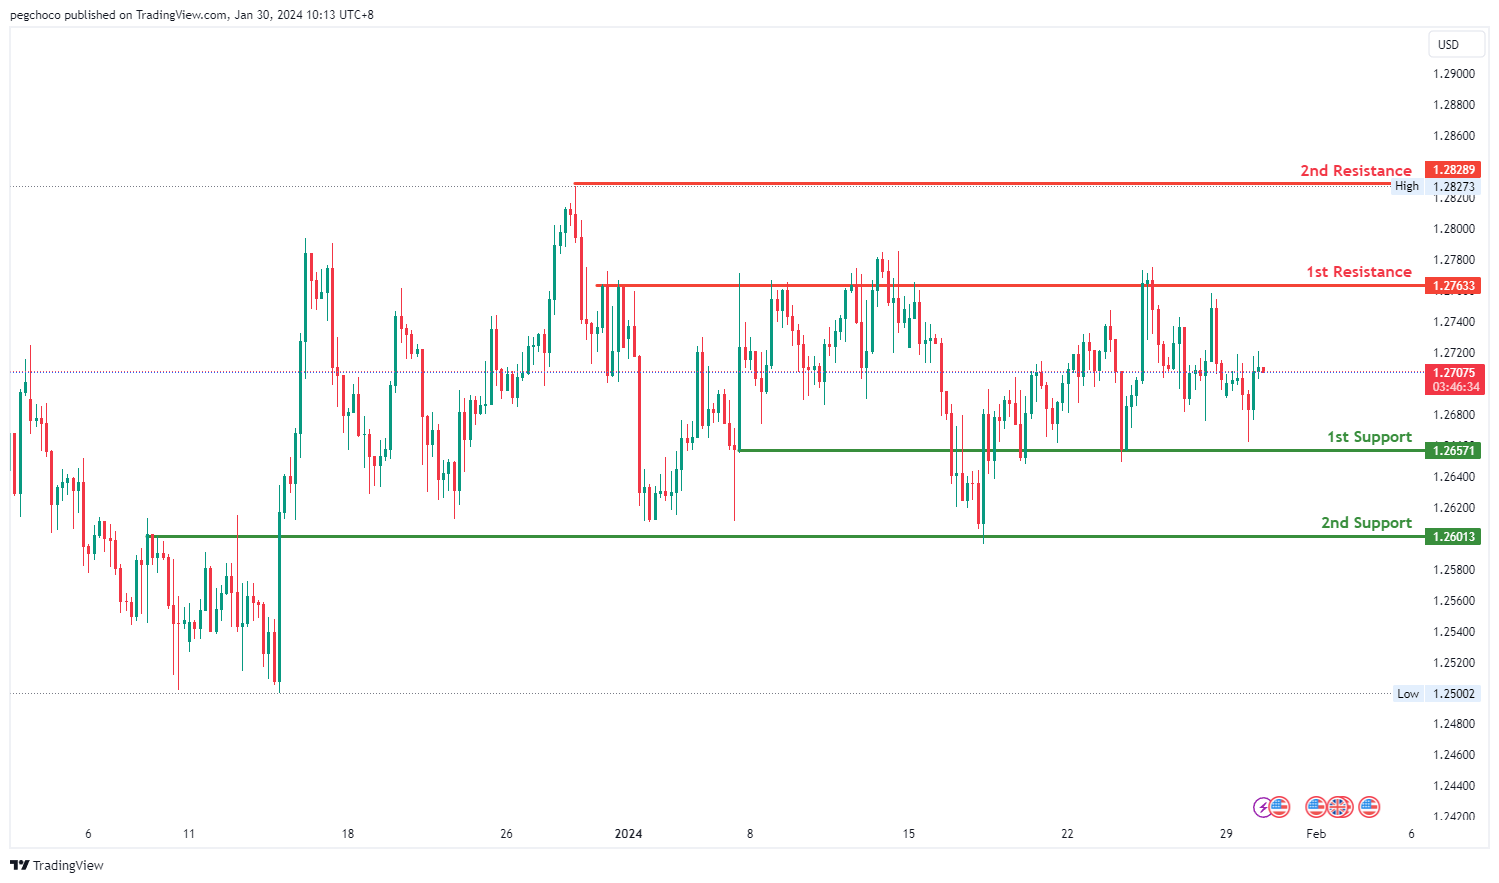
GBP/USD:
The GBP/USD chart currently exhibits a bearish overall momentum, indicating a downward trend. According to your analysis, the price could potentially continue its bearish movement towards the 1st support level.
The 1st support level at 1.2657 is identified as an overlap support, suggesting that it has historical significance as a potential level where buying interest may emerge, providing temporary support for the GBP/USD pair.
The 2nd support level at 1.2601 is also noted as an overlap support, reinforcing its importance as a potential support zone.
On the resistance side, the 1st resistance level at 1.2763 is categorized as a multi-swing high resistance, indicating that it represents a historical point where the price has encountered resistance in the past.
The 2nd resistance level at 1.2828 is identified as a swing high resistance, suggesting that it is another historical level where the price has faced resistance.
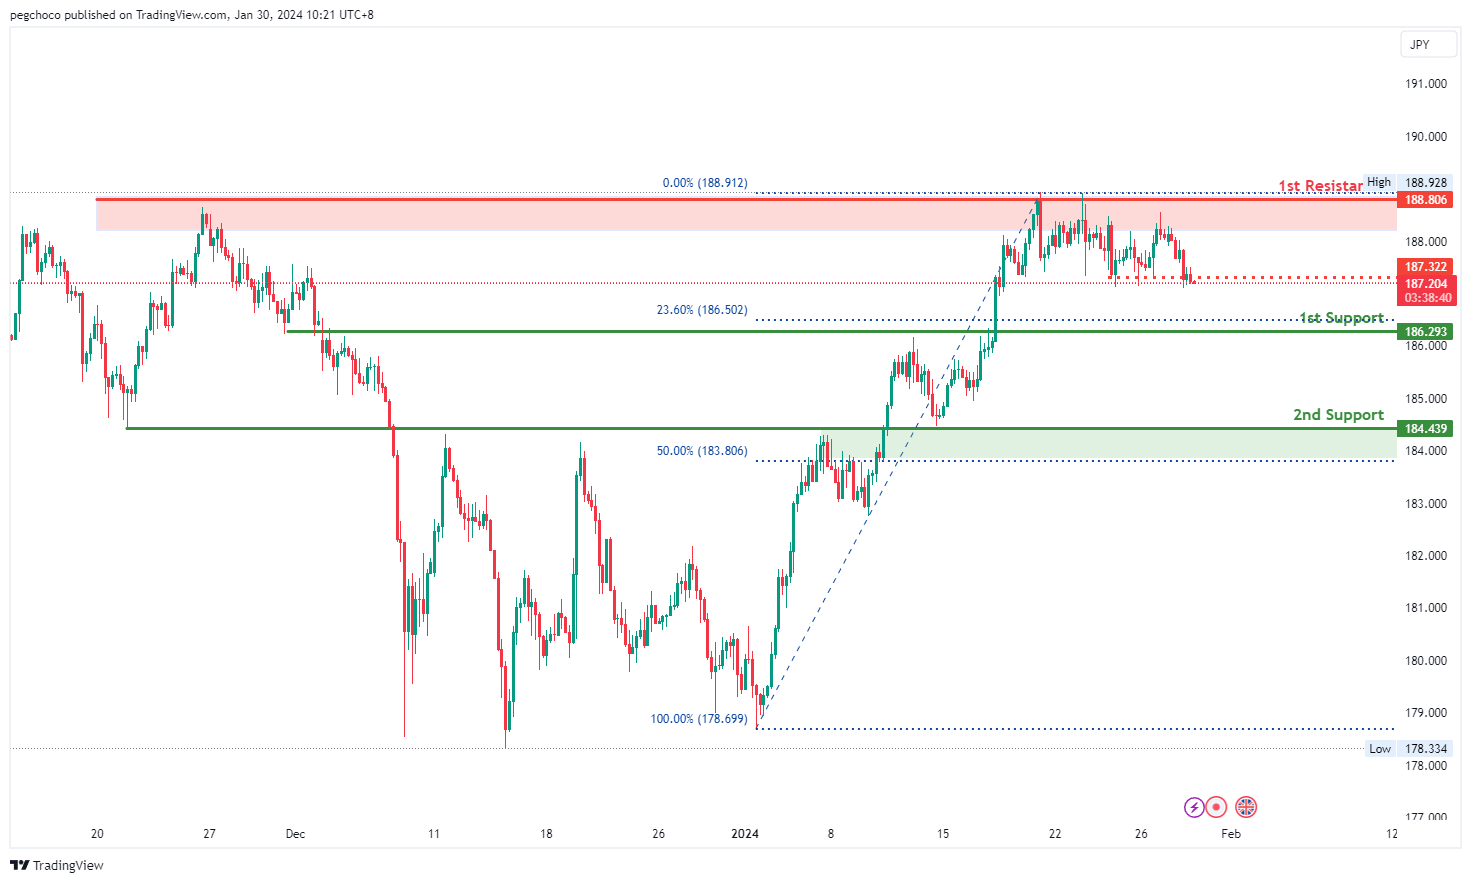
GBP/JPY:
The GBP/JPY chart analysis indicates a bearish overall momentum, suggesting a downward trend. Based on your analysis, there is potential for a bearish continuation towards the 1st support level.
The 1st support level at 186.290 is described as a pullback support and is reinforced by the presence of the 23.60% Fibonacci Retracement. This suggests that it has historical significance and could potentially act as a strong support level where buying interest may emerge.
The 2nd support level at 184.430 is identified as an overlap support and is associated with the 50% Fibonacci Retracement, further emphasizing its importance as a potential support zone.
On the resistance side, the 1st resistance level at 188.809 is categorized as a multi-swing high resistance, indicating that it is another historical level where the price has faced resistance.
Intermediate resistance at 187.320, described as a pullback resistance, may also play a role in hindering upward movements.
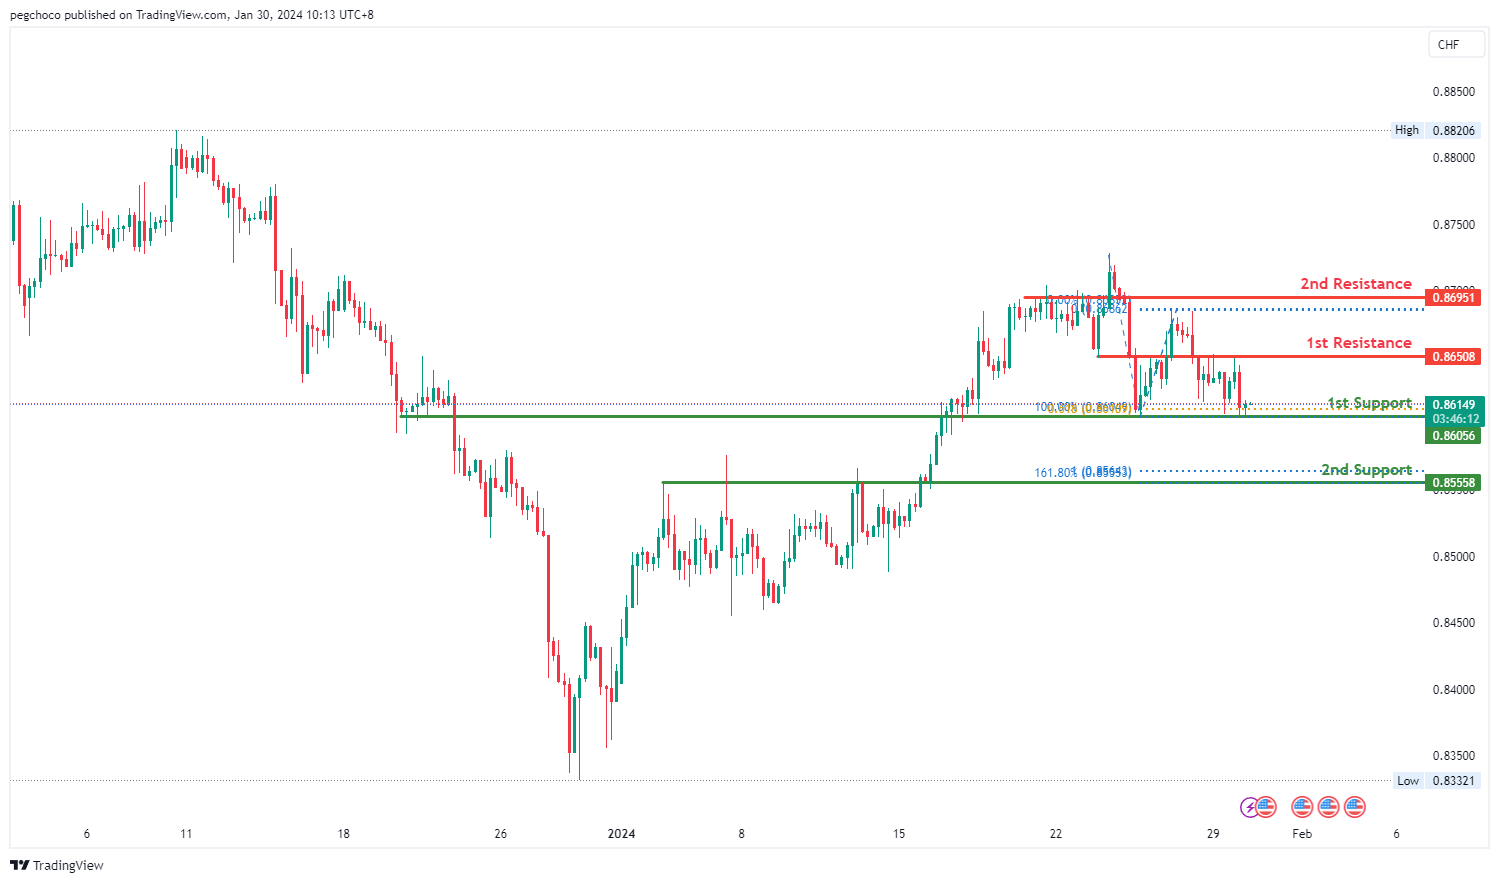
USD/CHF:
The USD/CHF chart currently exhibits a bullish overall momentum, indicating an upward trend. According to your analysis, the price could potentially experience a bullish bounce off the 1st support level and head towards the 1st resistance.
The 1st support level at 0.8605 is identified as an overlap support and is reinforced by the presence of the 61.80% Fibonacci Projection. This suggests that it has historical significance and could potentially act as a strong support level where buying interest may emerge.
The 2nd support level at 0.8555 is described as a pullback support and is associated with the 100% Fibonacci Projection, further emphasizing its importance as a potential support zone.
On the resistance side, the 1st resistance level at 0.8650 is categorized as an overlap resistance, indicating that it represents a historical point where the price has encountered resistance in the past.
The 2nd resistance level at 0.8695 is identified as a multi-swing high resistance, suggesting that it is another historical level where the price has faced resistance.
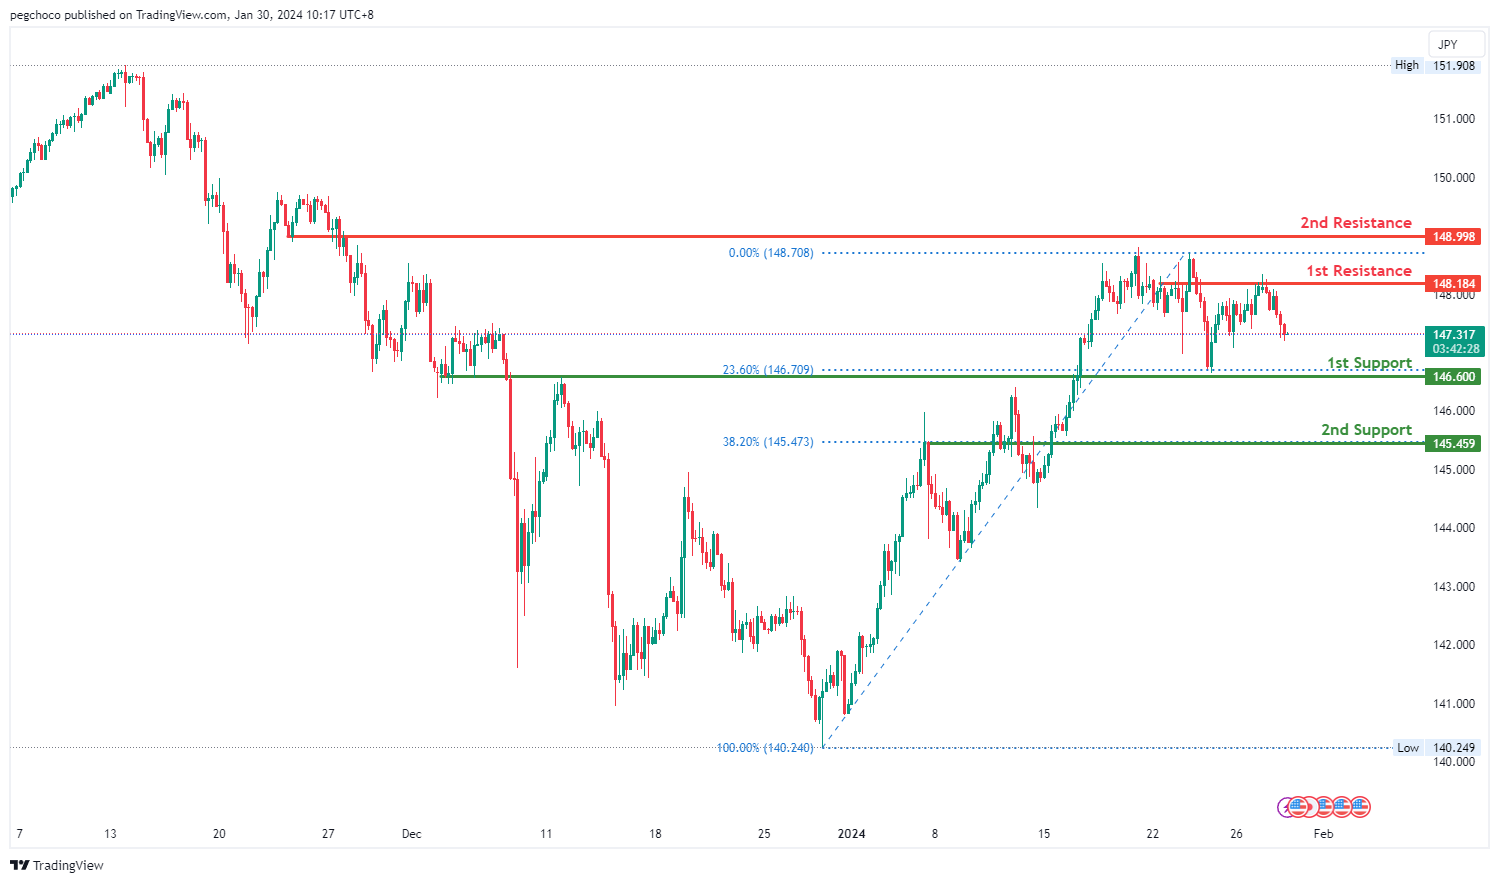
USD/JPY:
The USD/JPY chart currently demonstrates a bearish overall momentum, indicating a downward trend. According to your analysis, the price could potentially continue its bearish movement towards the 1st support level.
The 1st support level at 146.60 is identified as an overlap support and is reinforced by the presence of the 23.60% Fibonacci Retracement. This suggests that it has historical significance and could potentially act as a strong support level where buying interest may emerge.
The 2nd support level at 145.45 is described as a pullback support and is associated with the 38.20% Fibonacci Retracement, further emphasizing its importance as a potential support zone.
On the resistance side, the 1st resistance level at 148.99 is categorized as pullback resistance, suggesting that it represents a historical point where the price has encountered resistance in the past.
The 2nd resistance level at 148.18 is identified as an overlap resistance, indicating that it is another historical level where the price has faced resistance.
USD/CAD:
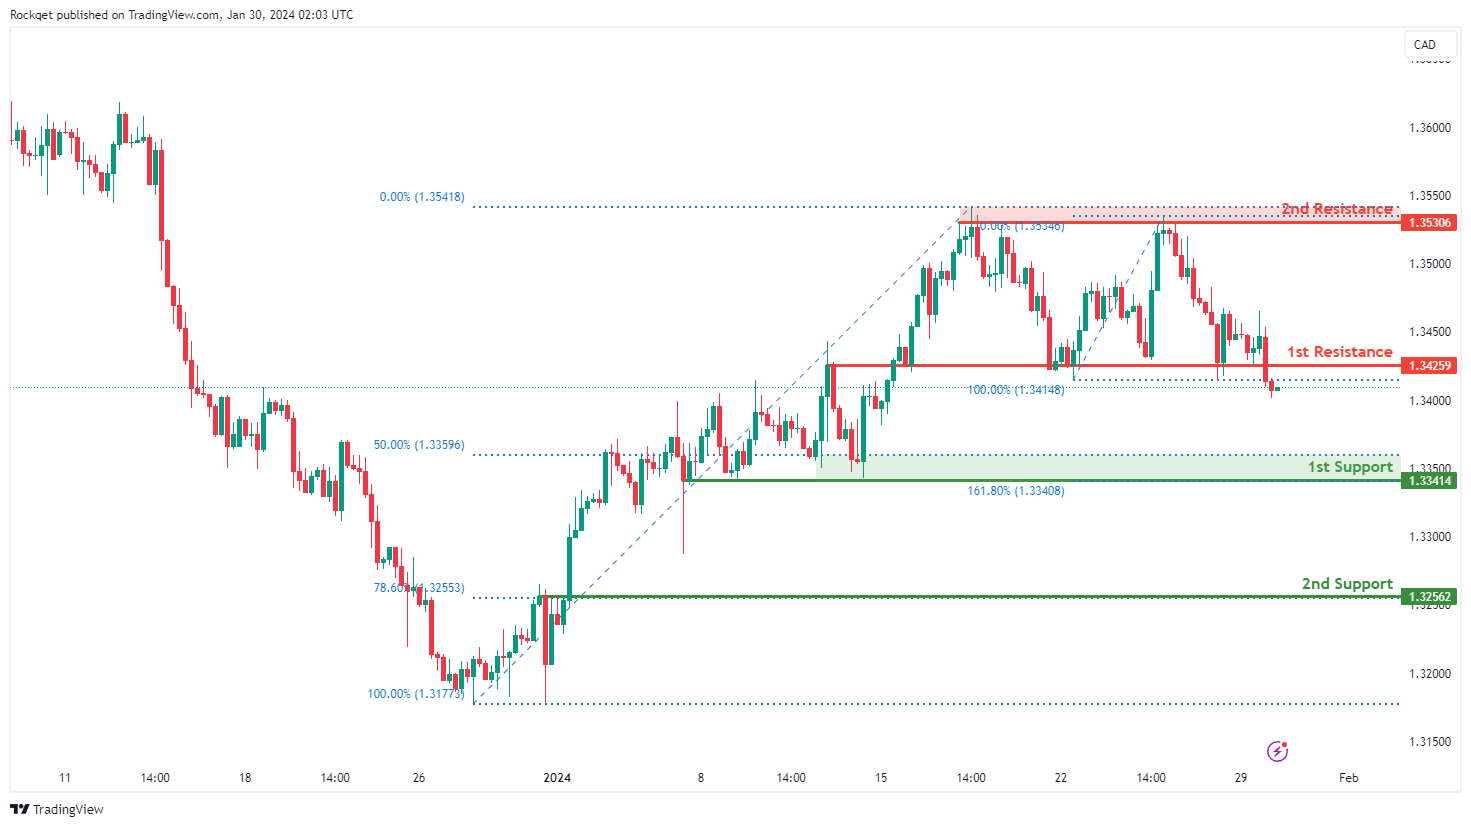
The USD/CAD chart analysis suggests a bearish overall momentum, indicating a downward trend. According to your analysis, there is potential for a bearish continuation towards the 1st support level.
The 1st support level at 1.3341 is identified as a multi-swing low support and is reinforced by the presence of the 50% Fibonacci Retracement. This suggests that it has historical significance and could potentially act as a strong support level where buying interest may emerge.
The 2nd support level at 1.3256 is described as a pullback support and is associated with the 78.60% Fibonacci Retracement, further emphasizing its importance as a potential support zone.
On the resistance side, the 1st resistance level at 1.3425 is categorized as a pullback resistance, indicating that it is a historical level where the price has encountered resistance in the past.
The 2nd resistance level at 1.3530 is identified as a multi-swing high resistance, suggesting that it represents another historical point where the price has faced resistance.
AUD/USD:
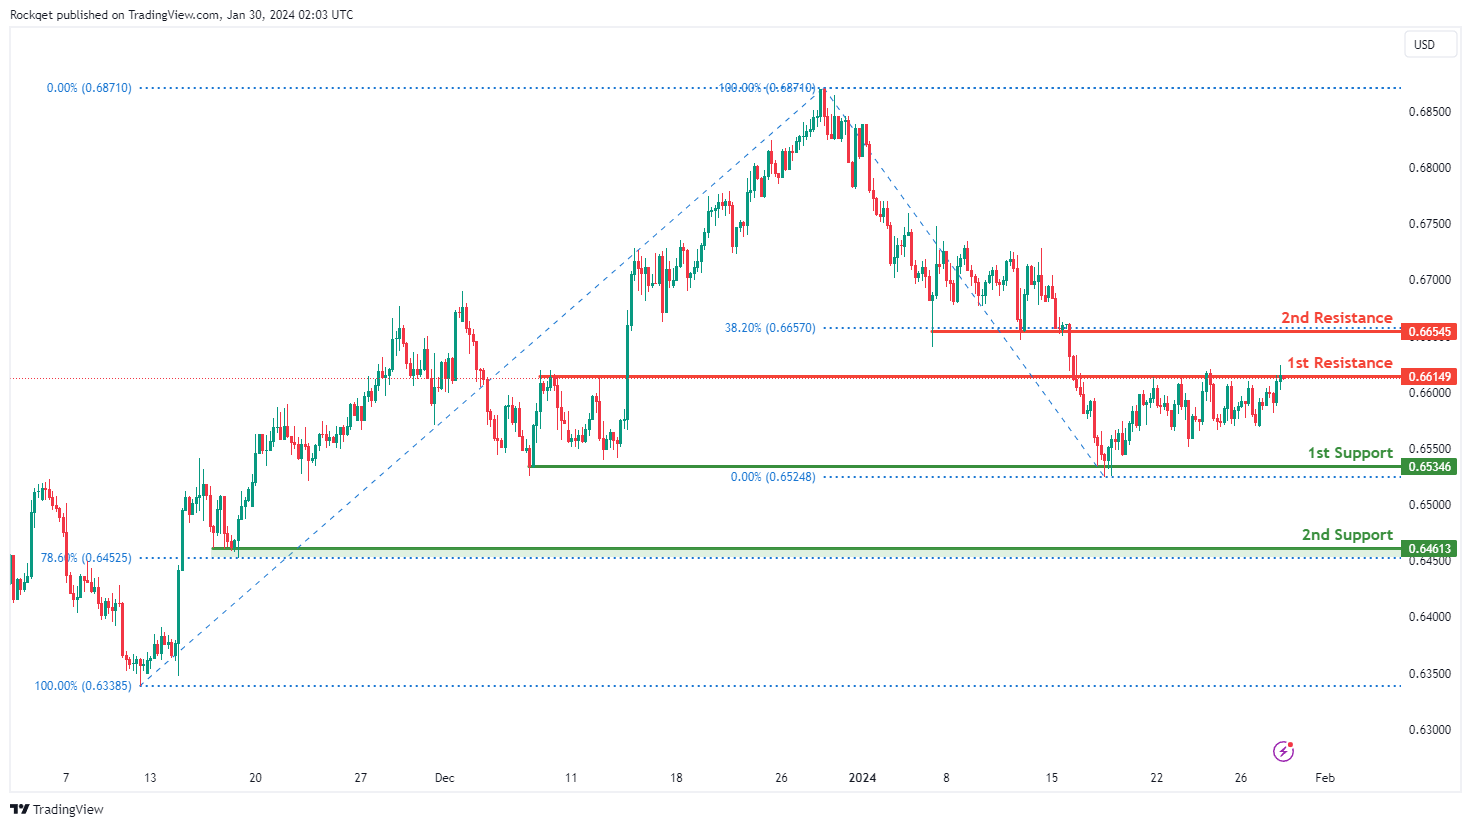
The AUD/USD chart analysis indicates a bearish overall momentum, suggesting a downward trend. Based on your analysis, there is potential for a bearish reaction off the 1st resistance level, leading to a drop towards the 1st support.
The 1st support level at 0.6534 is identified as a multi-swing low support and is reinforced by the presence of the 38.20% Fibonacci Retracement. This suggests that it has historical significance and could potentially act as a strong support level where buying interest may emerge.
Additionally, there is another 1st support level at 0.6461, which is also described as a multi-swing low support and is associated with the 78.60% Fibonacci Retracement, further emphasizing its importance as a potential support zone.
On the resistance side, the 1st resistance level at 0.6614 is categorized as an overlap resistance, indicating that it represents a historical point where the price has encountered resistance in the past.
The 2nd resistance level at 0.6654 is identified as a pullback resistance and is linked to the 38.20% Fibonacci Retracement, suggesting that it is another significant level of resistance.
NZD/USD
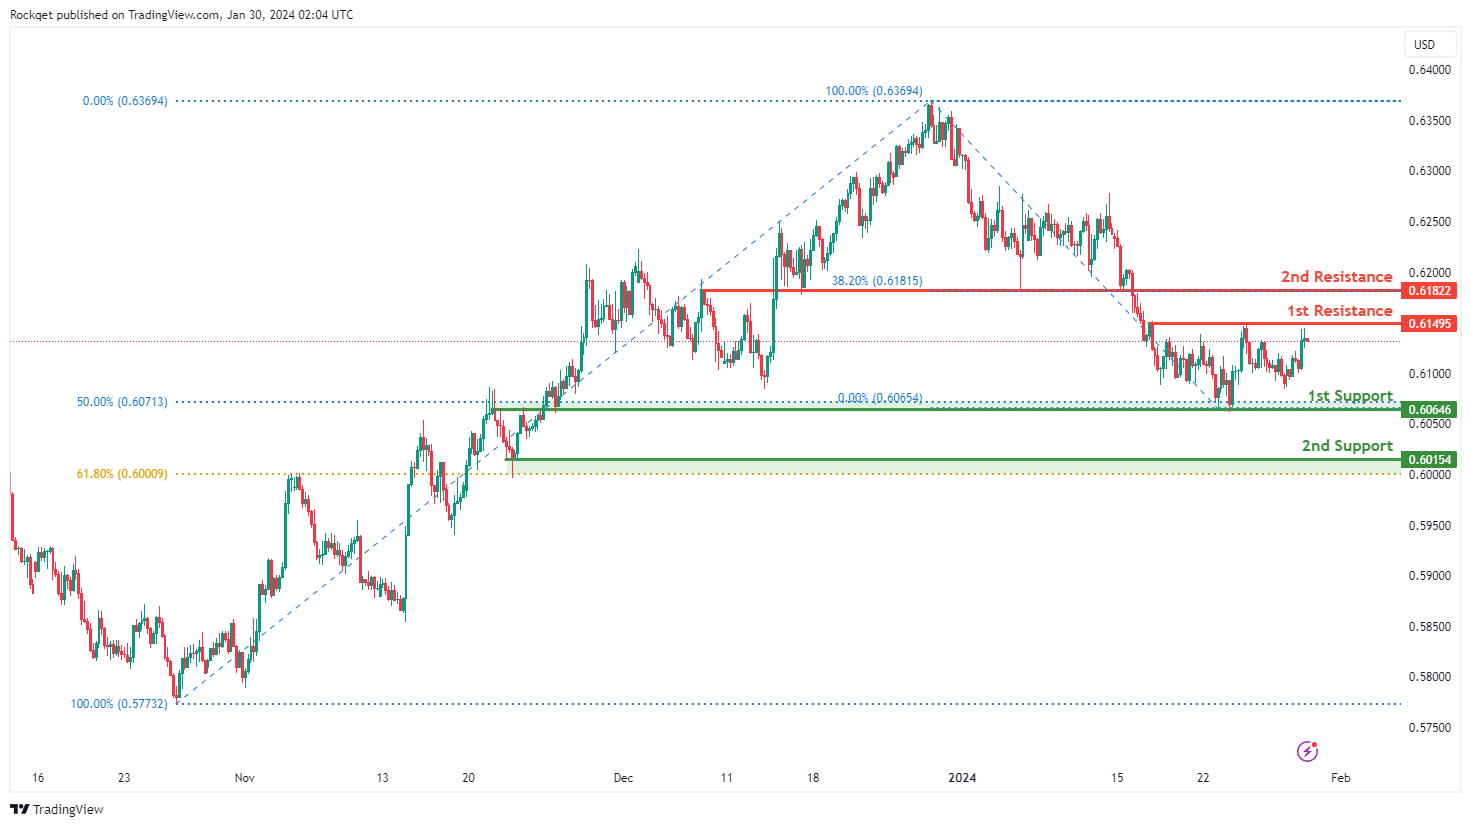
The analysis of the NZD/USD chart suggests a neutral overall momentum, indicating a lack of a clear trend at the moment. Based on this assessment, there is a potential for price to fluctuate between the 1st resistance and 1st support levels.
The 1st support level at 0.6064 is identified as an overlap support and is reinforced by the presence of the 50% Fibonacci Retracement. This suggests that it has historical significance and could potentially act as a support level where buying interest may emerge.
Additionally, there is another 2nd support level at 0.6015, which is also described as an overlap support and is associated with the 61.80% Fibonacci Retracement, further emphasizing its importance as a potential support zone.
On the resistance side, the 1st resistance level at 0.6149 is categorized as a multi-swing high resistance, indicating that it represents a historical point where the price has encountered resistance in the past.
The 2nd resistance level at 0.6182 is identified as a pullback resistance and is linked to the 38.20% Fibonacci Retracement, suggesting that it is another significant level of resistance.
DJ30:
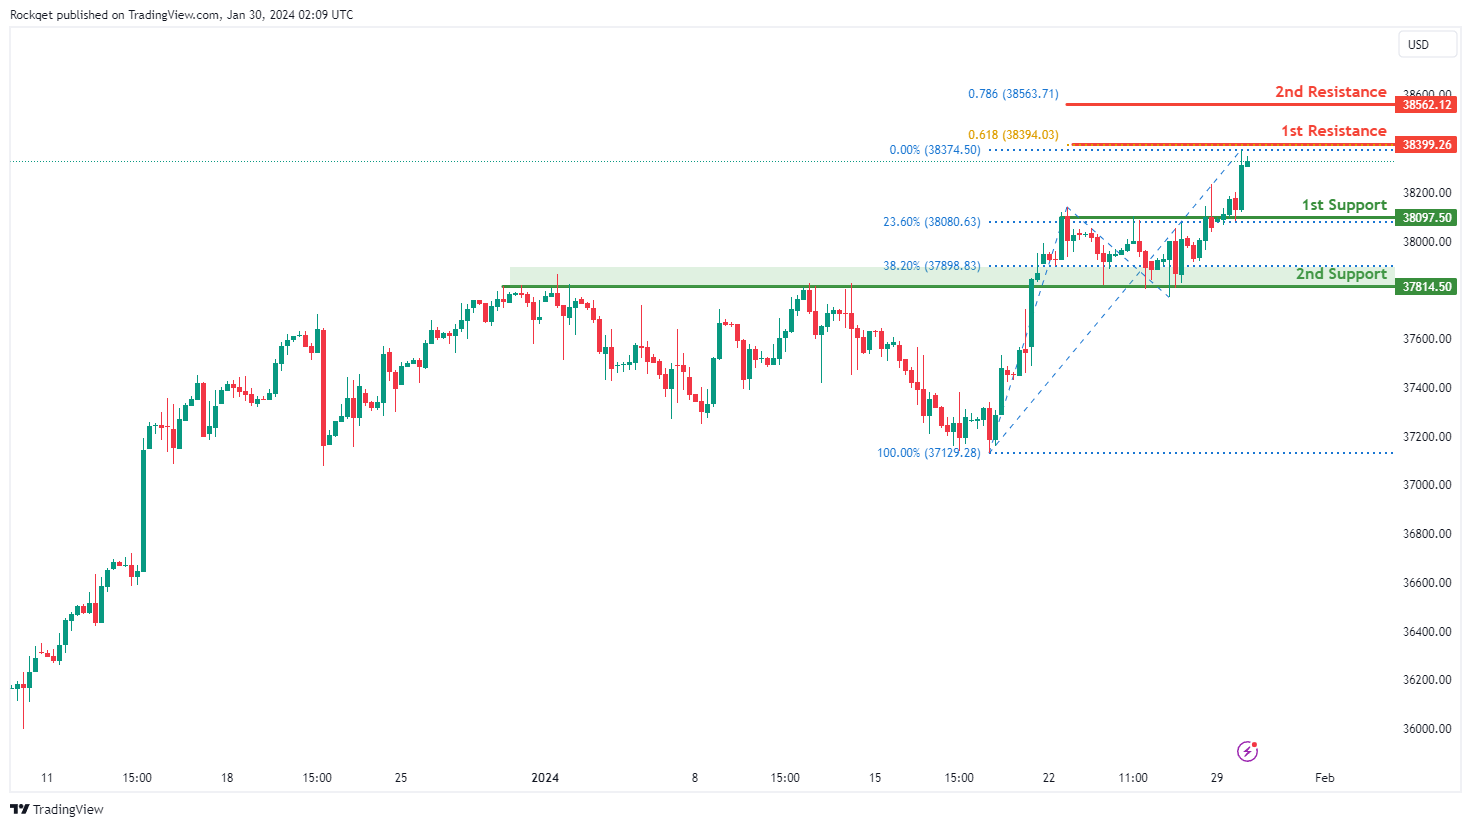
The analysis of the DJ30 (Dow Jones Industrial Average) chart indicates a bullish overall momentum, suggesting an upward trend in the market. Based on this assessment, there is a potential scenario where the price could experience a temporary drop to the 1st support level before bouncing back and rising to the 1st resistance level.
The 1st support level at 38097.49 is identified as an overlap support, indicating that it represents a historical point where the price has found support in the past. Traders often pay attention to such levels as they tend to act as significant support zones.
Additionally, there is a 2nd support level at 37859.32, also categorized as an overlap support, which further reinforces its importance as a potential level where buying interest may emerge.
On the resistance side, the 1st resistance level at 38367.49 is described as a swing high resistance. This level is noteworthy as it is associated with the 161.80% Fibonacci Extension and the 61.80% Fibonacci Projection, indicating Fibonacci confluence. Such confluence can make this resistance level particularly significant.
The 2nd resistance level at 38562.12 is also marked by the presence of the 78.60% Fibonacci Projection, which adds to its relevance as a potential area of resistance.
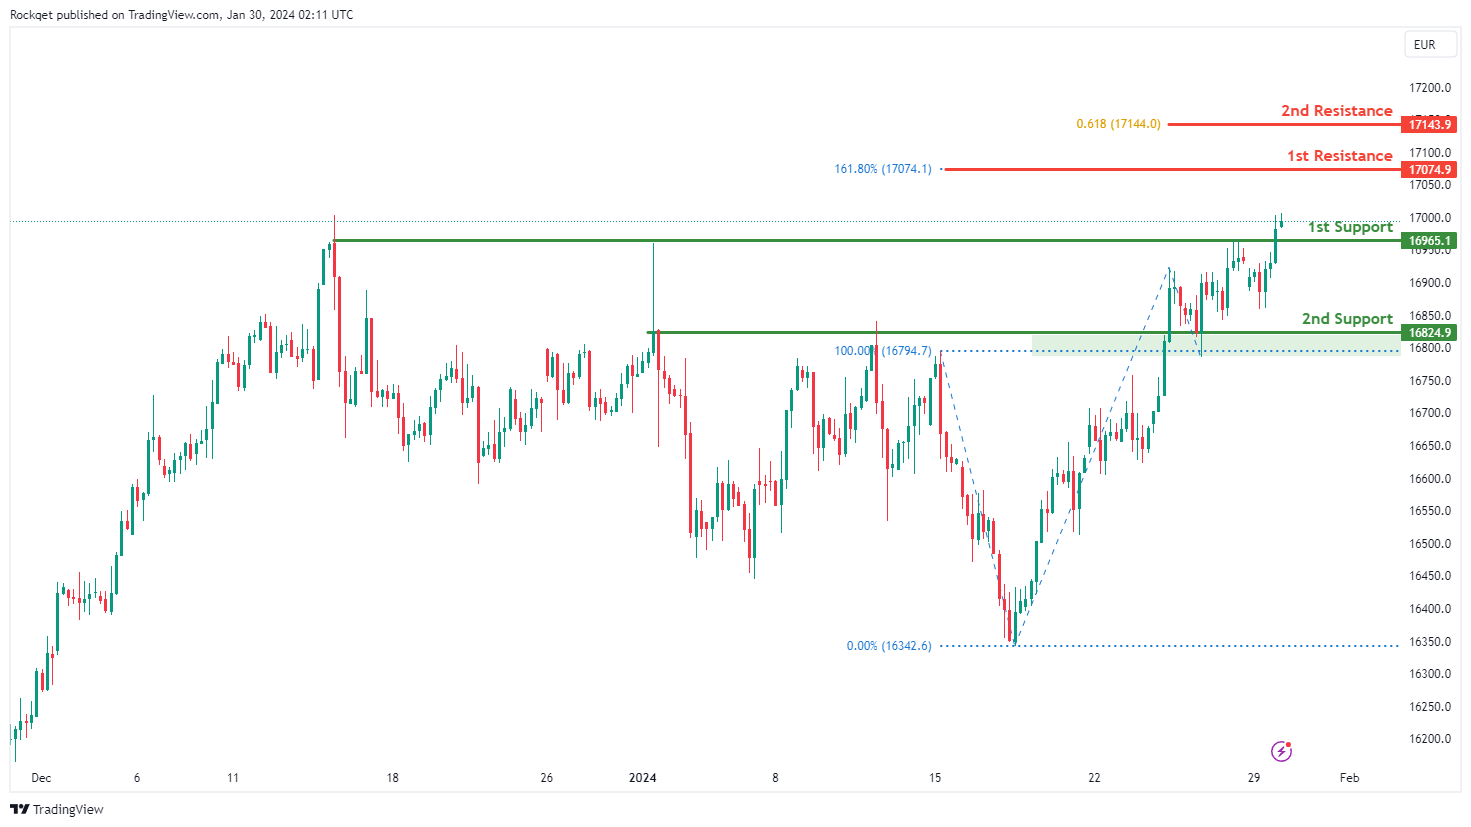
GER40:
The GER40 (DAX) chart currently exhibits an overall bullish momentum, indicating a prevailing upward trend. In this context, there is a potential scenario for price rise towards the 1st resistance.
The 1st resistance at 17,074.90 is identified as a resistance level that aligns with the 161.80% Fibonacci Extension level. Higher up, the 2nd resistance level at 17,143.90 is noted as a resistance level that aligns with the 61.80% Fibonacci Projection level, indicating a potential barrier against further upward movement.
On the support side, the 1st support level at 16,965.10 is identified as a pullback support. Further below, the 2nd support level at 16,824.90 is marked as an overlap support, further reinforcing its importance as a key support zone.
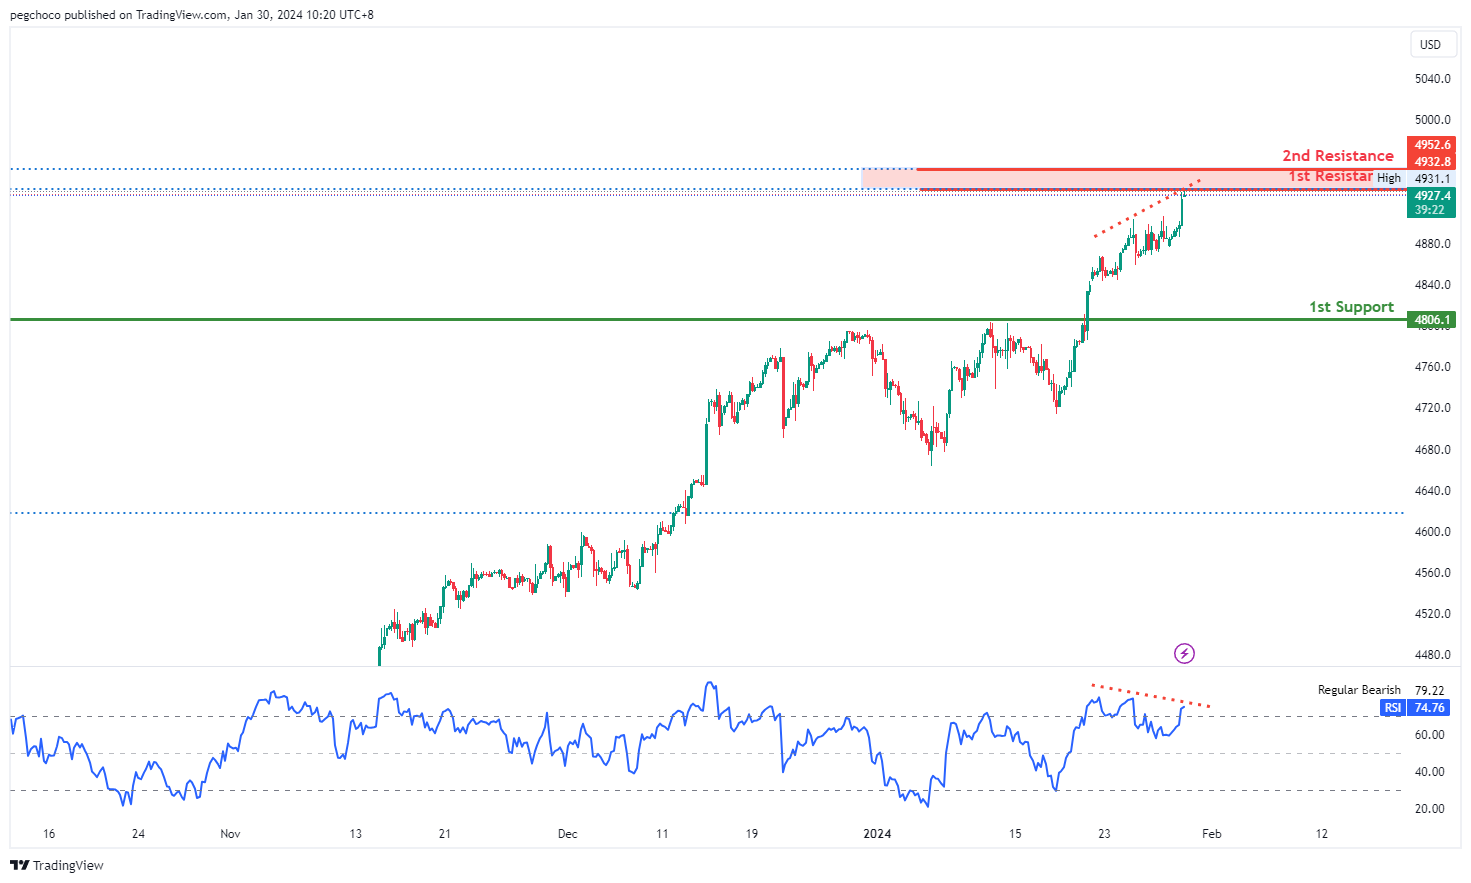
US500:
The US500 (S&P 500) chart analysis reveals a weak bearish overall momentum with low confidence, implying a potential downward trend. As per your analysis, the price might undergo a bearish reaction off the 1st resistance and drop towards the 1st support.
The 1st support level at 4806.1 is considered a pullback support. This level has significance as it could serve as a potential support area where buyers may intervene, preventing further downside movement.
On the resistance front, the 1st resistance level at 4932.8 is located at the 161.80% Fibonacci Extension. This level holds importance as Fibonacci extensions are often seen as potential resistance areas where selling pressure may emerge.
The 2nd resistance level at 4952.6 corresponds to the 78.60% Fibonacci Projection, suggesting it could act as another potential resistance point.
Additionally, it’s worth noting that the RSI (Relative Strength Index) displays bearish divergence compared to price action. This occurs when the RSI forms lower highs while the price forms higher highs, signaling potential weakening of the bullish momentum and the possibility of a reversal.
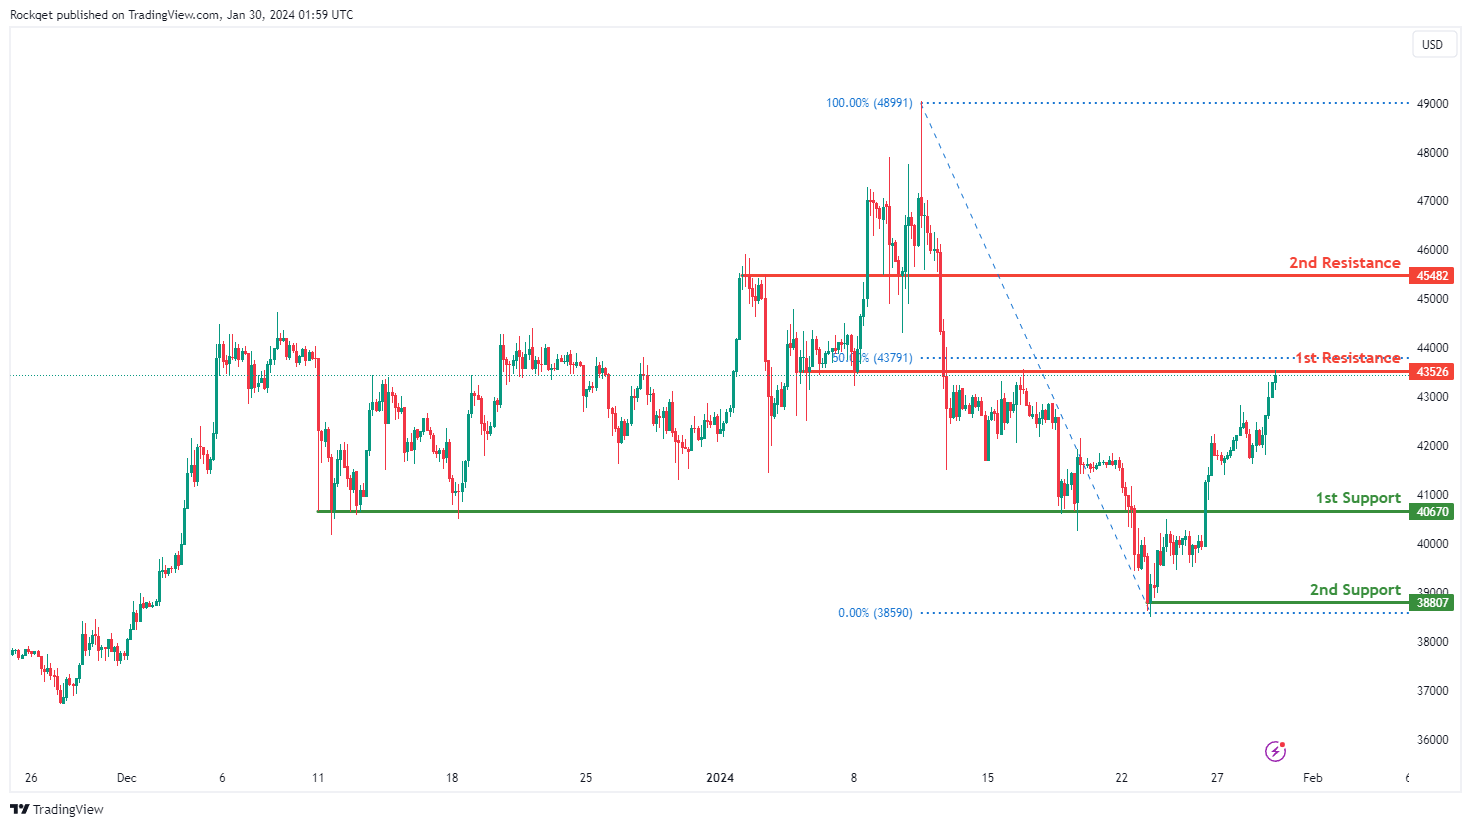
BTC/USD:
The BTC/USD (Bitcoin) chart currently exhibits an overall bullish momentum. In this context, there is a potential scenario for price to make a bullish rise towards the 1st resistance.
The 1st resistance level at 43,526.00 is identified as an overlap resistance that aligns close to the 50.00% Fibonacci Retracement level. Higher up, the 2nd resistance level at 45,482.00 is also marked as an overlap resistance, further highlighting its importance as a potential resistance point.
On the support side, the 1st support level at 40,670.00 is identified as a pullback support. Further below, the 2nd support level at 38,807.00 is noted as a swing-low support, reinforcing its significance as a key support level.
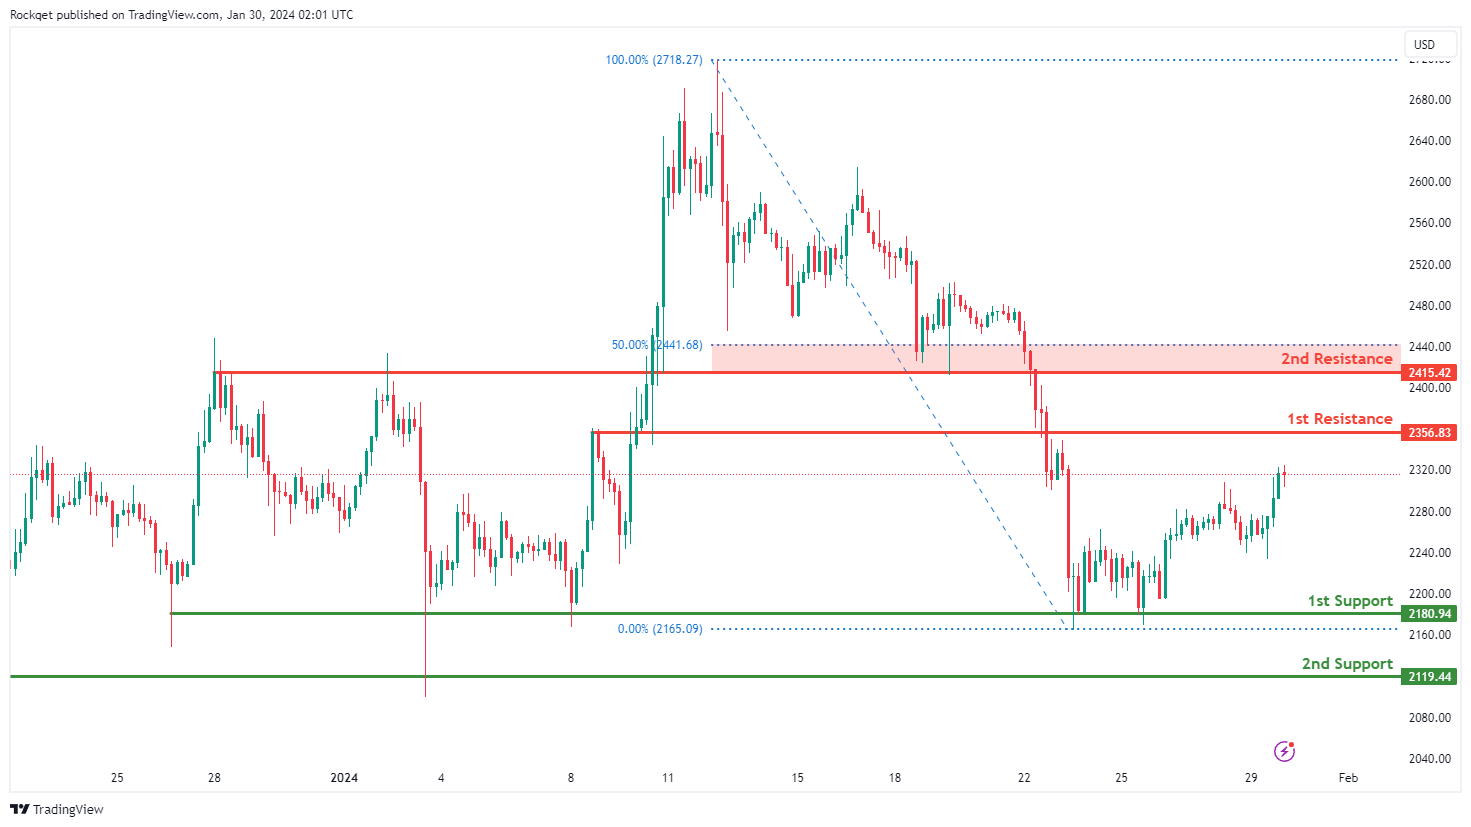
ETH/USD:
The ETH/USD (Ethereum) chart currently exhibits a neutral bias. In this context, there is a potential scenario for price to fluctuate between the 1st support and the 1st resistance.
The 1st support level at 2,180.94 is identified as a pullback support. Further below, the 2nd support level at 2,119.44 is noted as an overlap support, reinforcing its significance as a key support level.
On the resistance side, the 1st resistance level at 2,356.83 is identified as a pullback resistance. Higher up, the 2nd resistance level at 2,415.42 is marked as an overlap resistance that aligns close to the 50.00% Fibonacci Retracement level, further highlighting its importance as a potential resistance point.
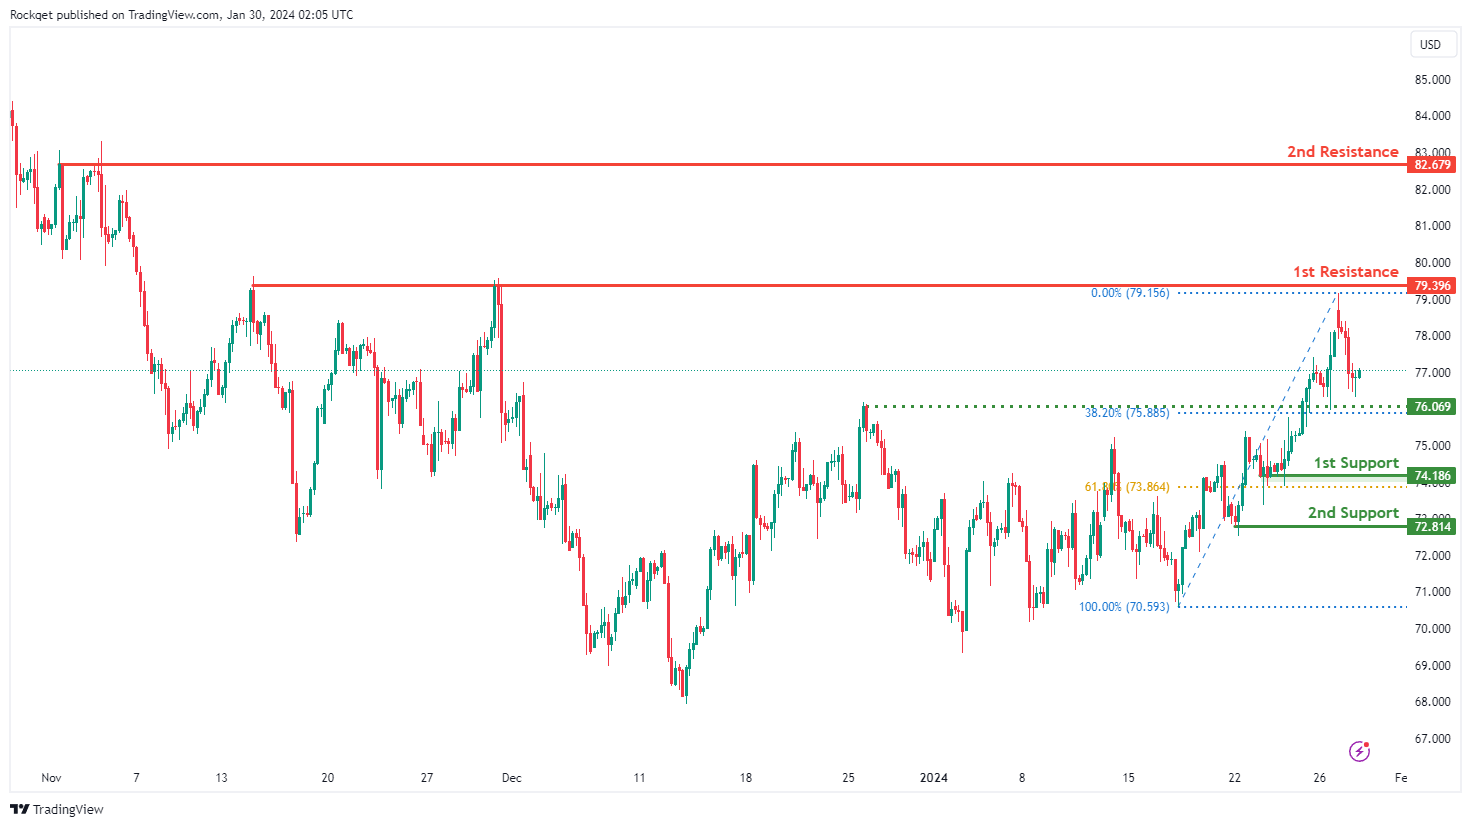
WTI/USD:
The WTI (West Texas Intermediate) chart currently exhibits an overall bullish momentum. In this context, there is a potential scenario for price to make a bullish rise towards the 1st resistance.
The 1st resistance level at 79.39 is identified as a multi-swing-high resistance. Higher up, the 2nd resistance level at 82.67 is noted as a pullback resistance, further highlighting its importance as a potential resistance point.
On the support side, the intermediate support level at 76.06 is identifed as an overlap support that aligns close to the 38.20% Fibonacci Retracement leve while the 1st support level at 74.186 is noted as a pullback support that aligns close to the 61.80% Fibonacci Retracement level. Further below, the 2nd support level at 72.81 is marked as a pullback support, reinforcing its significance as a key support level.
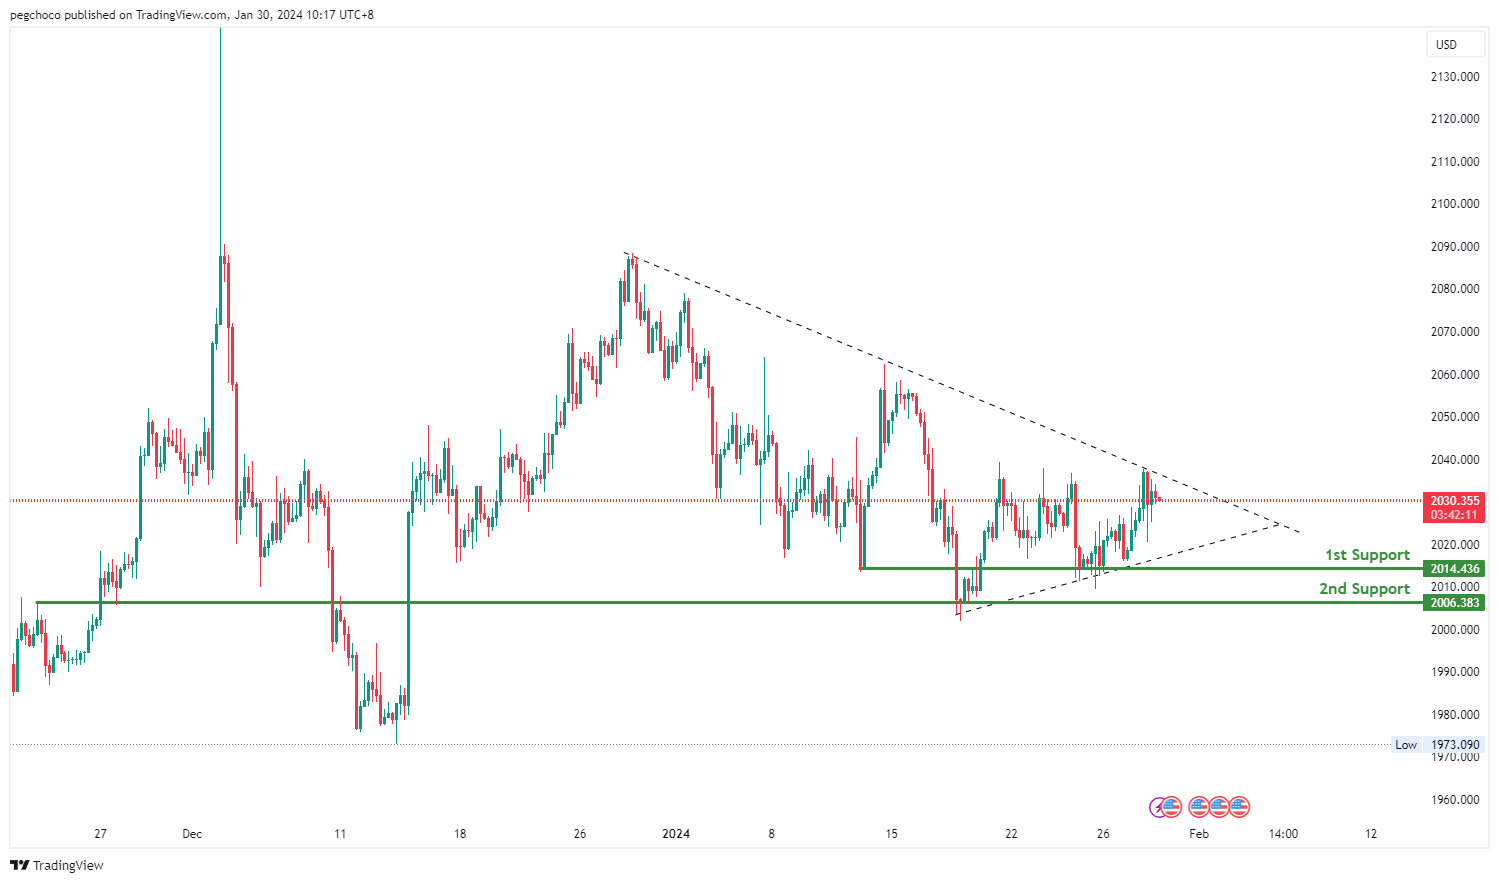
XAU/USD (GOLD):
The XAUUSD (Gold/USD) chart analysis points to a bearish overall momentum, indicating a downward trend. Based on your analysis, there is a potential for a bearish continuation towards the 1st support level.
The 1st support level at 2014.43 is identified as an overlap support, suggesting historical significance. This level may act as a strong support zone where buying interest could potentially emerge.
The 2nd support level at 2006.38 is described as a swing low support, reinforcing its role as a potential support area.
On the resistance side, the 1st resistance level at 2038.13 is categorized as an overlap resistance, indicating a historical point where price has encountered resistance.
The 2nd resistance level at 2057.41 is also identified as an overlap resistance, further emphasizing its potential role as a significant barrier to upward movement.
Additionally, you mentioned the presence of a symmetrical triangle chart pattern. Symmetrical triangles represent a period of consolidation where price moves within converging trendlines. A breakout above the upper trendline suggests a bullish breakout, while a breakdown below the lower trendline indicates a bearish breakdown. Traders often watch for these breakout or breakdown signals to help determine the future direction of the price.


