
Bearish Scenario: Selling below 0.6516 with TP1: 0.65, TP2: 0.6487, and upon its breakout TP3: 0.6469. It is recommended to place a stop loss above 0.6541, at least 1% of the account capital. Trailing stop can be used.
Bullish Scenario: Buying above 0.6540 with TP1: 0.6572, TP2: 0.6594, and TP3: 0.66. It is recommended to set a stop loss (S.L.) below 0.6520 or at least 1% of the account capital.
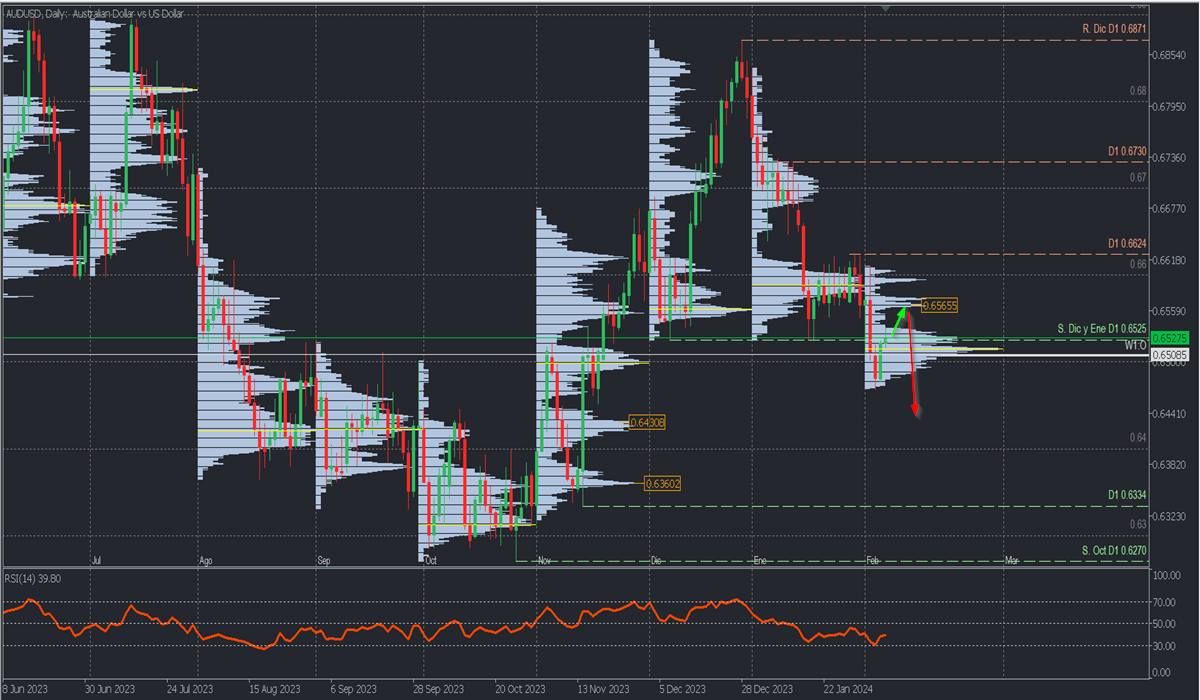
Analysis from Daily Chart. Volume Profile and Structure.
AUDUSD may be facing a reversal of the bullish trend from the last quarter of 2023, with the breakdown of the December and January support at 0.6525, leaving resistance at 0.6624. The current correction may still extend towards the high volume node around 0.6565, to resume sales towards one of the high volume nodes of November at 0.6430 and the round level 0.64. This scenario will be active as long as the retracement does not break above 0.66 and the resistance at 0.6624. The RSI positioned in negative territory confirms a bearish momentum for the pair.
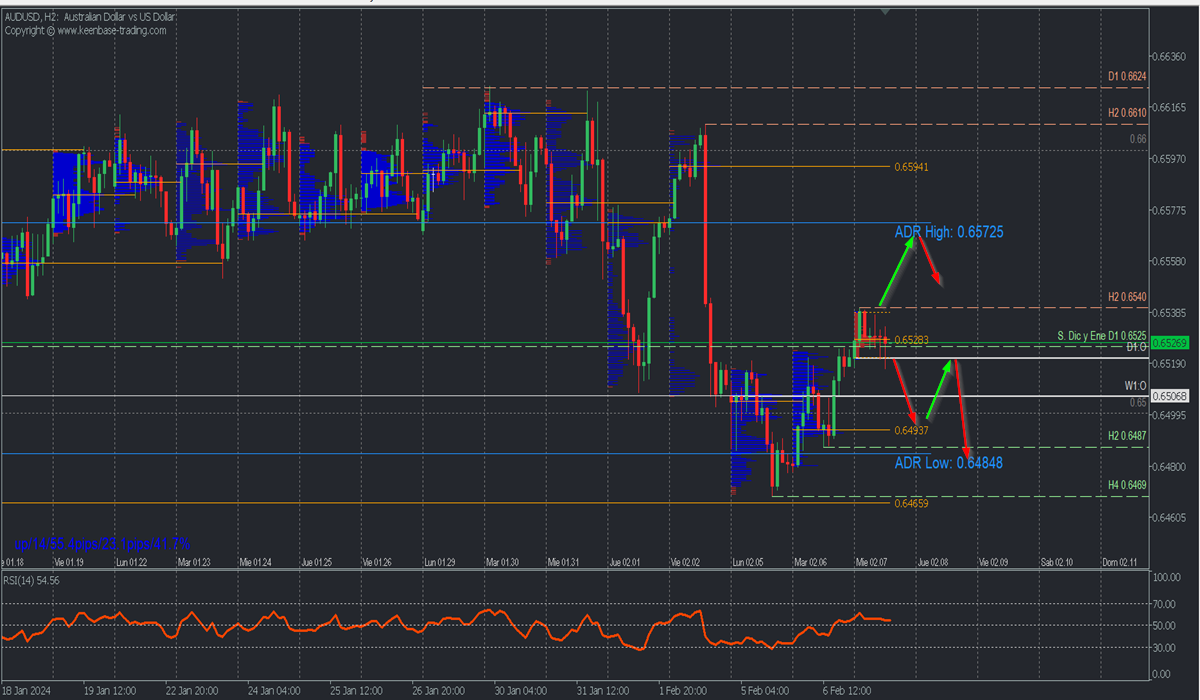
Scenario from H2 Chart.
The current correction leaves a local resistance at 0.6540, whose decisive breakout will extend purchases towards the daily bullish average range at 0.6572, opening the door to reach Friday’s uncovered POC at 0.6594, thus covering the volume inefficiency or volume gap left by Friday’s decline. This is a selling zone that will encourage bearish entry to resume pair sales.
On the other hand, an anticipated bearish scenario will be activated with quotes below the broken support at 0.6525 towards Tuesday’s uncovered POC at 0.6493, whose breakout in a second touch will break the correction support at 0.6487, indicating a continued decline towards the next support and buying zone around 0.6466.
*Uncovered POC: POC = Point of Control: It is the level or zone where the highest volume concentration occurred. If there was previously a downward movement from it, it is considered a selling zone and forms a resistance zone. Conversely, if there was previously an upward impulse, it is considered a buying zone, usually located at lows, forming support zones.
Risk Management Consideration:
**It is very important that risk management be based on capital and traded volume. For this, a maximum risk of 1% of the capital is recommended. It is suggested to use risk management indicators like Easy Order.


