
DXY:
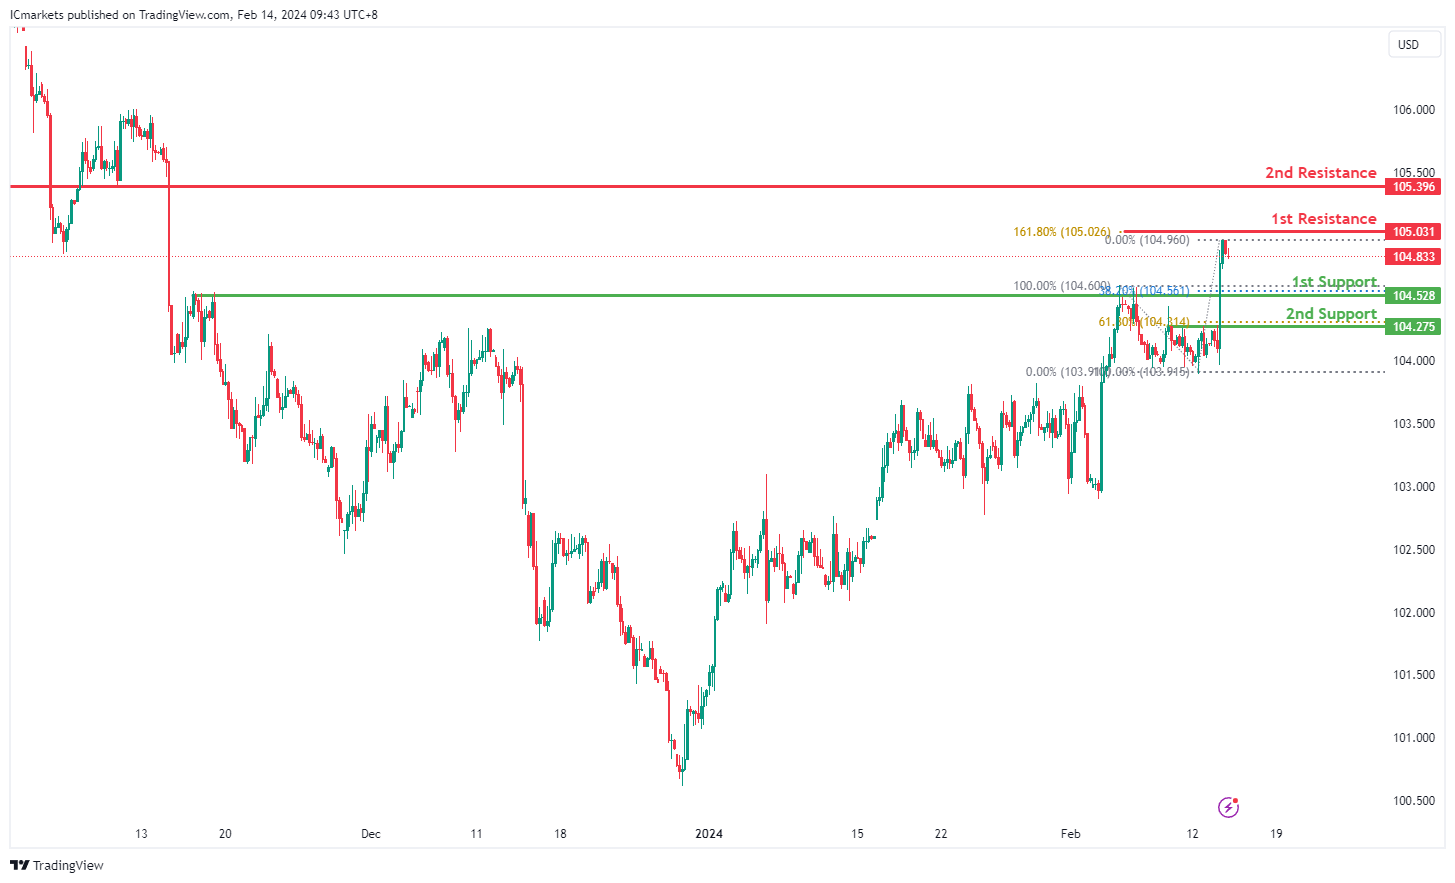
The DXY chart currently exhibits a bearish momentum, indicating a potential continuation of the downward trend.
The 1st support level at 104.52 is identified as a pullback support, coinciding with the 38.20% Fibonacci Retracement level. This level suggests historical significance, where buyers might step in to prevent further decline.
Additionally, the 2nd support at 104.27 aligns with the 61.80% Fibonacci Retracement level, further reinforcing its importance as a potential support zone.
On the resistance side, the 1st resistance is noted at 105.03, characterized by the presence of the 161.80% Fibonacci Extension. This level signifies a historical point of potential resistance where selling pressure may intensify.
Similarly, the 2nd resistance at 105.39 is identified as a pullback resistance, indicating another area where sellers could exert pressure on the price.
EUR/USD:
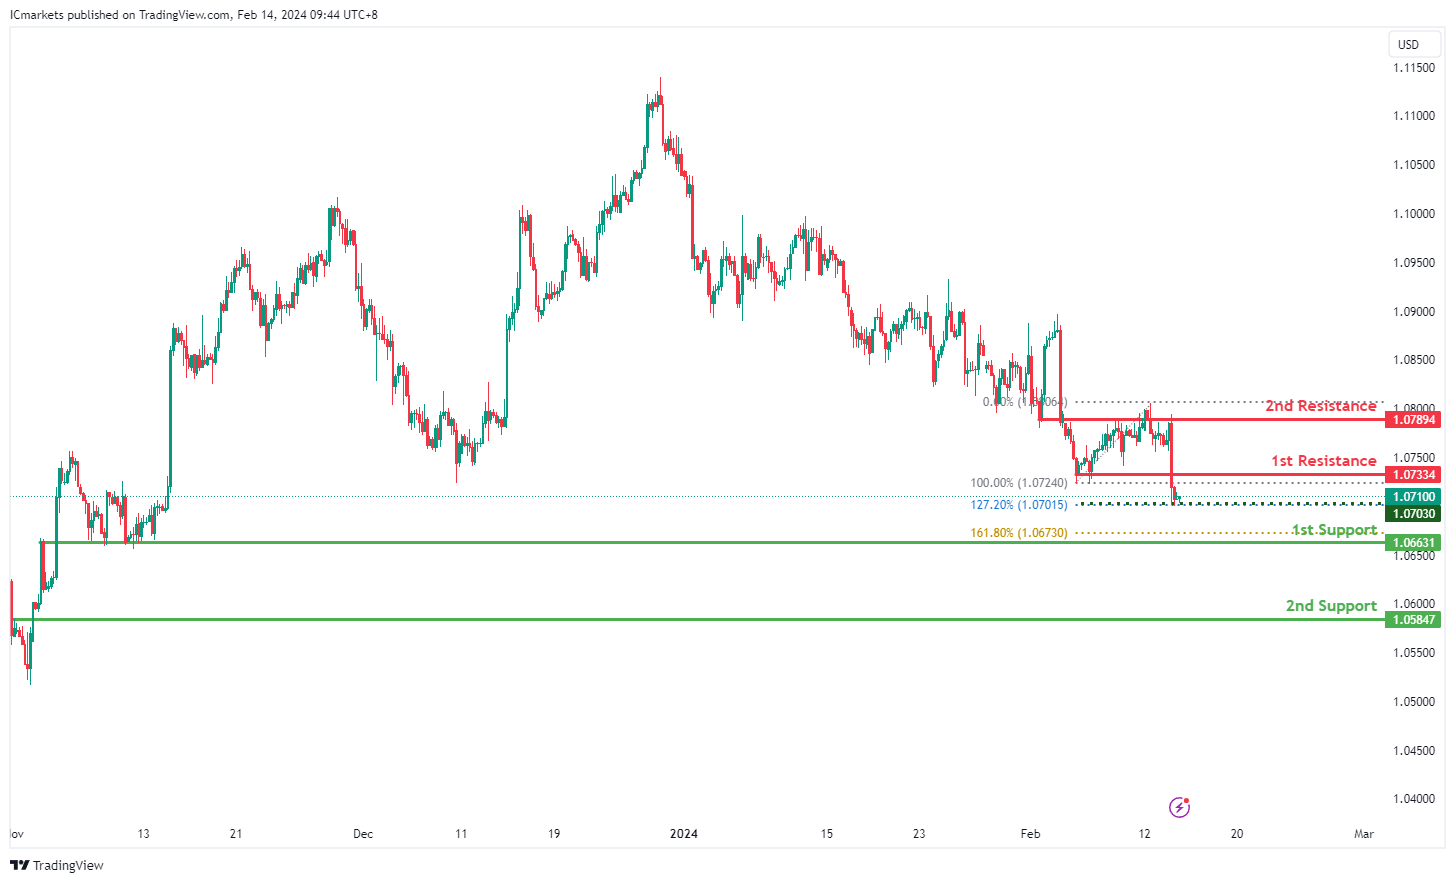
The EUR/USD chart currently demonstrates a bullish momentum, suggesting a potential upward trend.
The 1st support level is situated at 1.0663, characterized by an overlap support and coinciding with the 161.80% Fibonacci Extension level. This level indicates historical significance and potential buying interest, providing a strong foundation for a bullish bounce.
Additionally, the 2nd support at 1.0584 is identified as a pullback support, further reinforcing its importance as a potential area for buyers to step in.
On the resistance side, the 1st resistance level is noted at 1.0733, representing an overlap resistance where selling pressure may emerge.
Similarly, the 2nd resistance at 1.0789 is identified as an overlap resistance, suggesting another potential barrier to further upside movement.
EUR/JPY:
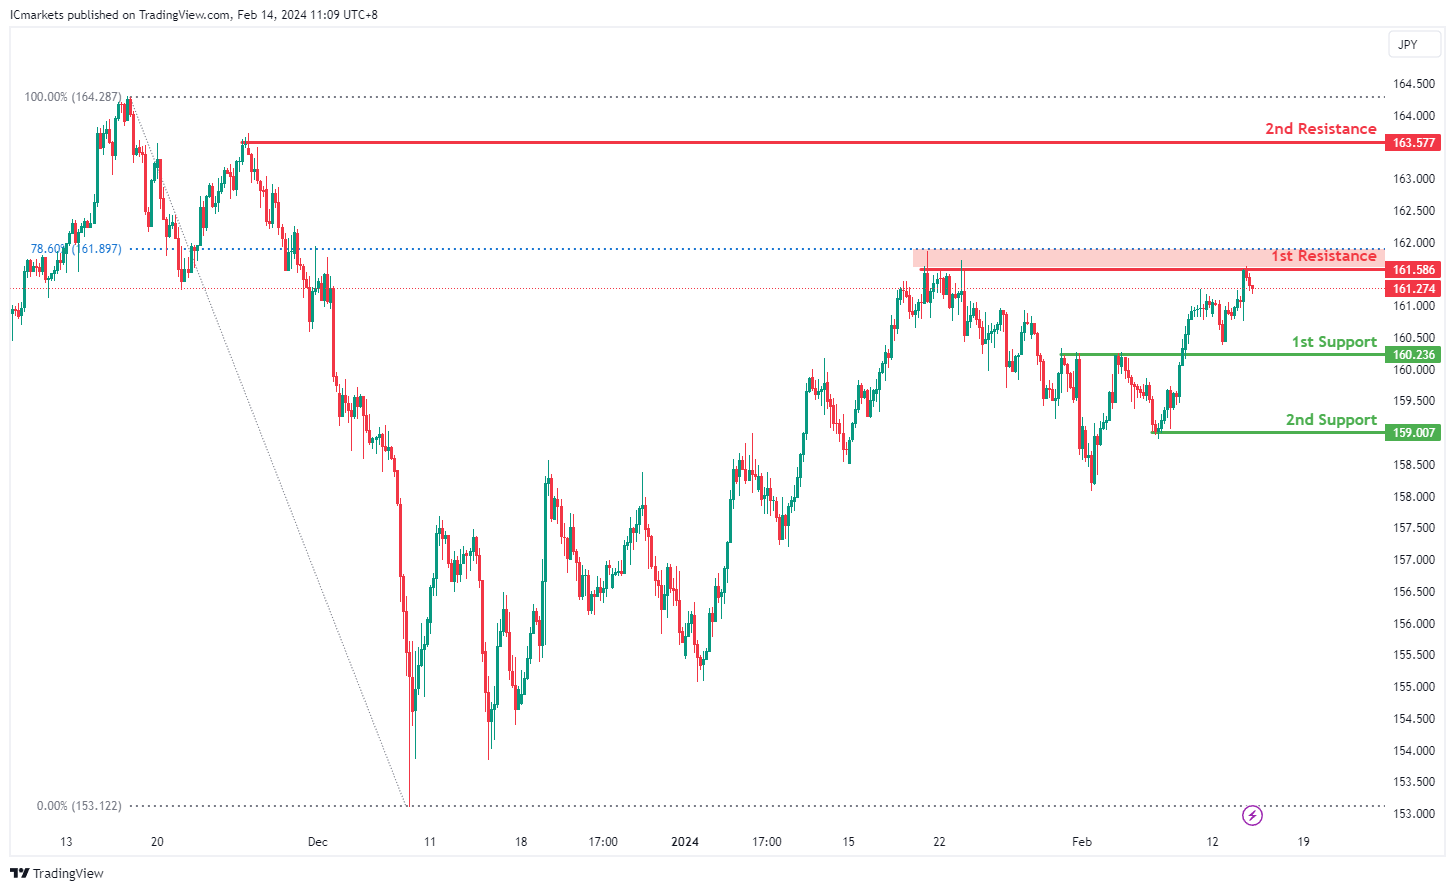
The EUR/JPY chart currently demonstrates a bearish momentum, indicating a prevailing downward trend. Several factors contribute to this bearish sentiment, suggesting the potential for further downward movement in the price.
The 1st support level at 160.236 is considered significant as it represents a pullback support, indicating a historical level where buying interest has previously emerged. Additionally, this level aligns with the 50% Fibonacci Retracement, adding further confluence to its significance. Furthermore, the 2nd support at 159.007 is identified as a swing low support, reinforcing the potential support zone.
On the resistance side, the 1st resistance level at 161.586 is highlighted as a significant barrier where selling pressure may increase, as it coincides with a swing high resistance and the 78.60% Fibonacci Retracement level. Additionally, the 2nd resistance at 163.577 stands as another swing high resistance level, further solidifying the potential resistance zone.
EUR/GBP:
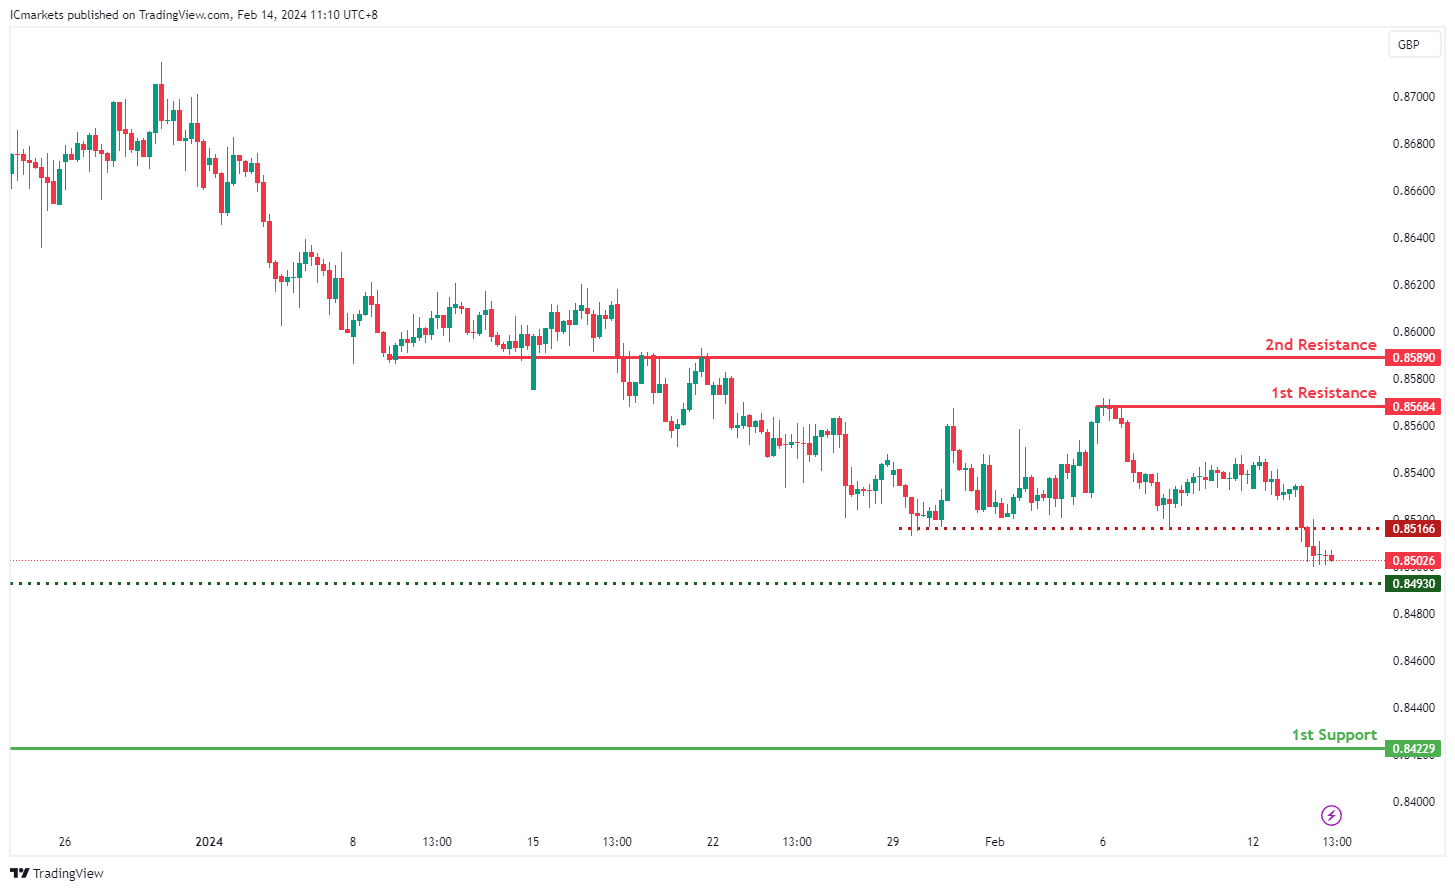
The EUR/GBP chart currently exhibits a bearish overall momentum, suggesting a prevailing downward trend. Several factors contribute to this bearish sentiment, indicating the potential for a continued downward movement in the price.
The identified intermediate support at 0.84930 is deemed significant as it represents an overlap support level, suggesting a historical area where buying interest has previously emerged. Additionally, the 1st support level at 0.84229 coincides with a swing low support, further reinforcing its importance as a potential level where buyers may intervene.
On the resistance side, the 1st resistance level at 0.85684 is highlighted as a significant barrier where selling pressure may intensify, as it aligns with a swing high resistance. Moreover, the 2nd resistance level at 0.85890 is identified as an overlap resistance, suggesting a strong potential resistance zone.
An intermediate resistance at 0.85166 is also recognized, which aligns with an overlap resistance, providing additional reinforcement to the resistance structure.
GBP/USD:
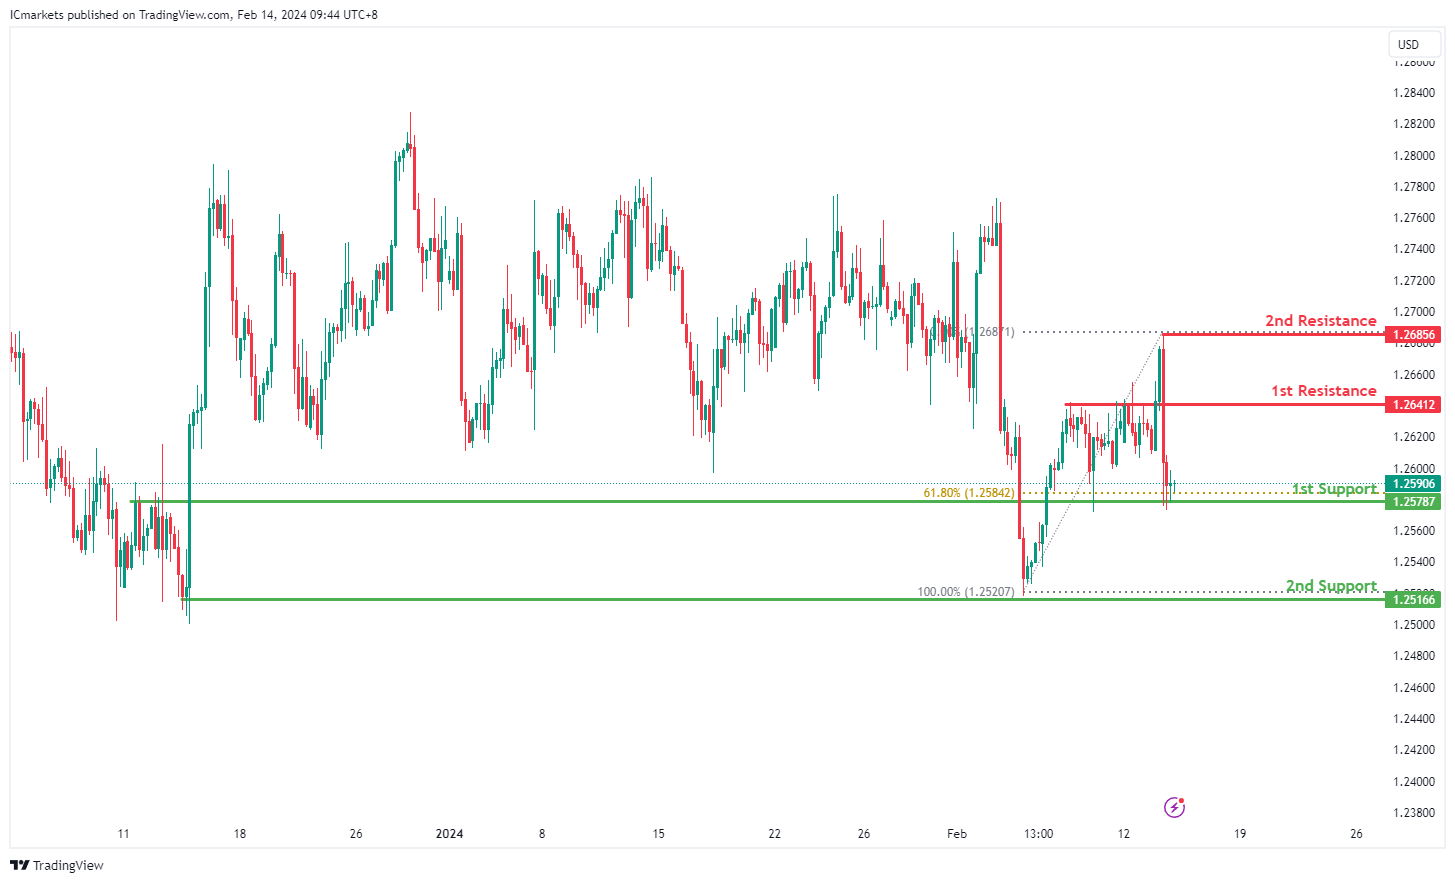
The GBP/USD chart currently indicates a bullish momentum, suggesting a potential upward trend.
The 1st support level is located at 1.2578, characterized by an overlap support and coinciding with the 61.80% Fibonacci Retracement level. This level indicates historical significance and potential buying interest, providing a strong foundation for a bullish bounce.
Additionally, the 2nd support at 1.2516 is identified as a multi-swing low support, further reinforcing its importance as a potential area for buyers to step in.
On the resistance side, the 1st resistance level is noted at 1.2641, representing a pullback resistance where selling pressure may emerge.
Similarly, the 2nd resistance at 1.2685 is identified as a swing high resistance, suggesting another potential barrier to further upside movement.
GBP/JPY:
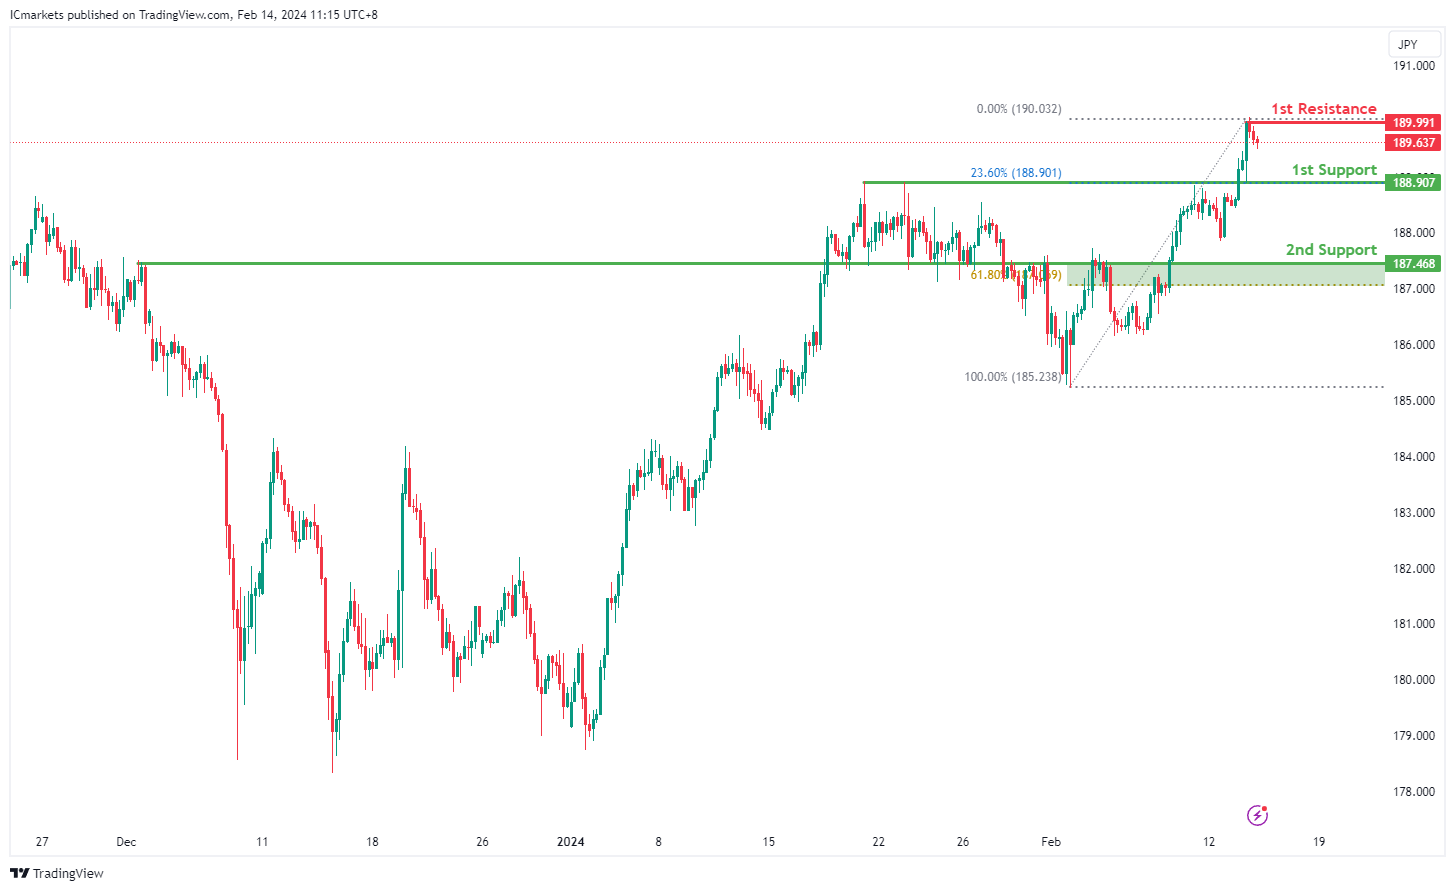
The GBP/JPY chart currently demonstrates a bearish overall momentum, indicating a prevailing downward trend. Several factors contribute to this bearish sentiment, suggesting the potential for a continued decline in price.
The identified 1st support level at 188.907 is considered significant as it represents a pullback support, coinciding with the 23.60% Fibonacci Retracement level. This suggests a historical area where buying interest has previously emerged and aligns with a key Fibonacci level, adding to its significance. Additionally, the 2nd support level at 187.468 is identified as an overlap support, further reinforcing its importance as a potential level where buyers may intervene. This level also coincides with the 61.80% Fibonacci Retracement level, adding confluence to the support zone.
On the resistance side, the 1st resistance level at 189.991 is highlighted as a significant barrier where selling pressure may intensify. This level aligns with a swing high resistance, suggesting a historical point where selling interest has been strong.
USD/CHF:
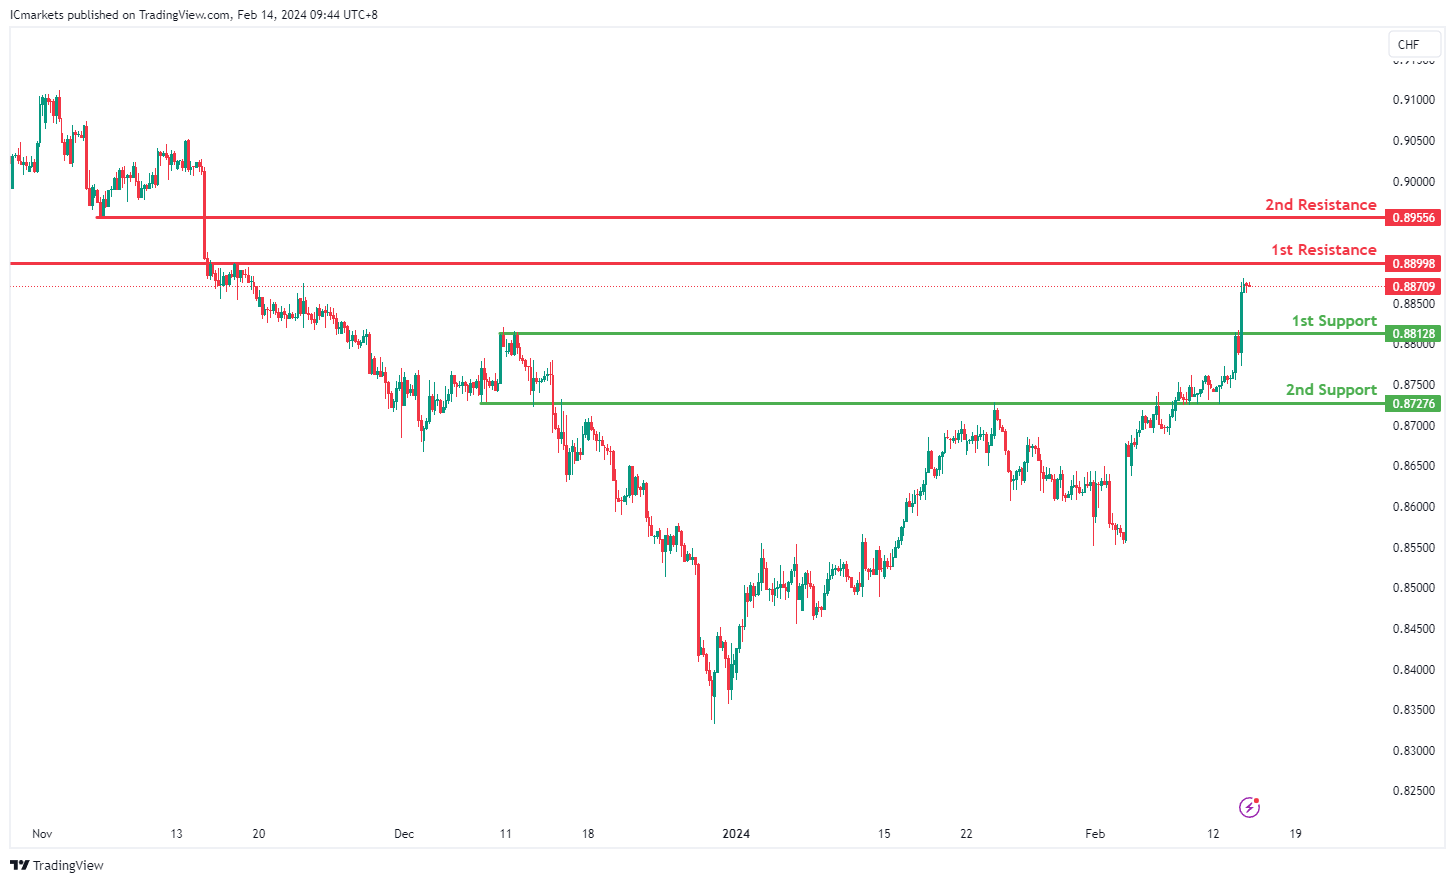
The USD/CHF chart currently indicates a bearish momentum, suggesting a potential downward trend.
The 1st support level is situated at 0.8812, identified as a pullback support. This level may serve as a significant area where buying interest could emerge, potentially halting the downward movement of the price.
Additionally, the 2nd support at 0.8727 is characterized as an overlap support, further reinforcing its potential as a level of support where buyers may intervene.
On the resistance side, the 1st resistance level is noted at 0.8899, representing an overlap resistance. This level may act as a barrier to upward movement, potentially prompting a bearish reaction.
Similarly, the 2nd resistance at 0.8955 is identified as a pullback resistance, indicating another potential area where selling pressure may intensify.
USD/JPY:
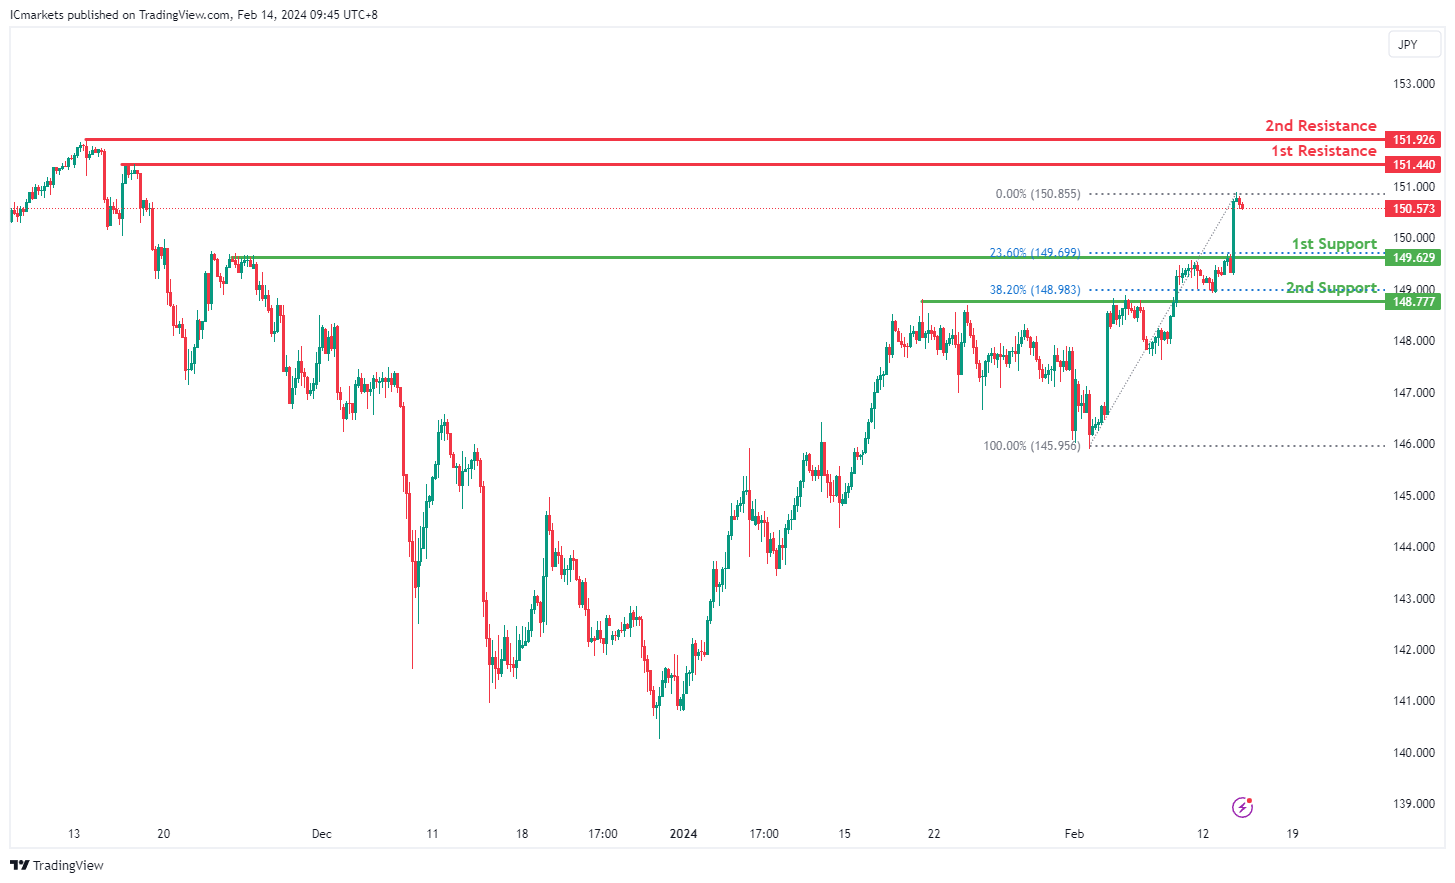
The USD/JPY chart currently exhibits a bearish momentum, suggesting a potential downward trend.
The 1st support level is identified at 149.62, characterized as a pullback support and coinciding with the 23.60% Fibonacci Retracement. This level holds significance as it may attract buying interest, potentially halting the downward movement of the price.
Additionally, the 2nd support at 148.77 is another pullback support, aligned with the 38.20% Fibonacci Retracement, further reinforcing its potential as a level of support.
On the resistance side, the 1st resistance level is noted at 151.44, representing a multi-swing high resistance. This level may act as a barrier to upward movement, potentially triggering a bearish reaction.
Similarly, the 2nd resistance at 151.92 is identified as a swing high resistance, indicating another potential area where selling pressure may intensify.
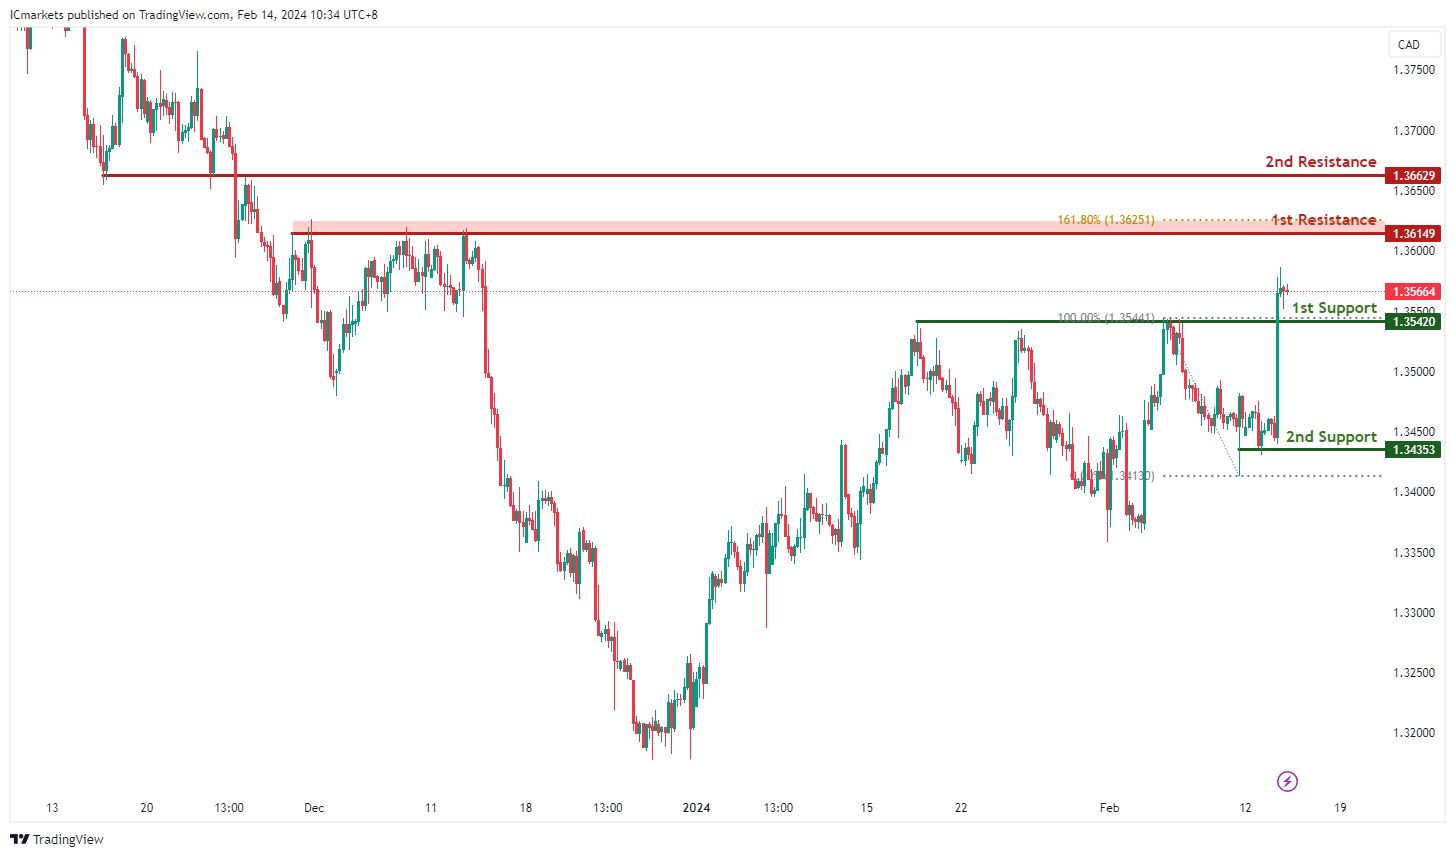
USD/CAD:
The USD/CAD chart currently exhibits an overall bullish momentum. In this context, there is a potential scenario for price to make a bullish bounce off the 1st support and resume to uptrend towards the 1st resistance.
The 1st support level at 1.3542 is identified as a pullback support. Further below, the 2nd support level at 1.3435 is also marked as a pullback support, further emphasizing its importance as a potential support zone.
To the upside, the 1st resistance level at 1.3614 is identified as a pullback resistance that aligns close to the 161.80% Fibonacci Extension level. Higher up, the 2nd resistance level at 1.3662 is noted as an overlap resistance, further highlighting its importance as a potential resistance point.
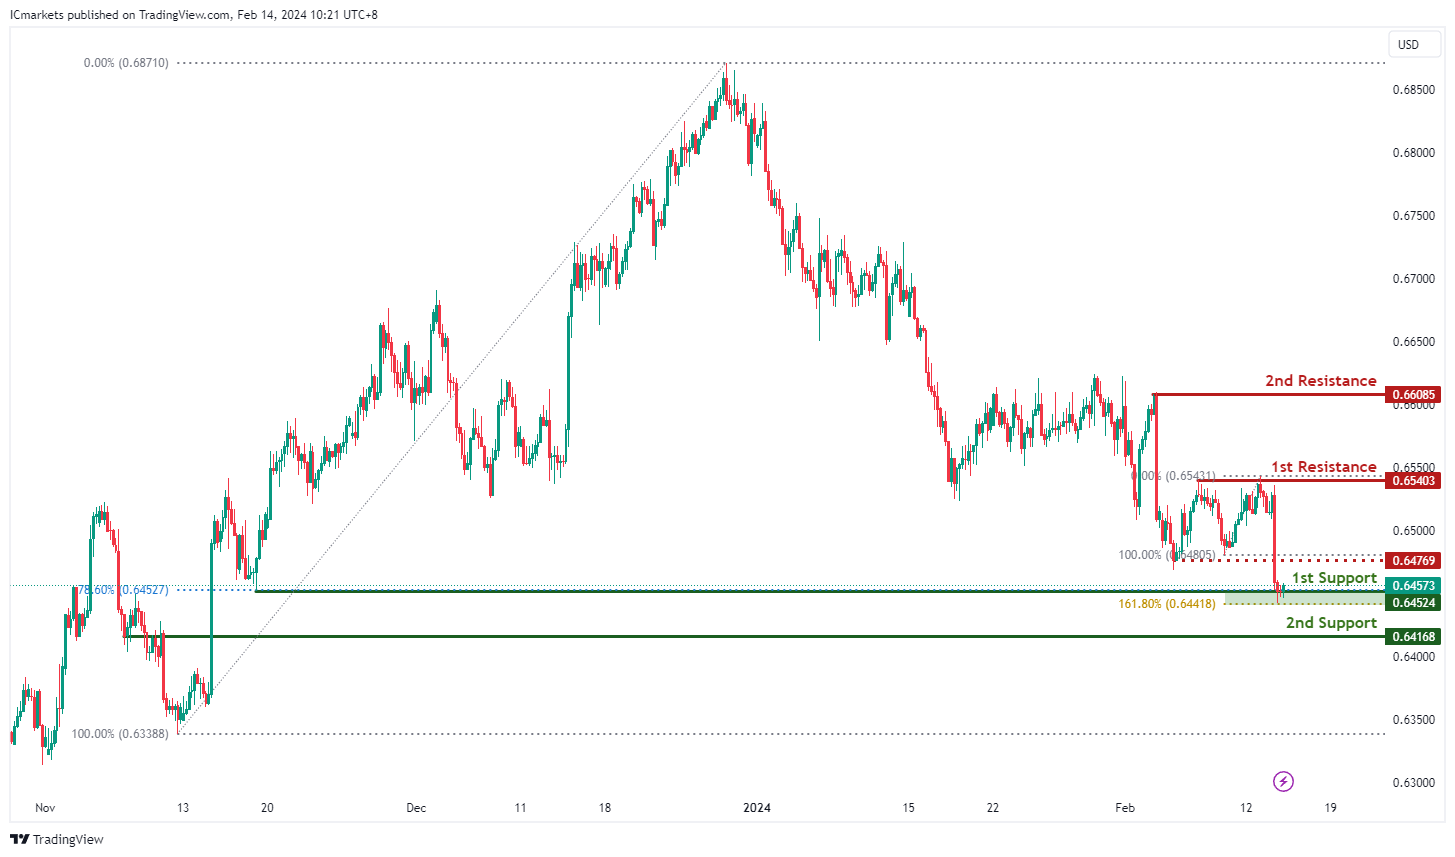
AUD/USD:
The AUD/USD chart currently exhibits an overall bearish momentum. In this context, there is a potential scenario for price to break under the 1st support and drop towards the 2nd support.
The 1st support level at 0.6452 is identified as pullback support that aligns with a confluence of Fibonacci levels i.e. the 78.60% Retracement and the 161.80% Extension. Further below, the 2nd support level at 0.6416 is noted as an overlap support, further emphasizing its importance as a potential support zone.
To the upside, the intermediate resistance level at 0.6476 is identified as a pullback resistance while the 1st resistance level at 0.6540 is also noted as a pullback resistance. Higher up, the 2nd resistance level at 0.6608 is also marked as a pullback resistance, further highlighting its importance as a potential resistance point.
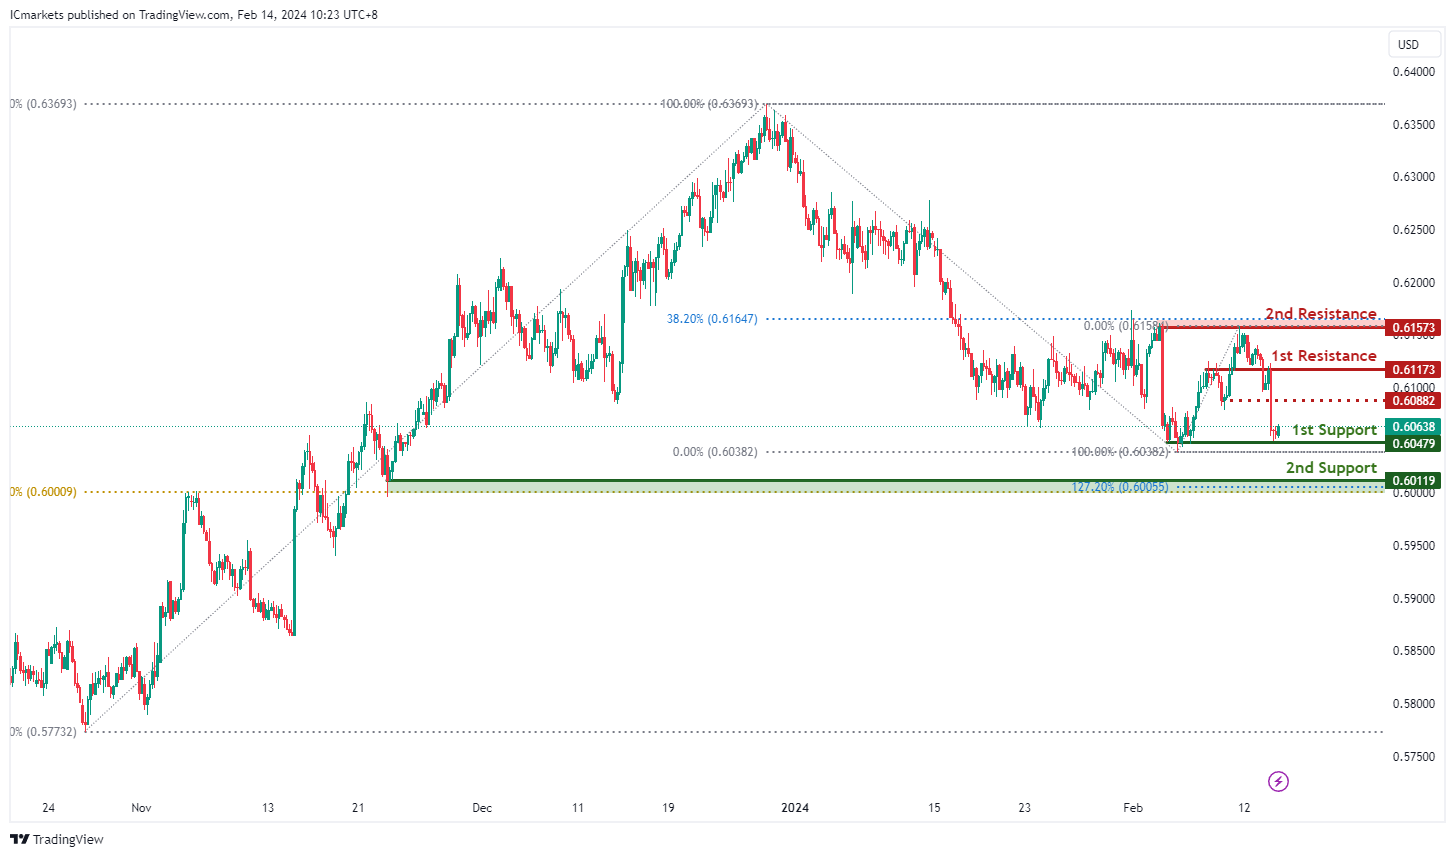
NZD/USD
The NZD/USD chart currently exhibits an overall bearish momentum. However, there is a potential scenario for price to make a weak bullish bounce off the 1st support before resuming the downturn.
The 1st support level at 0.6047 is identified as a pullback support. Further below, the 2nd support level at 0.6011 is also noted as a pullback support that aligns close to the 61.80% Fibonacci Retracement level, further emphasizing its importance as a potential support zone.
To the upside, the intermediate resistance level at 0.6088 is identified as a pullback resistance while the 1st resistance level at 0.6117 is noted as an overlap resistance. Higher up, the 2nd resistance level at 0.6157 is marked as a pullback resistance that aligns close to the 38.20% Fibonacci Retracement level, further highlighting its importance as a potential resistance point.
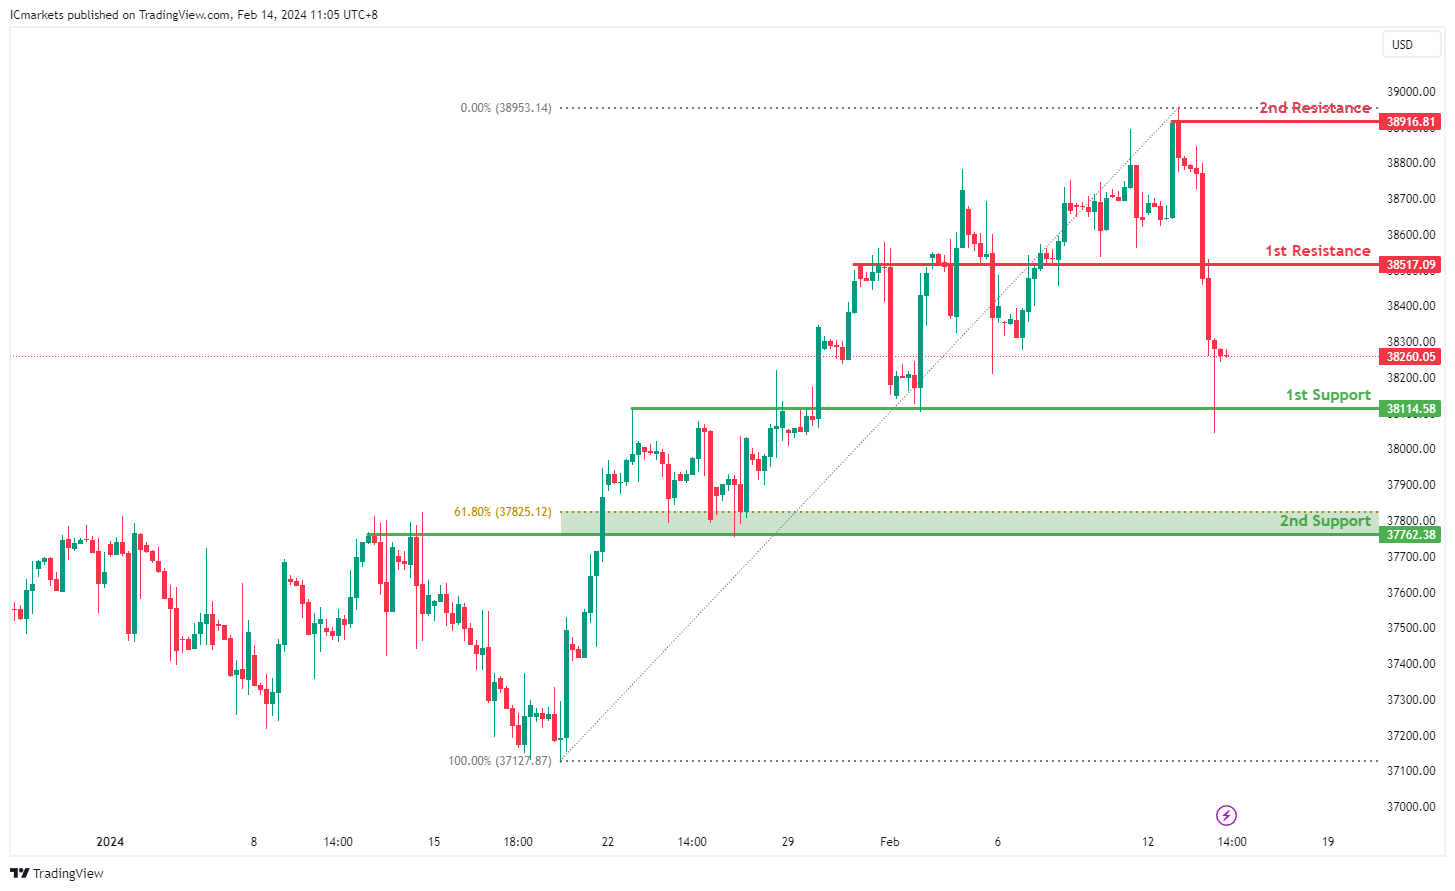
DJ30:
The DJ30 chart currently indicates a bearish overall momentum, suggesting a prevailing downward trend in the market.
The identified 1st support level at 38114.58 is considered significant as it represents an overlap support, indicating a historical level where buying interest has previously emerged. This level serves as a crucial area where buyers may step in again to support the price, potentially leading to a bounce.
Additionally, the 2nd support level at 37762.38 aligns with both an overlap support and the 61.80% Fibonacci Retracement level, further reinforcing its importance as a potential support zone. The confluence of these factors strengthens the significance of this support level.
On the resistance side, the 1st resistance level at 38517.09 is identified as a barrier where selling pressure may increase, as it coincides with an overlap resistance. This level represents a historical point where selling interest has been strong and could potentially cap further upside movement.
Further up, the 2nd resistance level at 38916.81 aligns with a swing high resistance, adding to its significance as a potential barrier to upward movement.
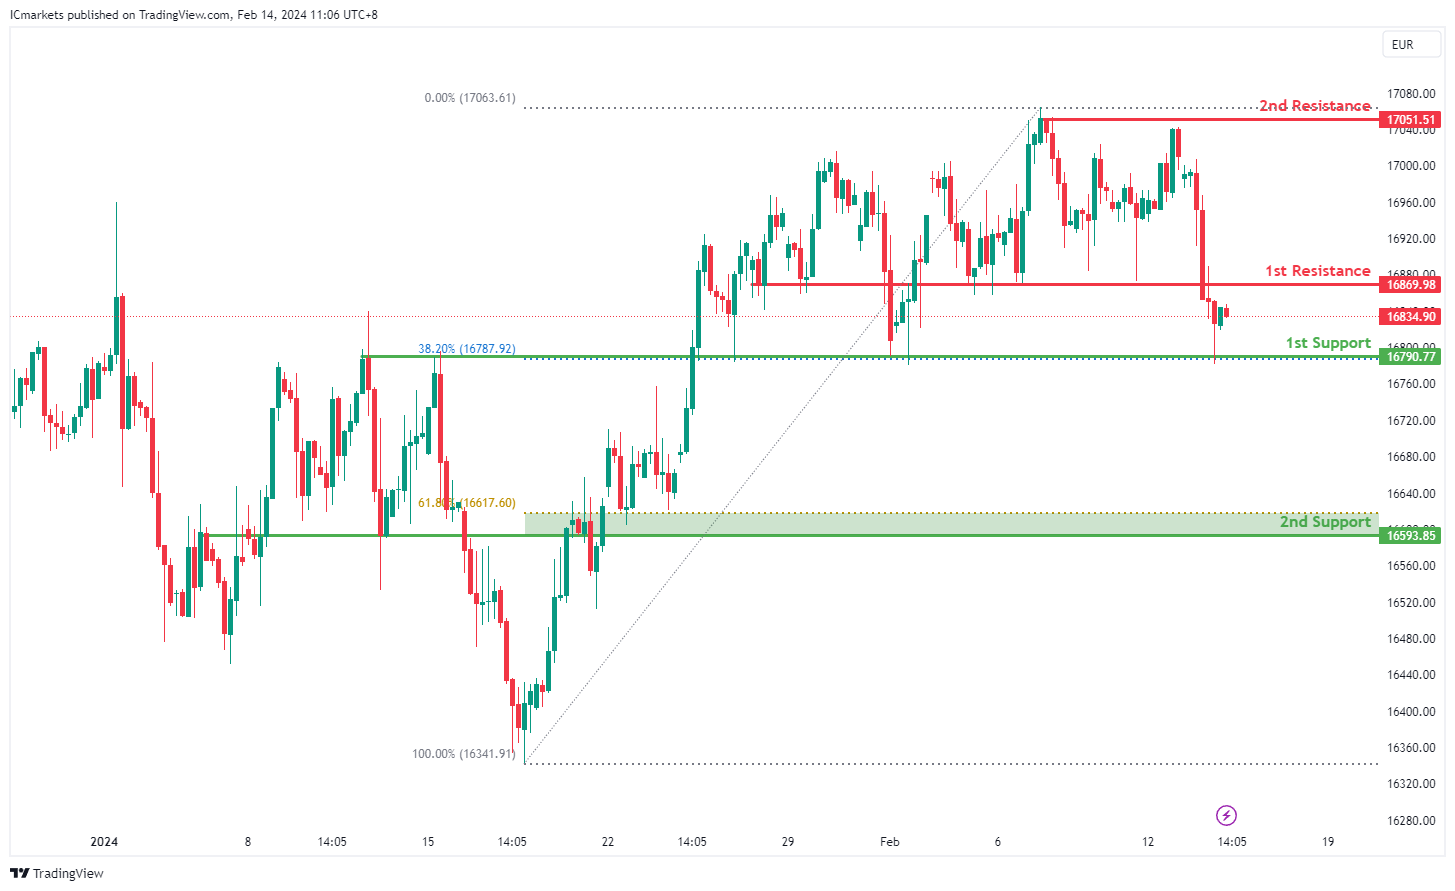
GER40:
The GER40 chart currently exhibits a bullish overall momentum, indicating a prevailing upward trend. Several factors contribute to this bullish sentiment, supporting the potential for a continued upward movement in price.
The identified 1st support level at 16790.77 is significant as it aligns with both an overlap support and the 38.20% Fibonacci Retracement level. This convergence of support factors enhances its importance as a level where buying interest has historically emerged, potentially acting as a foundation for further upward movement.
Additionally, the 2nd support level at 16593.85 coincides with an overlap support and the 61.80% Fibonacci Retracement level, further reinforcing its significance as a potential support zone. The confluence of these support factors strengthens the potential support area and indicates a strong foundation for potential bullish momentum.
On the resistance side, the 1st resistance level at 16869.98 is identified as a barrier where selling pressure may increase, as it aligns with an overlap resistance. This level represents a historical point where selling interest has been strong and could potentially halt further upward movement.
Further up, the 2nd resistance level at 17051.51 aligns with a swing high resistance, adding to its significance as a potential barrier to upward movement.
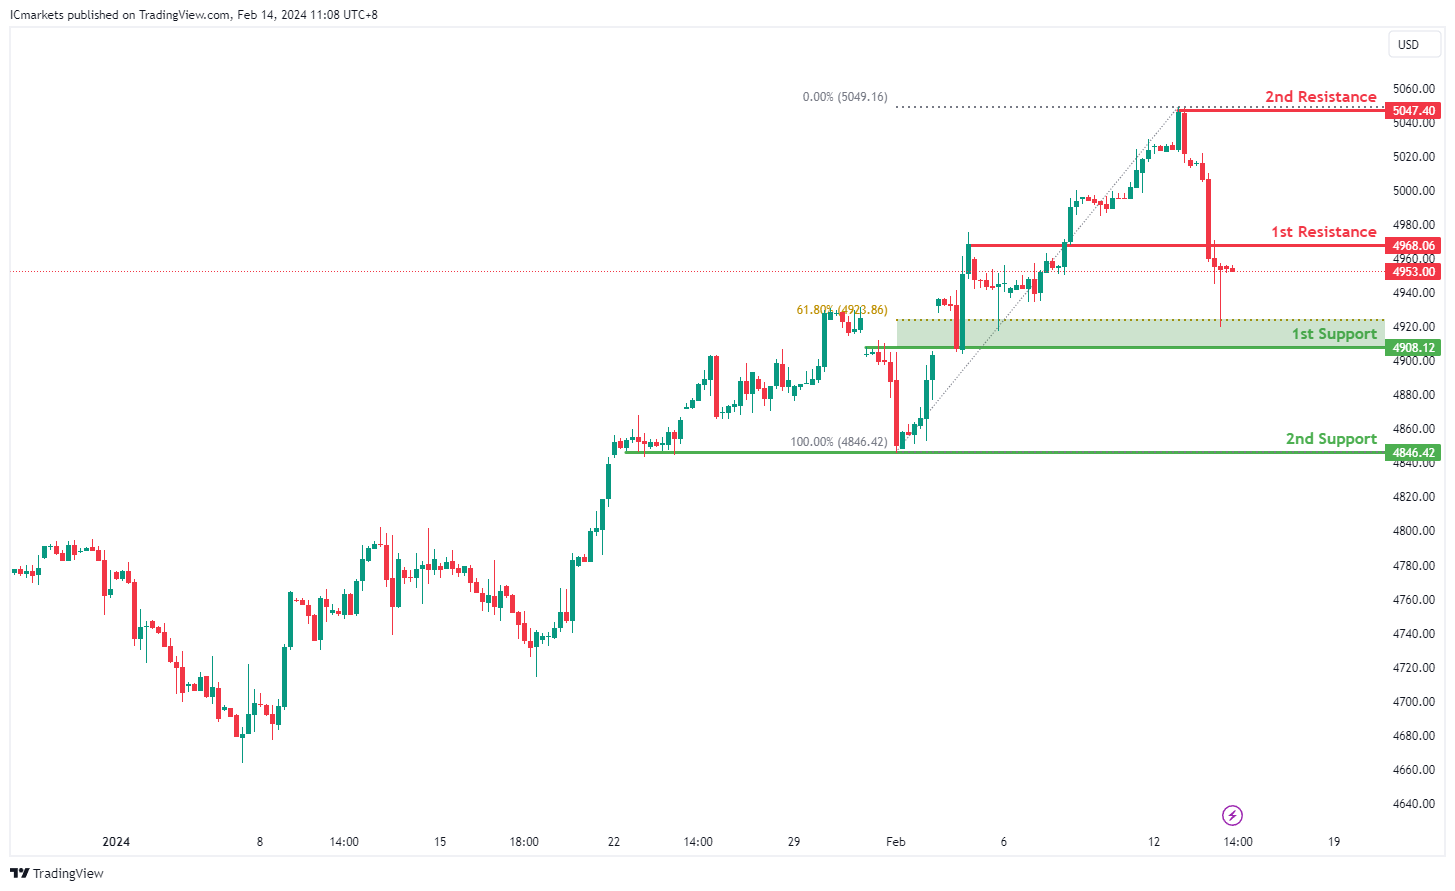
US500:
The US500 chart currently indicates a bullish overall momentum, suggesting a prevailing upward trend. Several factors contribute to this bullish sentiment, supporting the potential for a continued upward movement in price.
The identified 1st support level at 4908.12 is significant as it aligns with both an overlap support and the 61.80% Fibonacci Retracement level. This convergence of support factors strengthens its importance as a level where buying interest has historically emerged, potentially providing a strong foundation for further upward movement.
Additionally, the 2nd support level at 4846.42 corresponds to a multi-swing low support, further reinforcing its significance as a potential support zone. The combination of these support factors suggests a robust area where buyers may step in to support the price.
On the resistance side, the 1st resistance level at 4968.06 is identified as a point where selling pressure may increase, as it represents a pullback resistance. This level indicates a historical point where selling interest has been strong and could potentially act as a barrier to further upward movement.
Further up, the 2nd resistance level at 5047.40 aligns with a swing high resistance, adding to its significance as a potential barrier to upward movement.
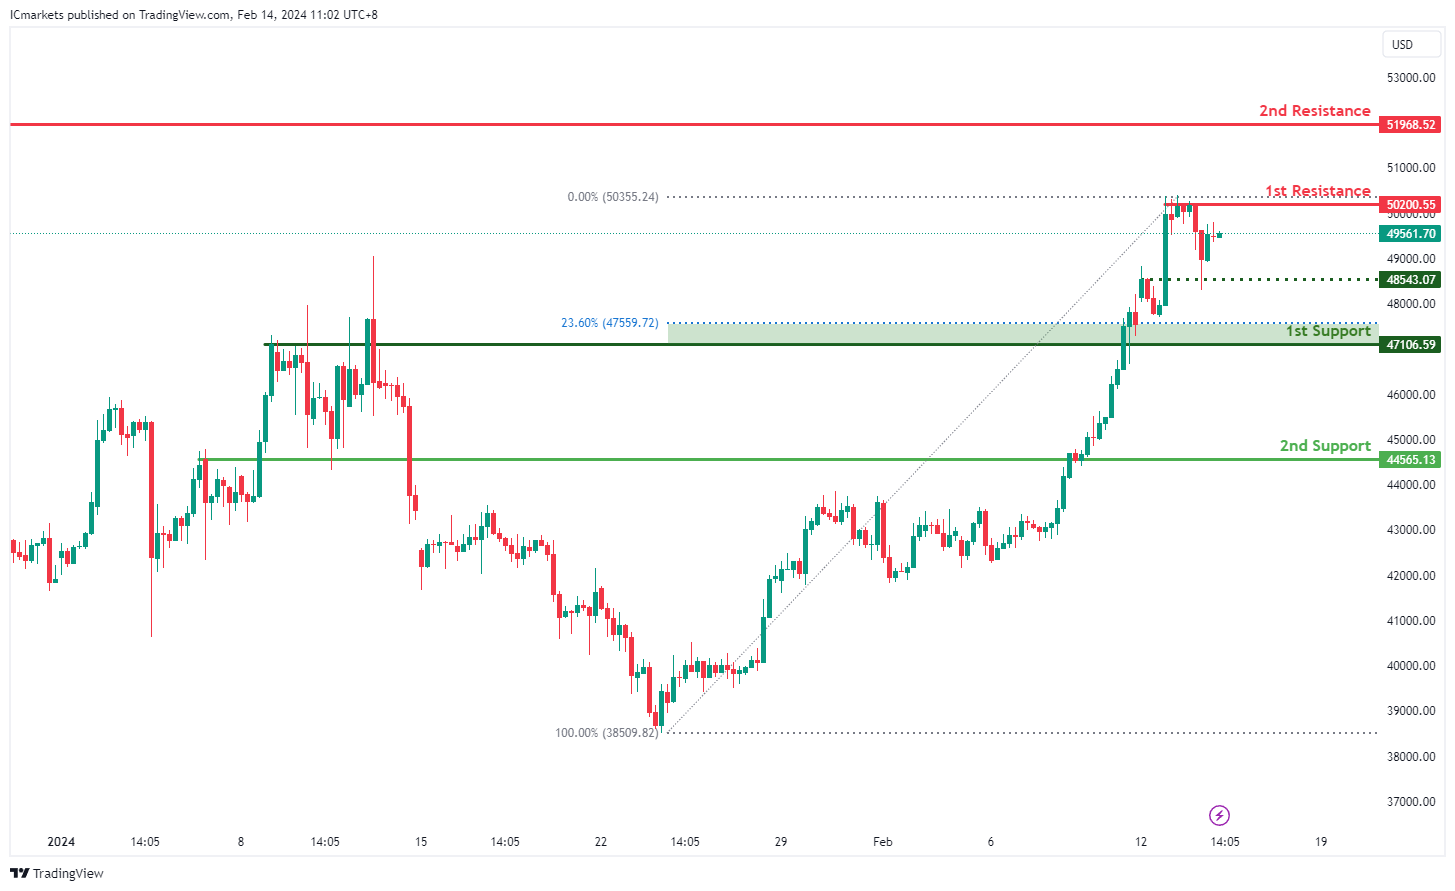
BTC/USD:
The BTC/USD chart currently exhibits a bullish overall momentum, indicating a prevailing upward trend. Several factors contribute to this bullish sentiment, supporting the potential for a continued upward movement in price.
The 1st support level at 47106.59 is considered significant as it aligns with both an overlap support and the 23.60% Fibonacci Retracement level. This convergence of support factors suggests a strong level where buying interest has historically emerged, potentially providing a solid foundation for further upward movement.
Additionally, the 2nd support level at 44565.13 corresponds to another overlap support, reinforcing its importance as a potential support zone. This level indicates a significant historical level where buyers have previously stepped in to support the price. An intermediate support level at 48543.07 is also identified, which aligns with an overlap support, providing additional reinforcement to the support structure.
On the resistance side, the 1st resistance level at 50200.55 is identified as a point where selling pressure may increase, as it represents a multi-swing high resistance. This level suggests a historical point where selling interest has been strong and could act as a barrier to further upward movement.
Further up, the 2nd resistance level at 51968.52 also aligns with a multi-swing high resistance, adding to its significance as a potential barrier to upward movement.
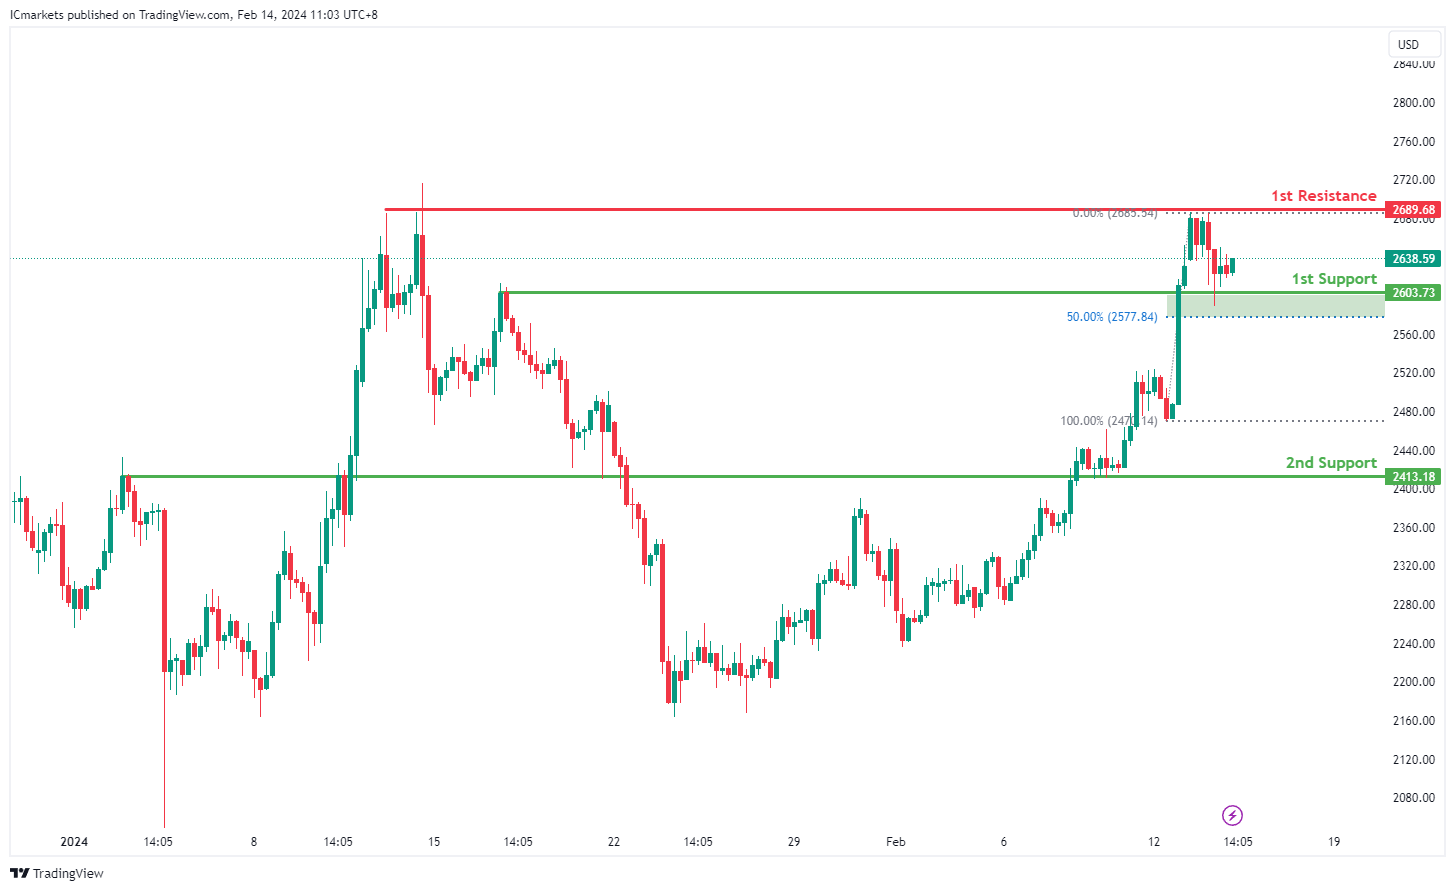
ETH/USD:
The ETH/USD chart currently presents a neutral overall momentum, indicating a lack of clear direction in the market. This neutrality suggests that the price may oscillate between the identified support and resistance levels without a strong bias towards either bullish or bearish sentiment.
The 1st support level at 2603.73 is significant as it coincides with both an overlap support and the 50% Fibonacci Retracement level. This confluence of support factors indicates a robust level where buying interest has previously emerged, potentially providing a floor for the price.
Furthermore, the 2nd support level at 2413.18 also aligns with an overlap support, reinforcing its significance as a potential area where buyers may step in to support the price.
On the resistance side, the 1st resistance level at 2689.68 is identified as a swing high resistance. This level represents a historical point where selling pressure has previously halted upward movements, potentially acting as a barrier to further price appreciation.
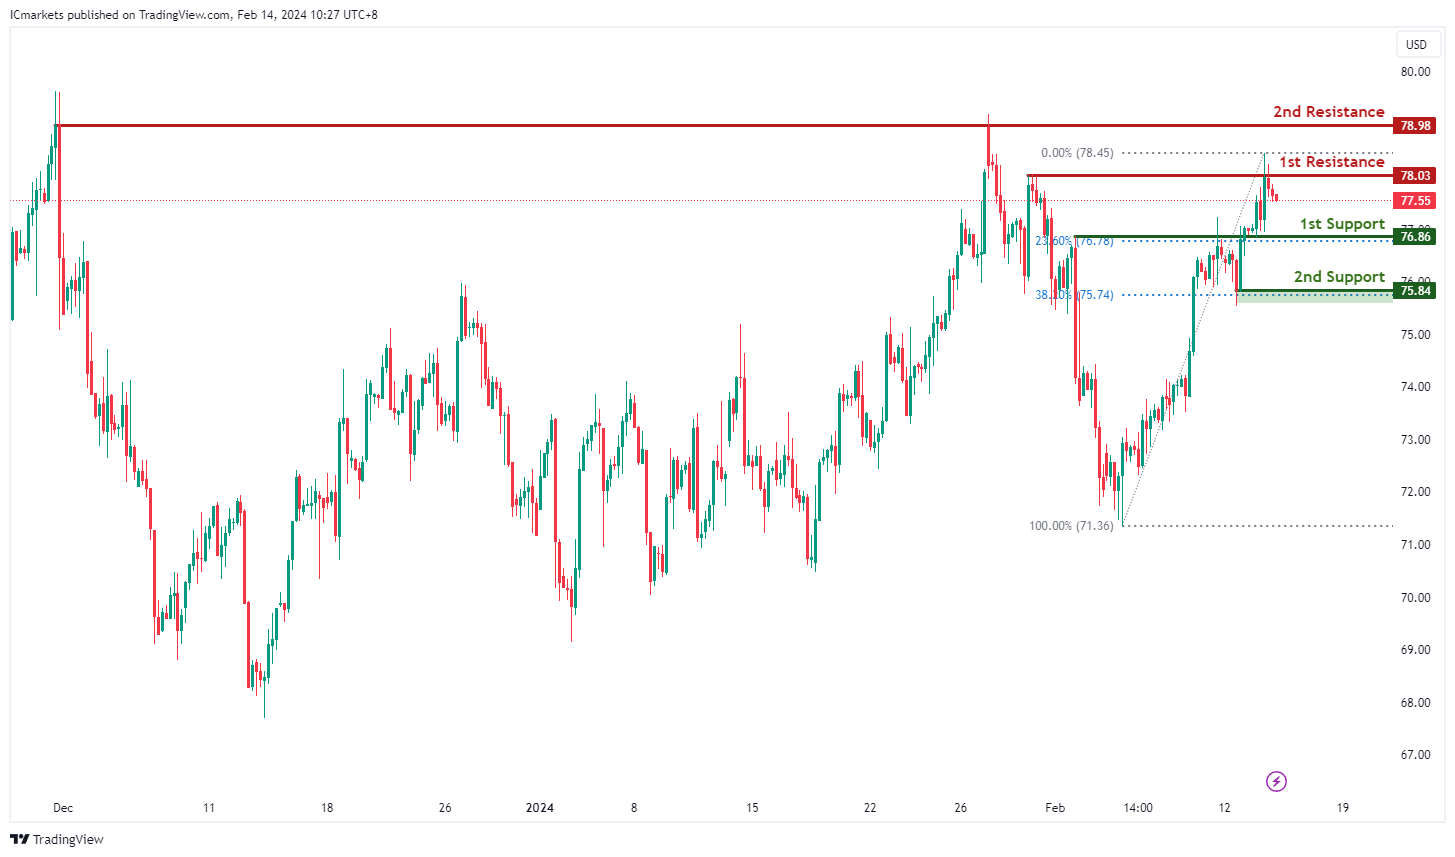
WTI/USD:
The WTI (West Texas Intermediate) chart currently exhibits an overall bullish momentum. In this context, there is a potential scenario for price to rise towards the 1st resistance.
The 1st resistance level at 78.03 is identified as a pullback resistance. Higher up, the 2nd resistance level at 78.98 is marked as a multi-swing-high resistance, further highlighting its importance as a potential resistance zone.
To the downside, the 1st support level at 76.86 is identified as an overlap support that aligns with the 23.60% Fibonacci Retracement level. Further below, the 2nd support level at 75.84 is noted as a pullback support that aligns close to the 38.20% Fibonacci Retracement level, reinforcing its significance as a key support level.
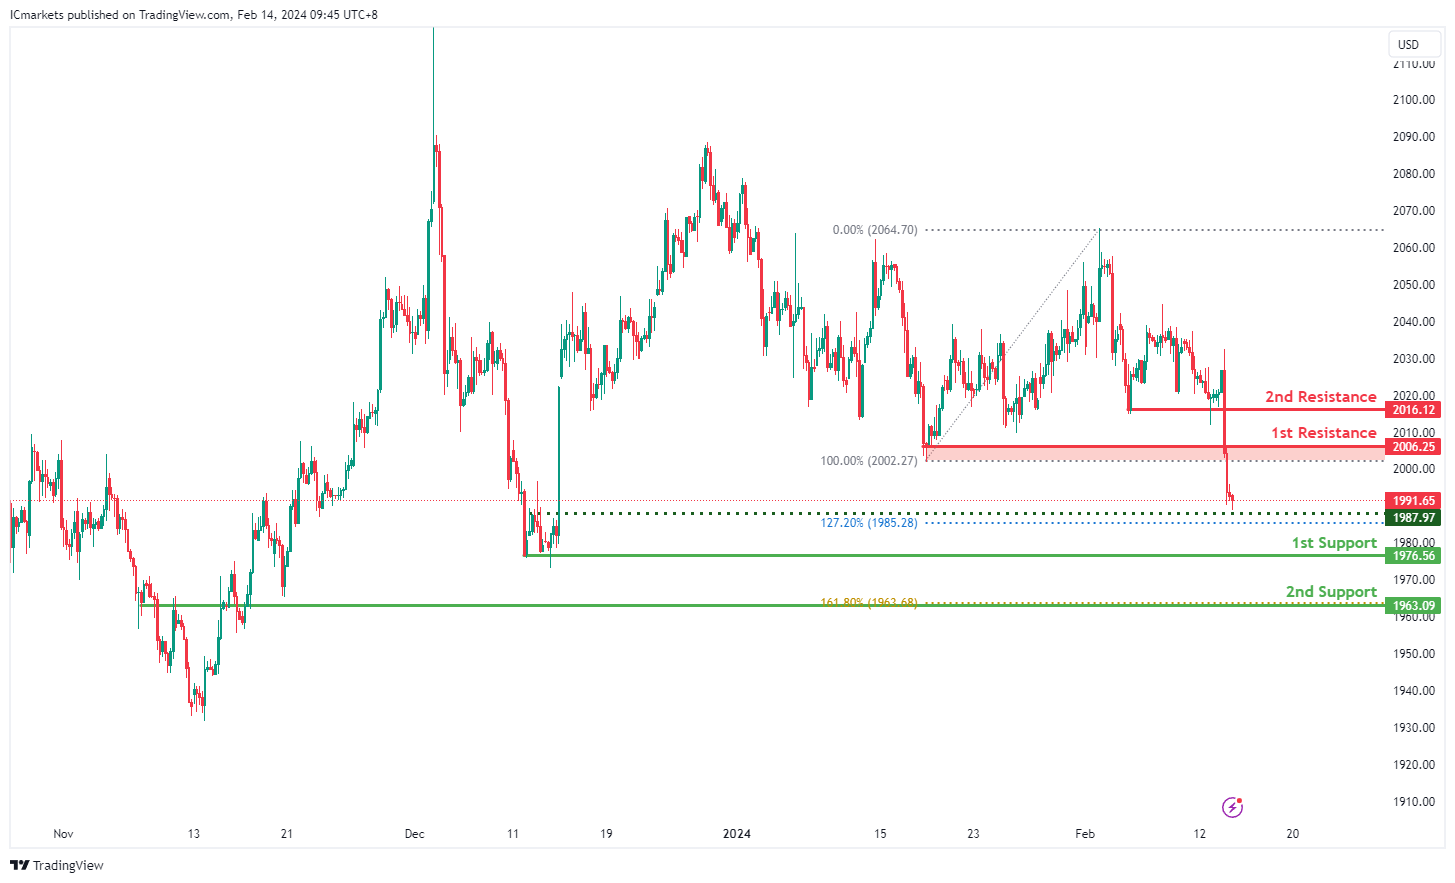
XAU/USD (GOLD):
The XAUUSD chart currently demonstrates a bullish momentum, indicating a potential upward trend.
The 1st support level is positioned at 1976.56, identified as a multi-swing low support. This level holds significance as it has previously acted as a strong support area, potentially attracting buying interest and halting the downward movement of the price.
Additionally, the 2nd support at 1963.09 is noted as an overlap support, coinciding with the 161.80% Fibonacci Extension, further reinforcing its potential as a support zone.
On the resistance side, the 1st resistance level is located at 2006.25, characterized as a pullback resistance. This level may serve as a barrier to upward movement, potentially triggering a temporary reversal or consolidation.
Similarly, the 2nd resistance at 2016.12 is identified as a pullback resistance, indicating another potential area where selling pressure may intensify.


