
DXY:
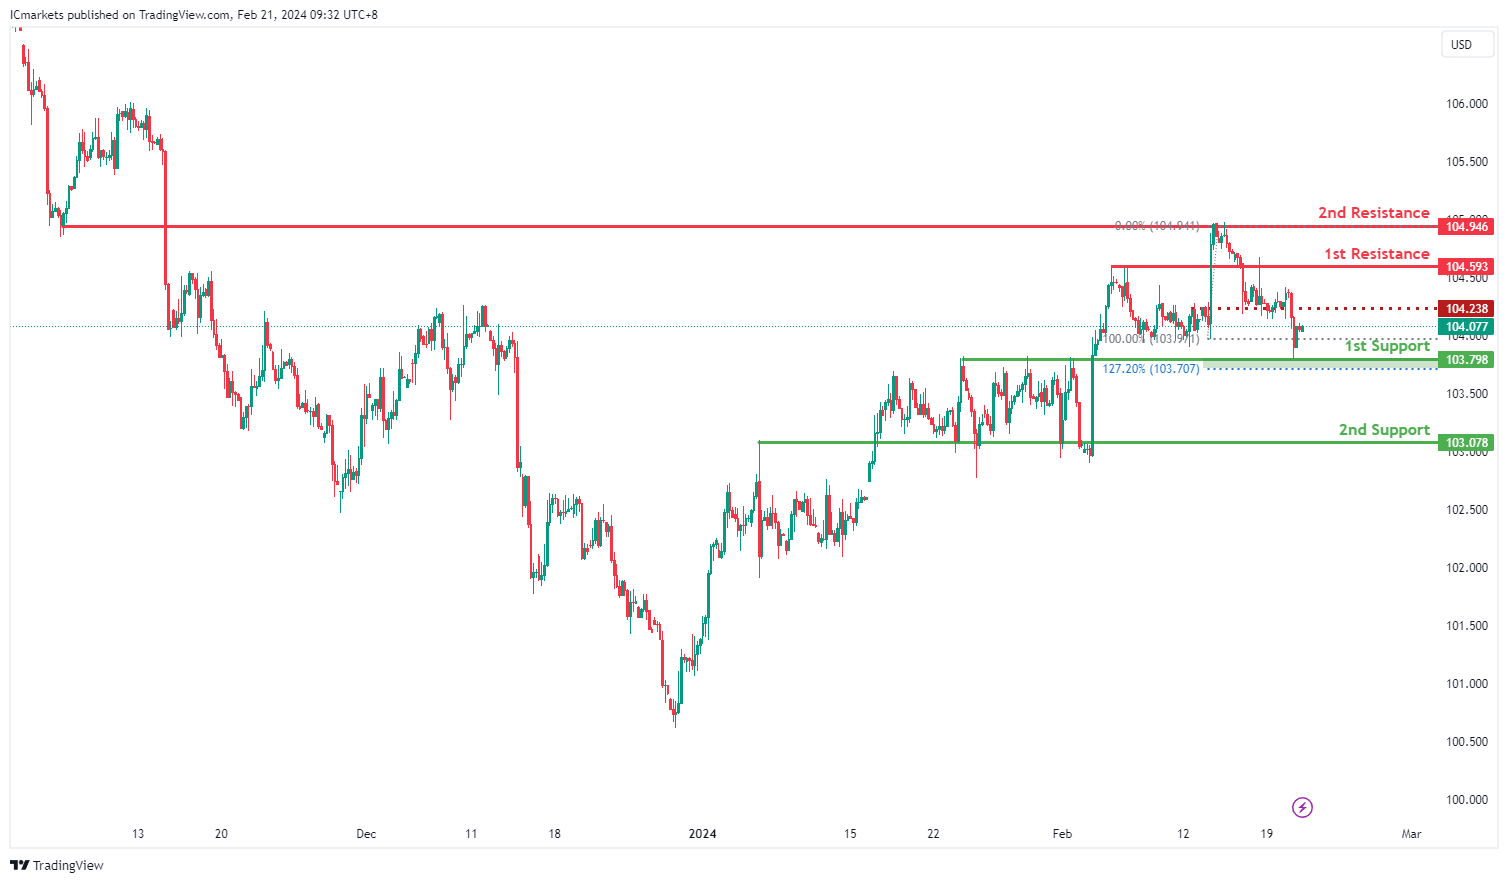
The DXY (US Dollar Index) chart currently exhibits bullish momentum, indicating a potential bullish bounce off the 1st support level followed by a movement towards the 1st resistance.
The 1st support level at 103.79 is deemed significant as it aligns with an overlap support, suggesting a historical level where buying interest has been observed. This level may attract buyers to enter the market, potentially leading to a bounce in price.
Similarly, the 2nd support at 103.07 is also identified as an overlap support, reinforcing its importance as a historical level where buying pressure may emerge to support the price.
On the resistance side, the 1st resistance level at 104.59 is characterized as an overlap resistance, indicating its significance as a historical barrier where selling pressure may increase. This level may act as a hurdle for further upward movement in price.
Likewise, the 2nd resistance at 104.94 is identified as an overlap resistance, suggesting its importance as a level where selling interest may intensify, potentially limiting upward price movement.
An intermediate resistance level at 104.23 is also noted, characterized as a pullback resistance. This level may offer resistance to the price temporarily, potentially influencing short-term price action.
EUR/USD:
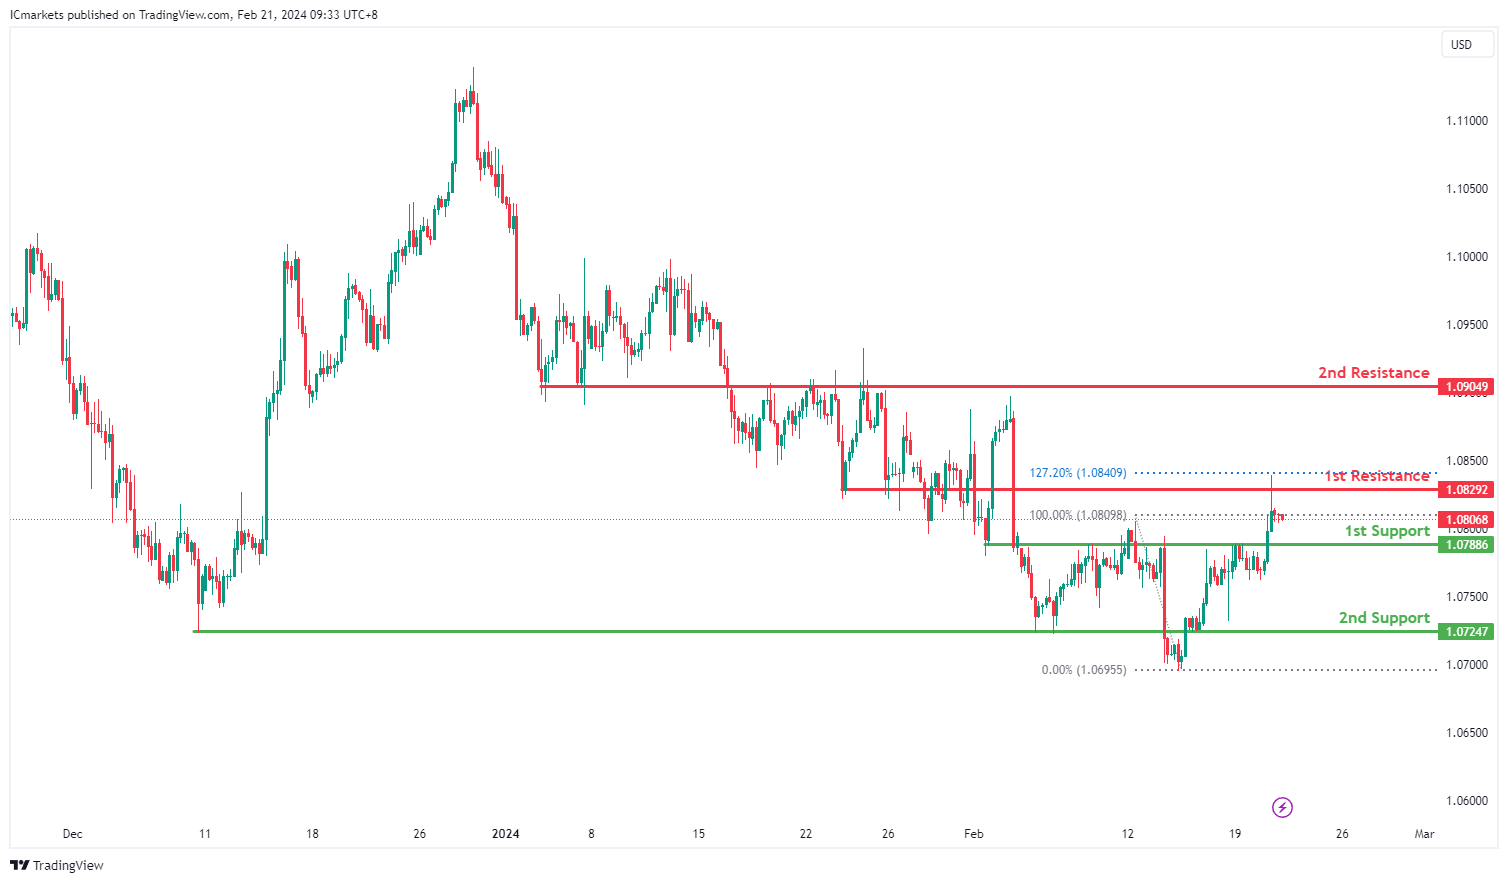
The EUR/USD chart currently indicates a bearish momentum, suggesting a potential bearish reaction off the 1st resistance level followed by a drop towards the 1st support.
The 1st support at 1.0788 is considered significant as it aligns with a pullback support, indicating a level where buyers may enter the market following a retracement.
Similarly, the 2nd support at 1.0724 is identified as an overlap support, reinforcing its importance as a historical level where buying interest has been observed.
On the resistance side, the 1st resistance level at 1.0829 is characterized as an overlap resistance, with the added confluence of the 127.20% Fibonacci Extension. This level suggests a historical point where selling pressure may increase, potentially hindering further upward movement.
Likewise, the 2nd resistance at 1.0904 is identified as an overlap resistance, indicating its significance as a level where selling interest may intensify, potentially acting as a barrier to upward price movement.
EUR/JPY:
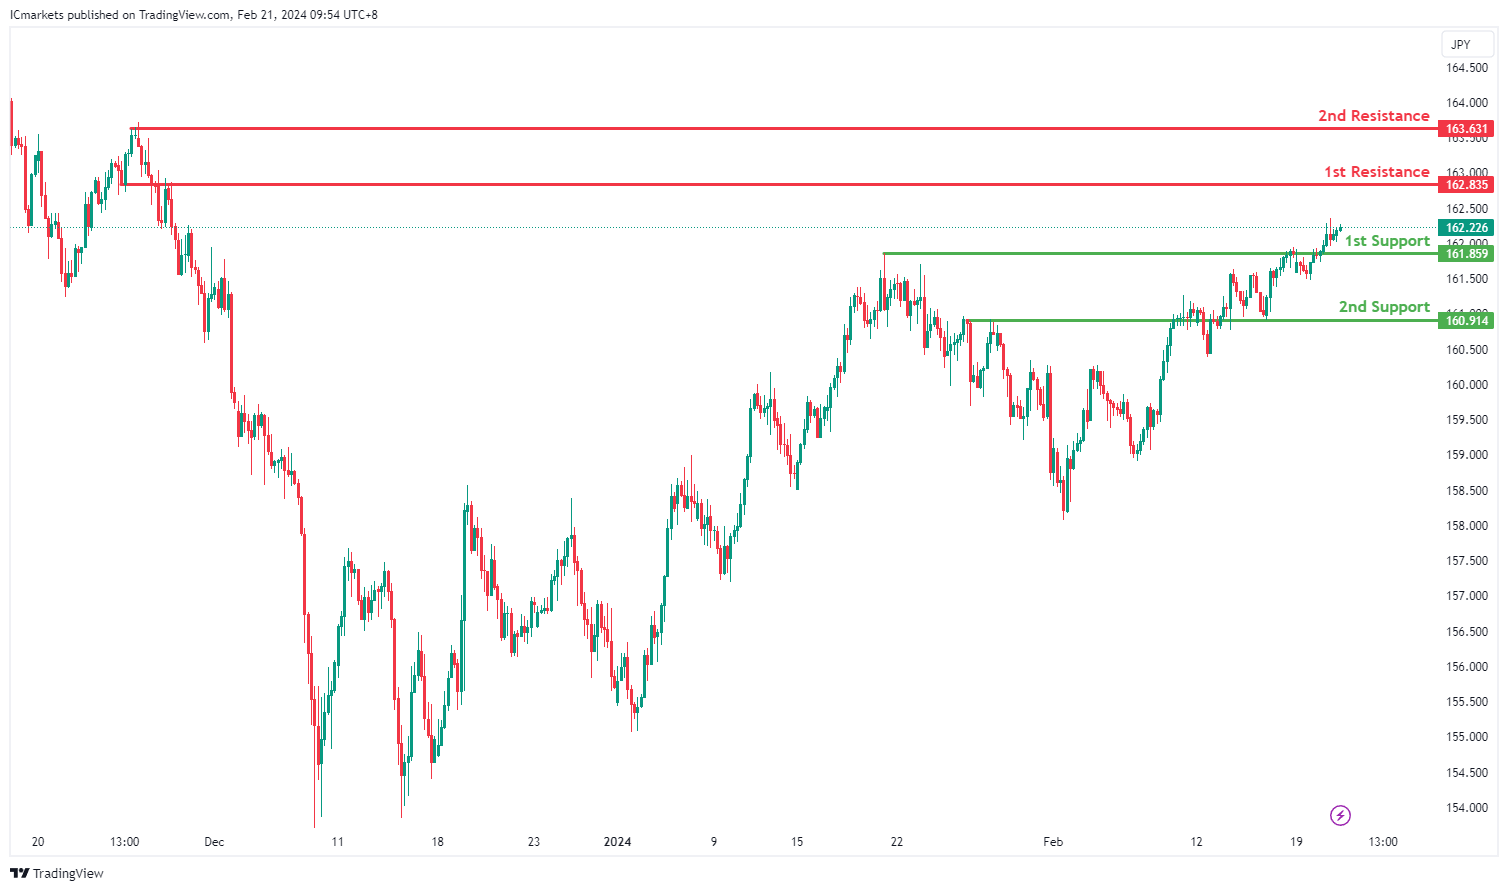
The EUR/JPY chart currently demonstrates a bullish overall momentum, indicating a prevailing upward trend supported by several factors contributing to this sentiment.
The 1st support level at 161.859 aligns with an overlap support, marking a significant historical level where buying interest has been notable. This support level may act as a foundation for further upward movement, reinforcing the bullish sentiment.
Similarly, the 2nd support level at 160.914 also corresponds to an overlap support, further strengthening its significance as a potential area where buyers could step in to support the price during pullbacks.
On the resistance side, the 1st resistance level at 162.835 is identified as a critical point where selling pressure may increase. This level aligns with an overlap resistance, suggesting a potential barrier to further upward movement.
Additionally, the 2nd resistance level at 163.631 corresponds to a swing high resistance, adding to its significance as a point where selling interest has historically emerged.
EUR/GBP:
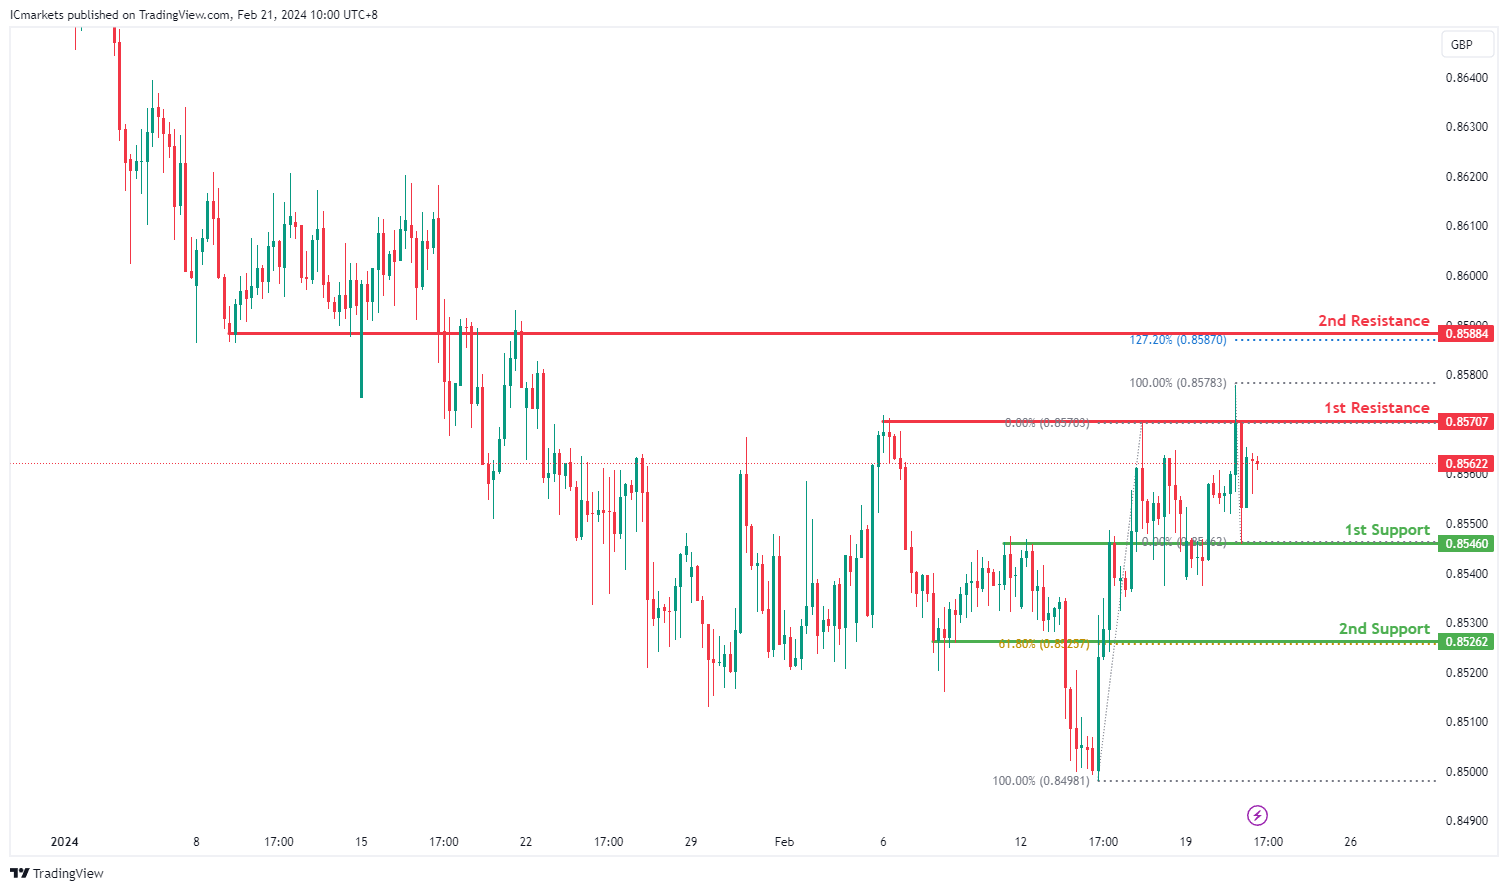
The EUR/GBP chart currently exhibits a weak bullish momentum with low confidence, suggesting a cautious outlook for potential price movements. Despite this, there are factors indicating a possible bullish bounce off the 1st support level, followed by a move towards the 1st resistance.
The 1st support level at 0.85460 aligns with an overlap support, indicating a historical level where buying interest has been observed. Additionally, the 2nd support at 0.85262 corresponds to both a pullback support and the 61.80% Fibonacci Retracement level, further reinforcing its significance as a potential area for buyers to enter the market.
On the resistance side, the 1st resistance level at 0.85707 is identified as a point where selling pressure may increase, as it aligns with a swing high resistance. This level suggests a historical barrier to upward movement.
Furthermore, the 2nd resistance level at 0.85884 coincides with an overlap resistance and the 127.20% Fibonacci Extension, adding to its significance as a potential barrier to further bullish movement.
GBP/USD:
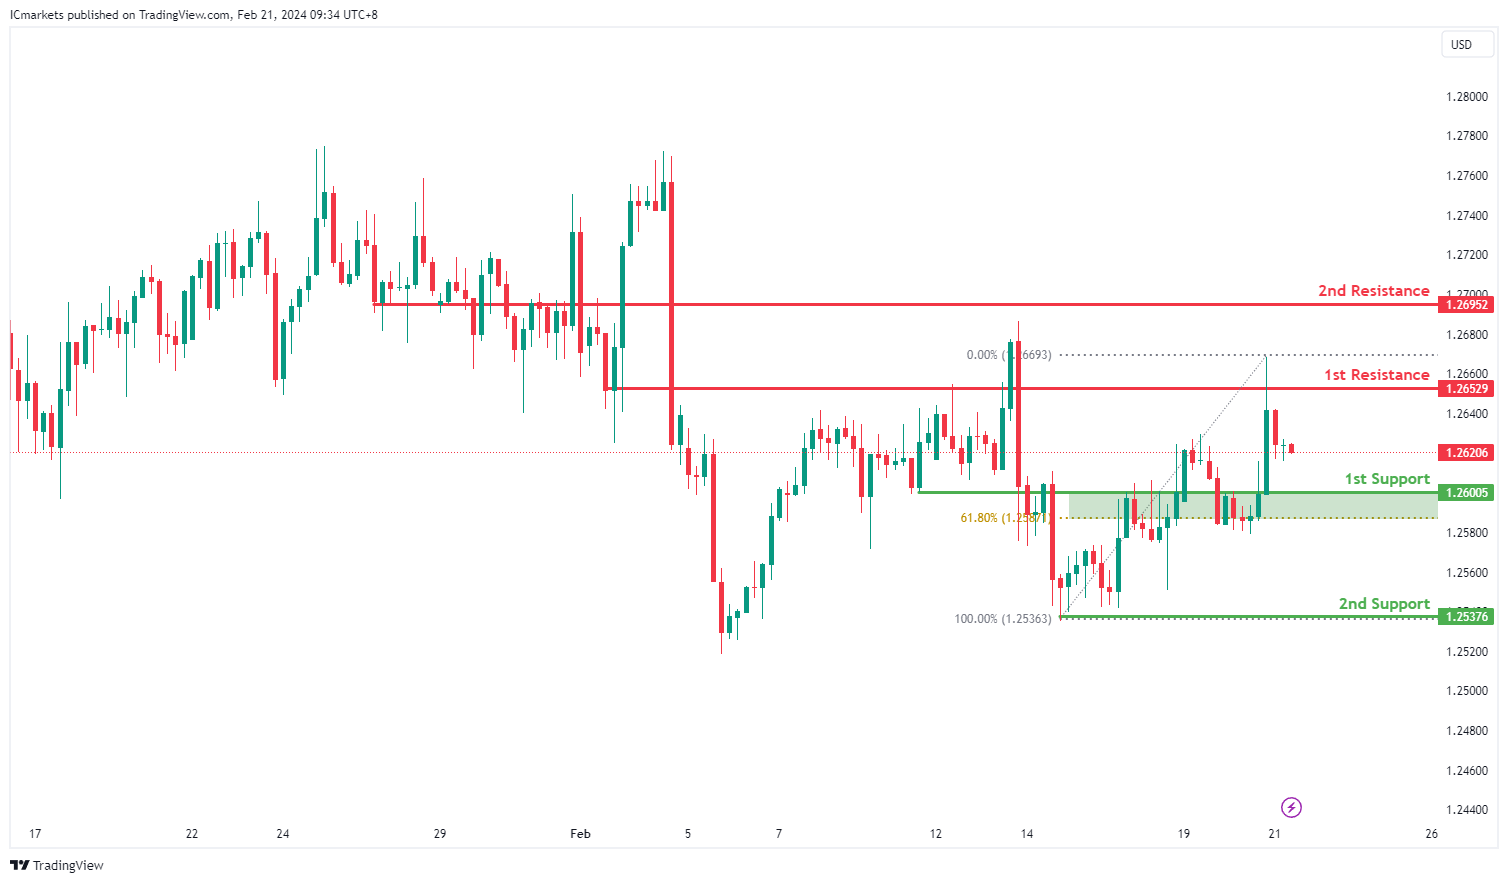
The GBP/USD chart currently indicates a bearish momentum, suggesting a potential continuation towards the 1st support level.
The 1st support at 1.2600 is considered significant as it aligns with a pullback support, indicating a level where buyers may enter the market following a retracement.
Similarly, the 2nd support at 1.2537 is identified as a multi-swing low support, reinforcing its importance as a historical level where buying interest has been observed.
On the resistance side, the 1st resistance level at 1.2652 is characterized as an overlap resistance, with the added confluence of the 61.80% Fibonacci Retracement. This level suggests a historical point where selling pressure may increase, potentially hindering further upward movement.
Likewise, the 2nd resistance at 1.2695 is identified as a pullback resistance, indicating its significance as a level where selling interest may intensify, potentially acting as a barrier to upward price movement.
GBP/JPY:
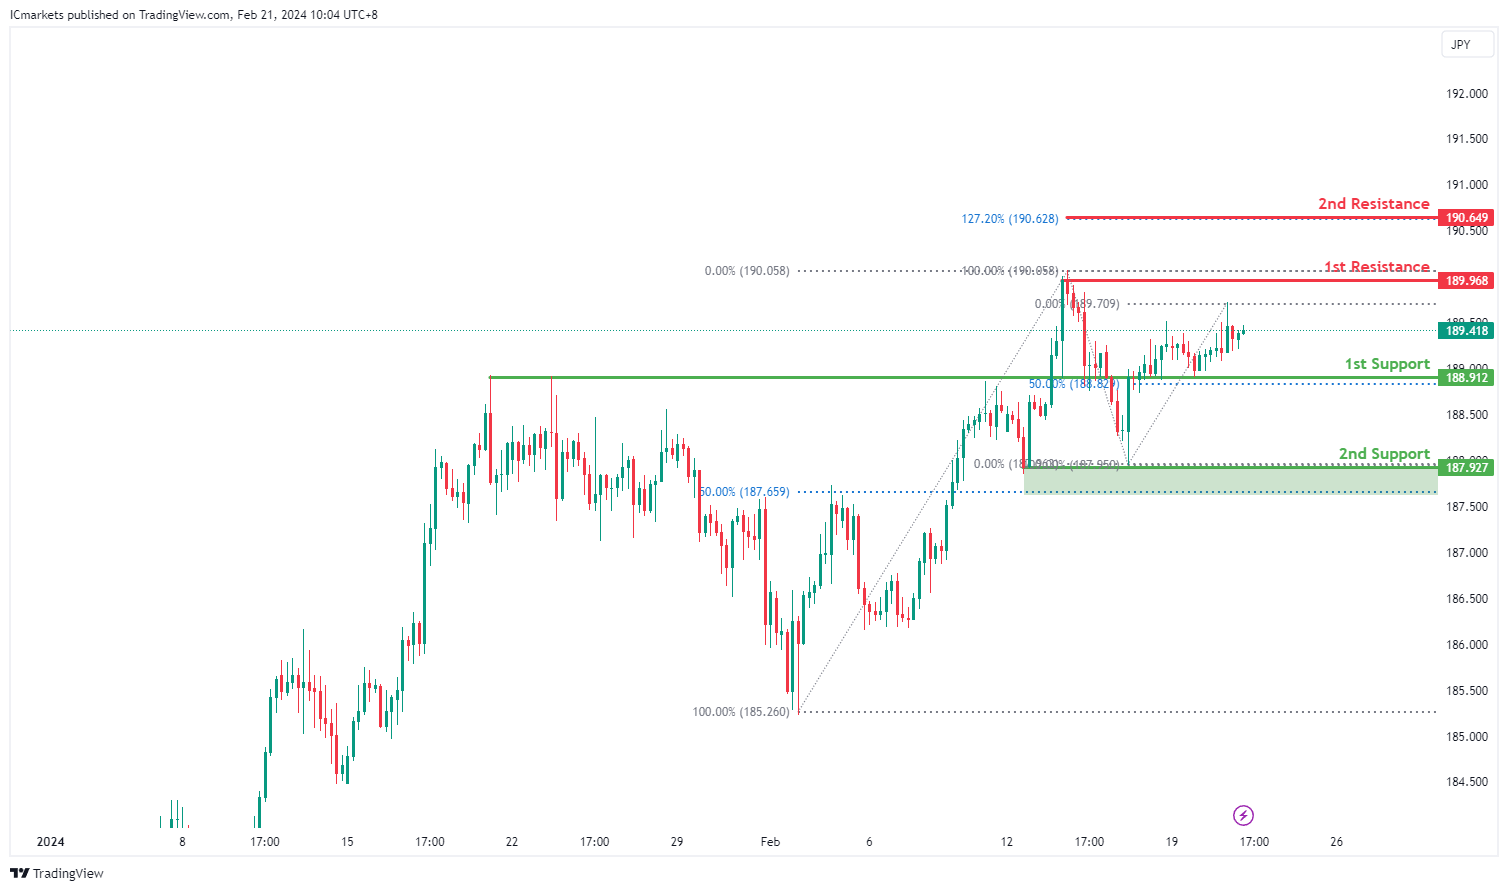
The GBP/JPY chart currently exhibits a bullish momentum, indicating a potential continuation of the upward trend. Several factors support the possibility of a bullish movement towards the 1st resistance level.
The 1st support level at 188.912 aligns with both an overlap support and the 50% Fibonacci Retracement level, indicating a significant historical level where buying interest has emerged. Additionally, the 2nd support at 187.927 corresponds to a swing low support, further reinforcing its importance as a potential area of support.
On the resistance side, the 1st resistance level at 189.968 is identified as a point where selling pressure may increase, as it aligns with a swing high resistance. This level suggests a historical barrier to upward movement.
Furthermore, the 2nd resistance level at 190.649 coincides with the 127.20% Fibonacci Retracement, adding to its significance as a potential barrier to further bullish movement.
USD/CHF:
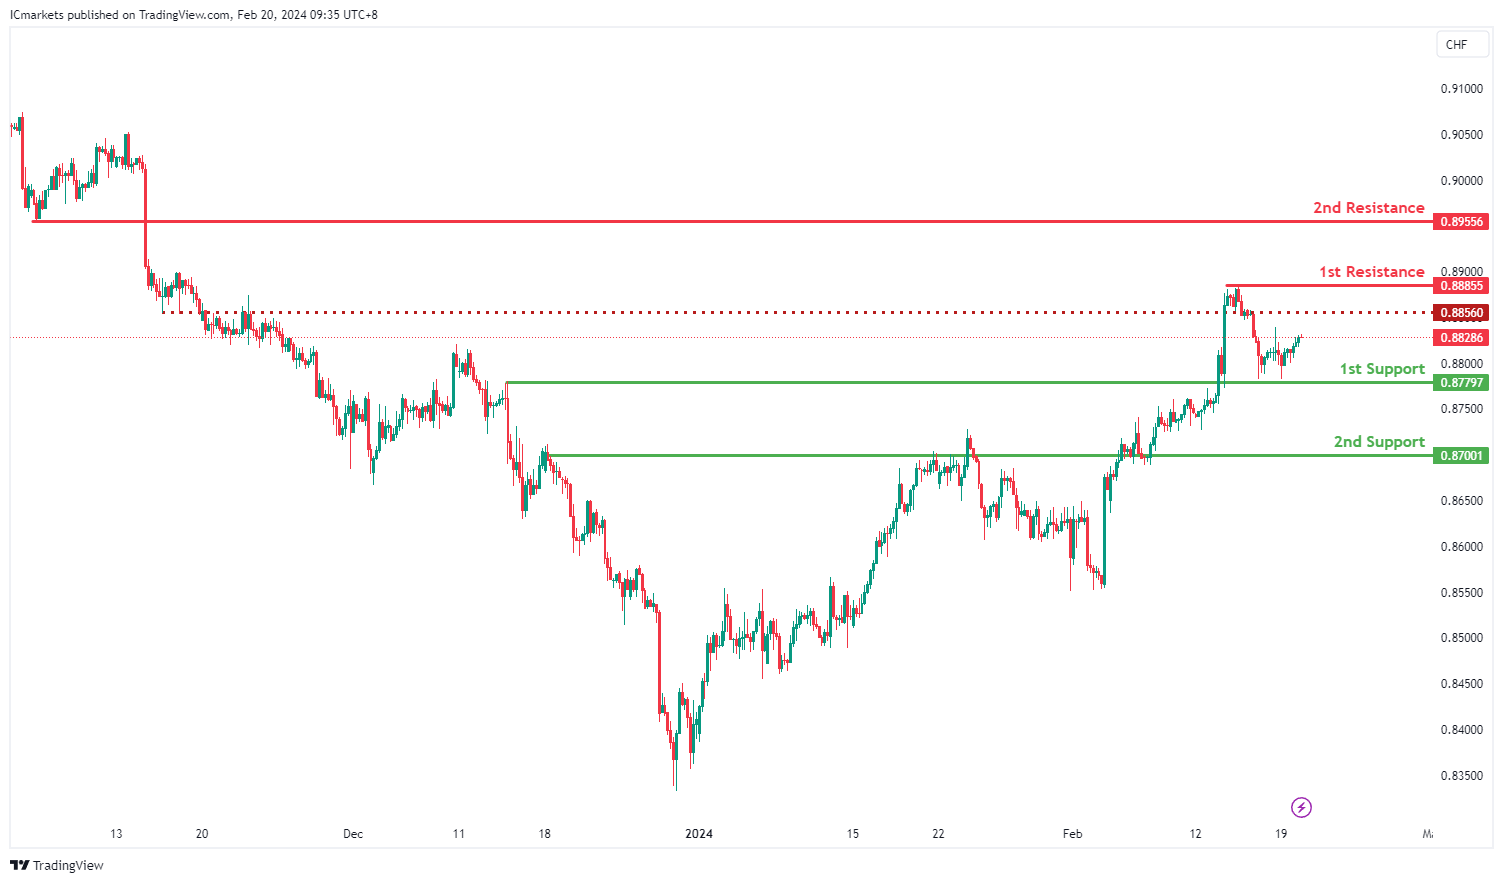
The USD/CHF chart currently reflects a bullish momentum, indicating a potential continuation towards the 1st resistance level.
The 1st support at 0.8779 is considered significant as it aligns with an overlap support, suggesting a historical level where buyers have previously intervened to support the price.
Similarly, the 2nd support at 0.8700 also serves as an overlap support, reinforcing its importance as a potential area where buying interest may emerge.
On the resistance side, the 1st resistance level at 0.8885 is identified as a multi-swing high resistance, indicating a historical point where selling pressure has been notable. This level could act as a significant barrier to further upward movement.
Likewise, the 2nd resistance at 0.8955 is characterized as a pullback resistance, suggesting its significance as a level where selling interest may intensify, potentially hindering further upward price movement.
An intermediate resistance level at 0.8839 is also identified, aligning with multi-swing high resistance. This level could provide additional resistance to the price if tested, further reinforcing the potential significance of resistance levels.
USD/JPY:
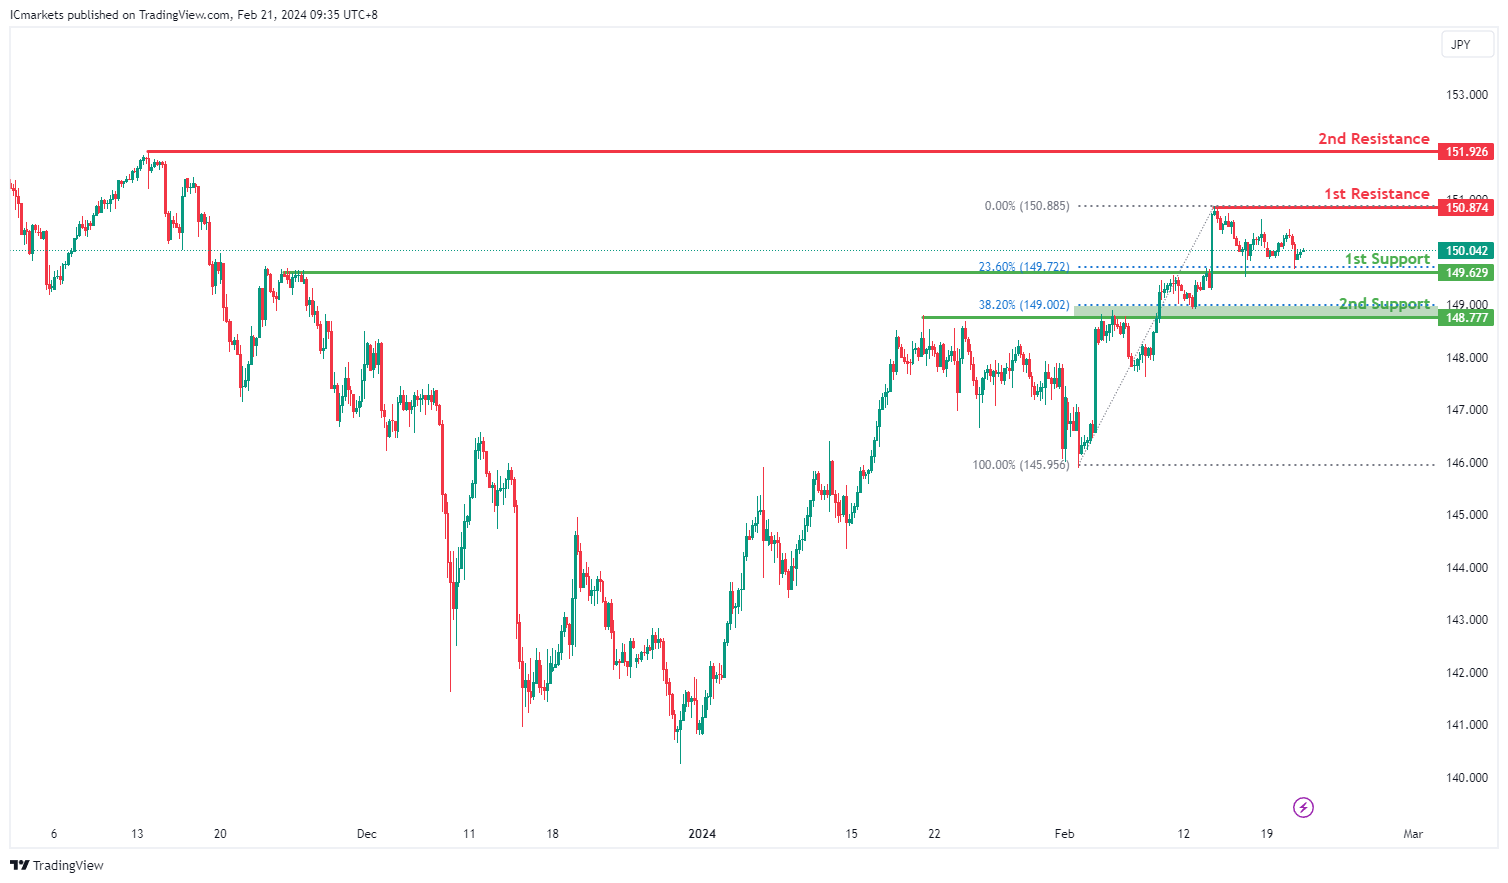
The USD/JPY chart currently exhibits a bullish momentum, suggesting a potential continuation towards the 1st resistance level.
The 1st support at 149.62 is notable as it aligns with both an overlap support and the 23.60% Fibonacci Retracement. This convergence indicates a significant historical level where buying interest has previously emerged, potentially providing support to the price if tested.
Similarly, the 2nd support at 148.77 corresponds to another overlap support and the 38.20% Fibonacci Retracement, further reinforcing its importance as a potential support zone. This level underscores a historical area where buyers have intervened to support the price.
On the resistance side, the 1st resistance level at 150.87 is identified as a swing high resistance, indicating a historical point where selling pressure may increase. This level could act as a barrier to further upward movement, potentially prompting a reversal or consolidation.
Similarly, the 2nd resistance at 151.92 also serves as a swing high resistance, highlighting its significance as another potential barrier to upward price movement.
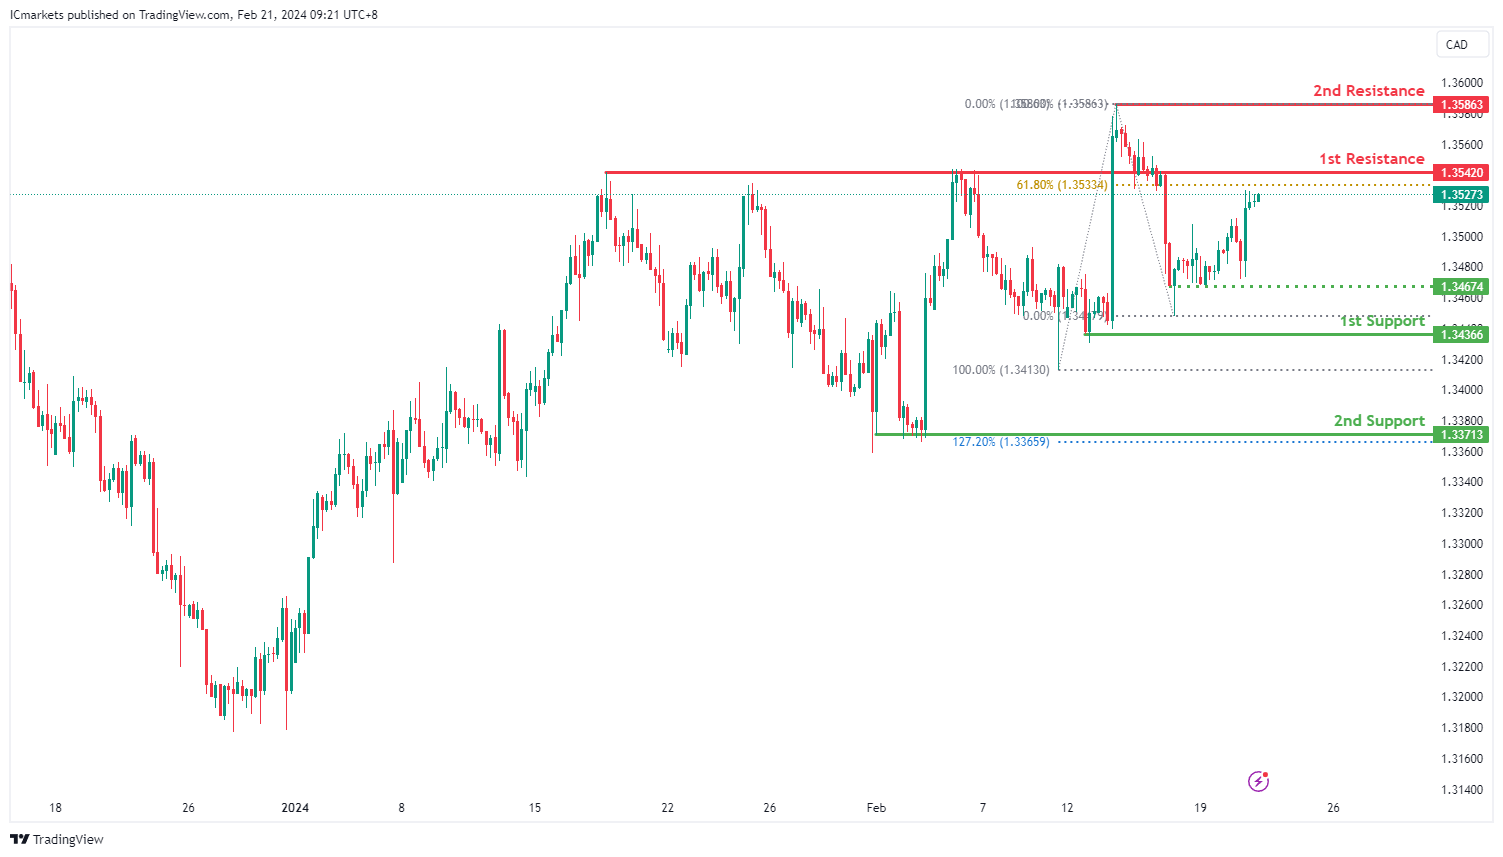
USD/CAD:
The USD/CAD chart currently exhibits an overall bullish momentum. In this context, there is a potential scenario for price to rise towards the 1st resistance.
The 1st resistance level at 1.3542 is identified as an overlap resistance that aligns close to the 61.80% Fibonacci Retracement level. Higher up, the 2nd resistance level at 1.3586 is noted as a swing-high resistance, further highlighting its importance as a potential resistance point.
To the downside, the intermediate support level at 1.3467 is identified as a pullback support while the 1st support level at 1.3436 is also marked as a pullback support. Further below, the 2nd support level at 1.3371 is also noted as a pullback support that aligns close to the 127.20% Fibonacci Extension level, further emphasizing its importance as a potential support zone.
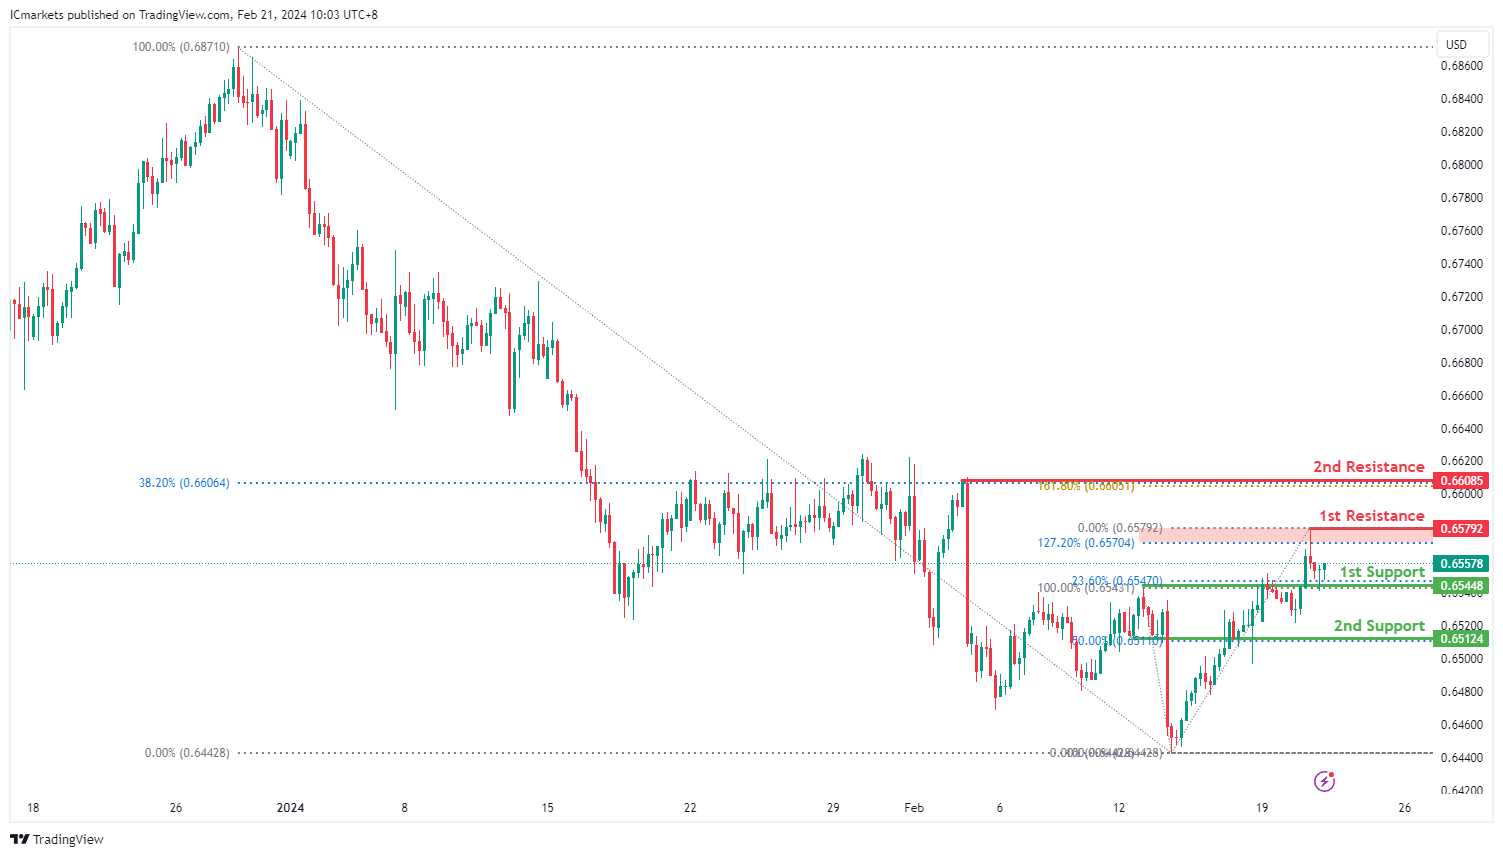
AUD/USD:
The AUD/USD chart currently exhibits an overall bullish momentum. In this context, there is a potential scenario for price to rise towards the 1st resistance.
The 1st resistance level at 0.6579 is identified as a pullback resistance that aligns close to the 127.20% Fibonacci Extension level. Higher up, the 2nd resistance level at 0.6608 is also marked as a pullback resistance that aligns with a confluence of Fibonacci levels i.e. the 38.20% Retracement and the 161.80% Extension, further highlighting its importance as a potential resistance point.
To the downside, the 1st support level at 0.6544 is identified as an overlap support that aligns with the 23.60% Fibonacci Retracement level. Further below, the 2nd support level at 0.6512 is noted as a pullback support that aligns with the 50.00% Fibonacci Retracement level, further emphasizing its importance as a potential support level.
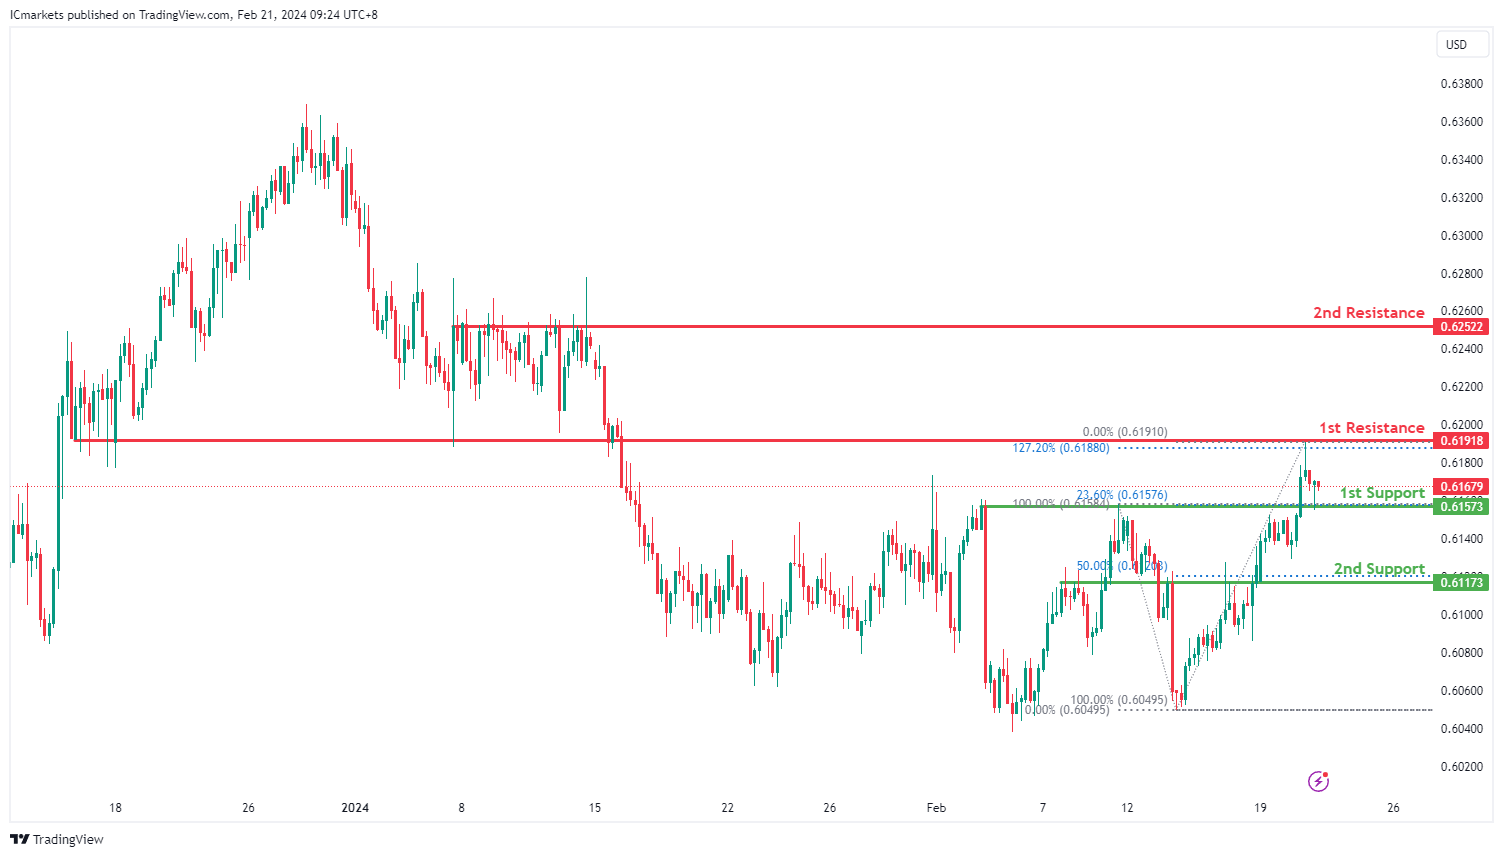
NZD/USD
The NZD/USD chart currently exhibits an overall bullish momentum. In this context, there is a potential scenario for price to rise towards the 1st resistance.
The 1st resistance level at 0.6191 is identified as an overlap resistance that aligns with the 127.20% Fibonacci Extension level. Higher up, the 2nd resistance level at 0.6252 is marked as a pullback resistance, further highlighting its importance as a potential resistance level.
To the downside, the 1st support level at 0.6157 is identified as an overlap support that aligns with the 23.60% Fibonacci Retracement level. Further below, the 2nd support level at 0.6117 is noted as a pullback support that aligns close to the 50.00% Fibonacci Retracement level, further emphasizing its importance as a potential support zone.
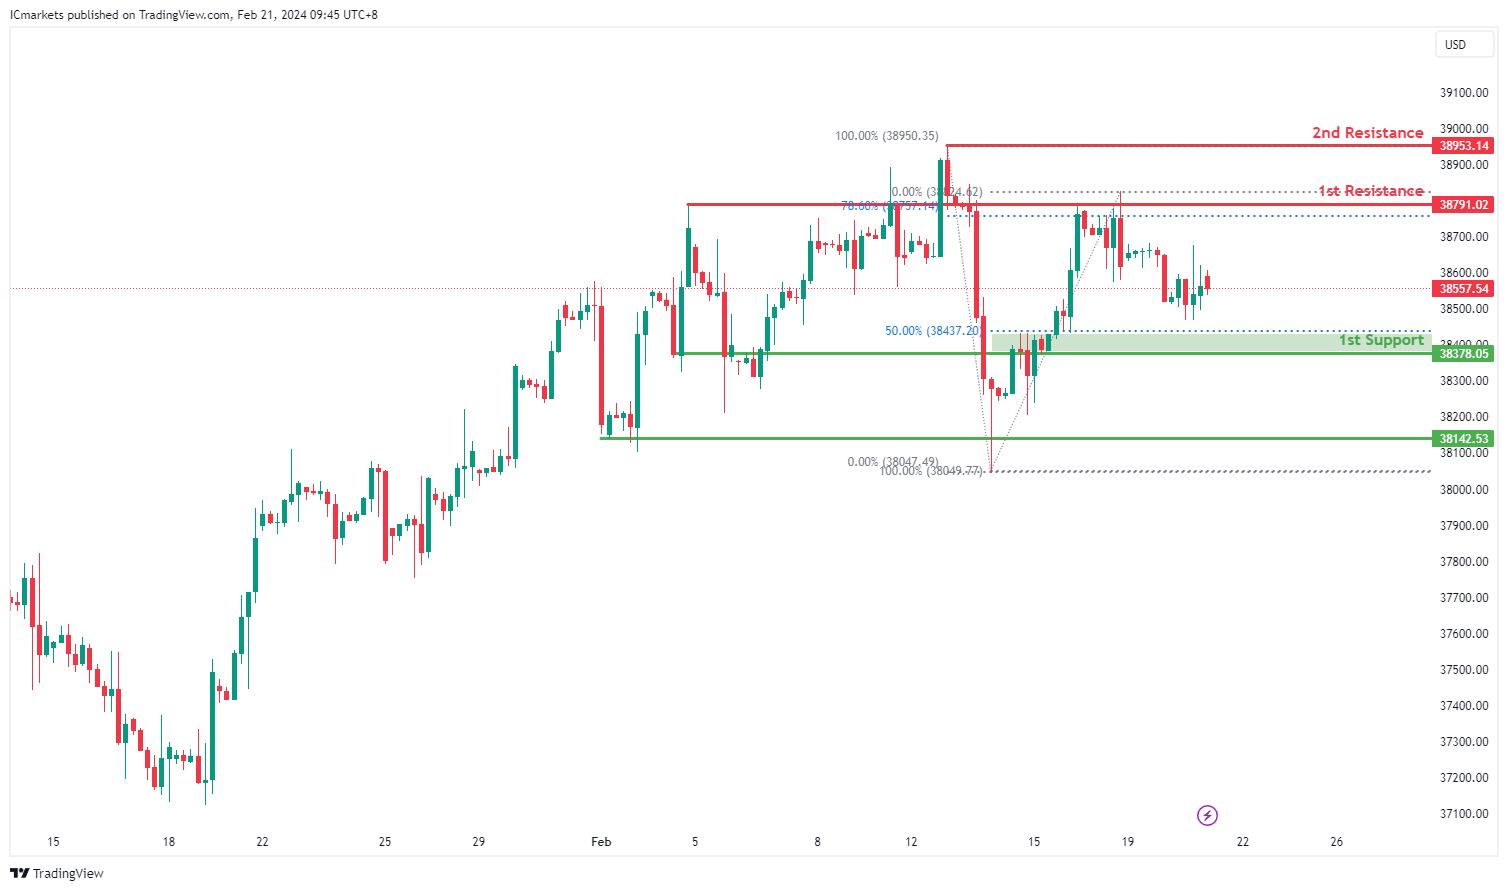
DJ30:
The DJ30 chart currently indicates a bearish momentum, suggesting a potential continuation of the downward trend. Several factors support the possibility of a bearish movement towards the 1st support level.
The 1st support at 38378.05 is significant as it coincides with both a pullback support and the 50% Fibonacci Retracement level. This convergence suggests a strong historical level where buying interest has previously emerged. Additionally, the 2nd support at 38142.53 reinforces the potential support zone, aligning with another pullback support.
On the resistance side, the 1st resistance level at 38791.02 is notable as it corresponds to a pullback resistance and the 78.60% Fibonacci Retracement level. This level represents a historical barrier to upward movement. Furthermore, the 2nd resistance at 38953.14 aligns with a swing high resistance, adding to its significance as a potential barrier to further bullish movement.
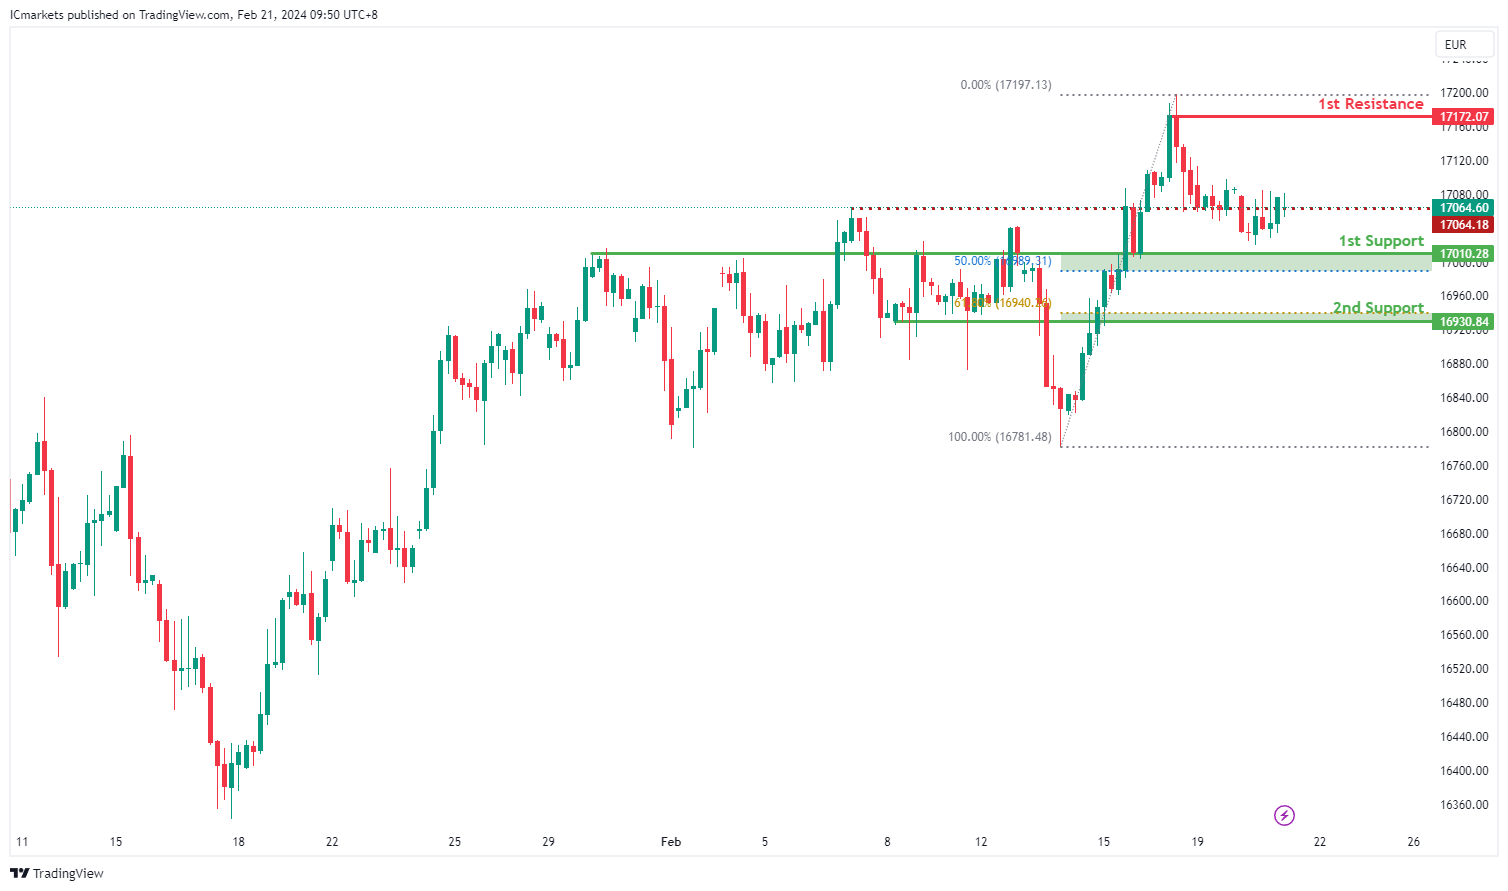
GER40:
The GER40 chart currently demonstrates a bullish momentum, suggesting a potential continuation of the upward trend. Several factors contribute to this bullish sentiment, supporting the possibility of a further upward movement towards the 1st resistance level.
The 1st support at 17010.28 is significant as it aligns with both an overlap support and the 50% Fibonacci Retracement level. This confluence indicates a strong historical level where buying interest has previously emerged. Additionally, the 2nd support at 16930.84 corresponds to a pullback support and the 61.80% Fibonacci Retracement level, reinforcing its importance as a potential support zone.
On the resistance side, the 1st resistance level at 17172.07 is notable as it represents a swing high resistance. This level suggests a historical barrier to further upward movement. Furthermore, the intermediate resistance at 17064.18 aligns with a swing high resistance, adding to its significance as a potential barrier to bullish movement.
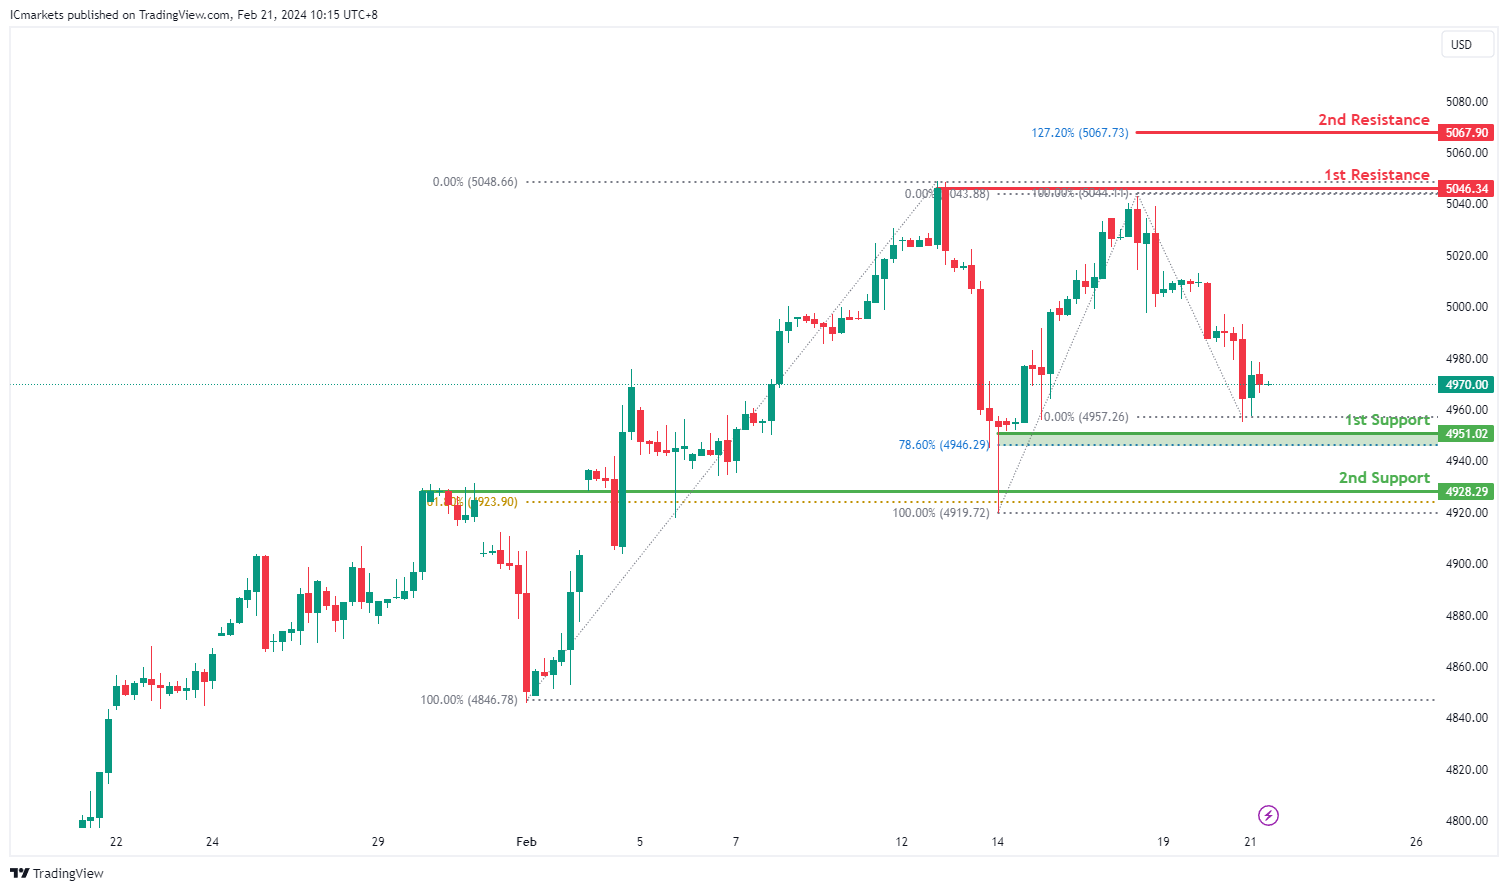
US500:
The US500 chart currently indicates a weak bullish momentum with low confidence, suggesting uncertainty in the market direction. However, several factors suggest a potential short-term scenario where the price could drop further to the 1st support before bouncing back towards the 1st resistance.
The 1st support level at 4951.02 is significant as it aligns with both a swing low support and the 78.60% Fibonacci Retracement level. This convergence indicates a strong historical level where buying interest might emerge, potentially providing support to the price. Additionally, the 2nd support at 4928.29 corresponds to an overlap support and the 61.80% Fibonacci Retracement level, reinforcing its significance as a potential support zone.
On the resistance side, the 1st resistance level at 5046.34 is identified as a swing high resistance. This level may act as a barrier to further upward movement. Furthermore, the 2nd resistance at 5067.90 coincides with the 127.20% Fibonacci Extension, adding to its significance as a potential resistance level.
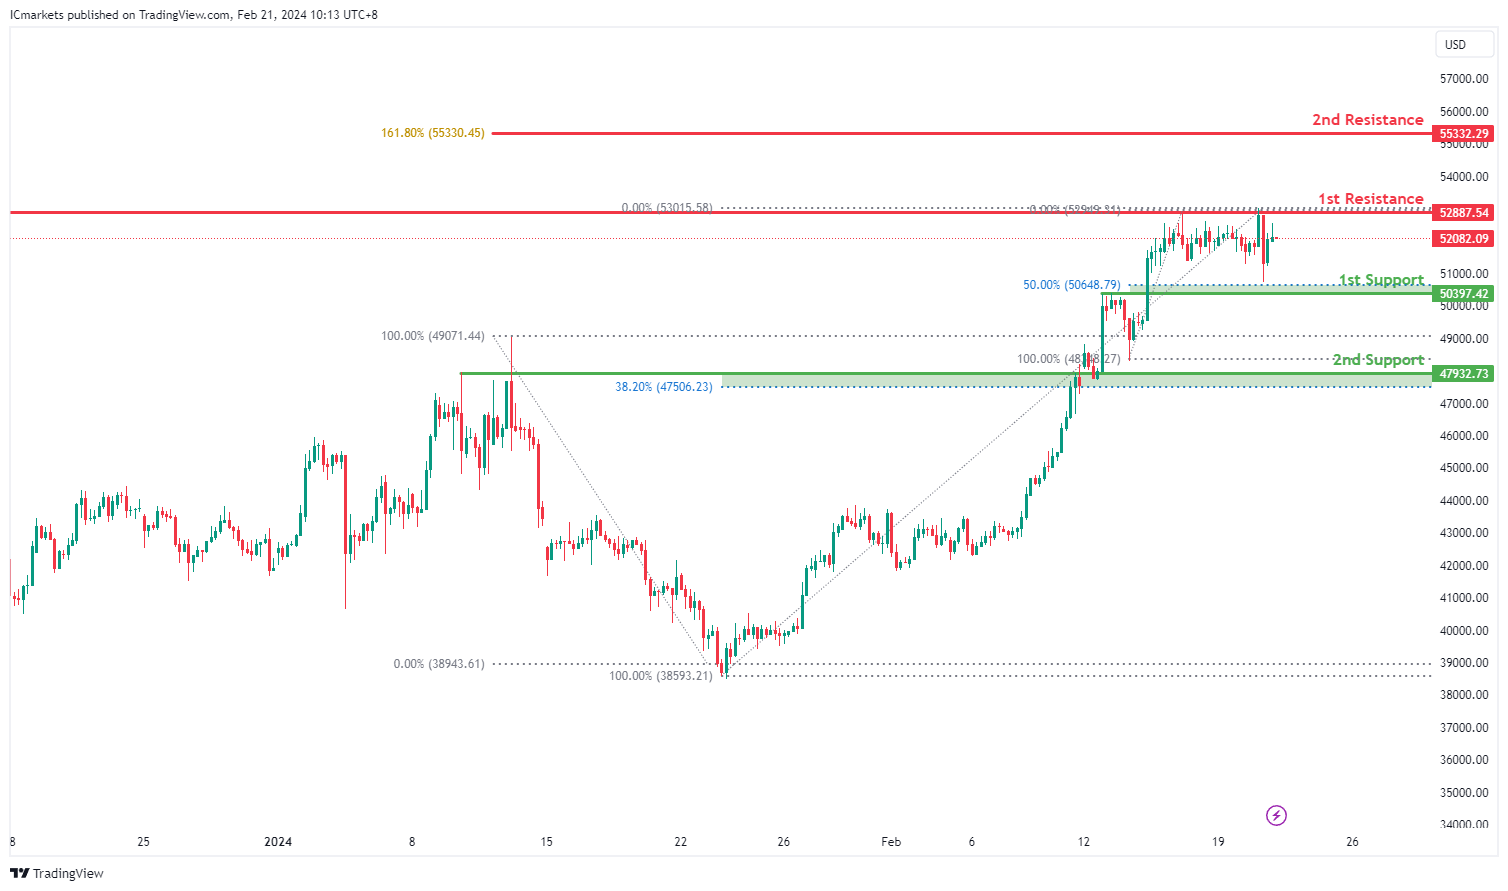
BTC/USD:
The BTC/USD chart currently shows a bullish momentum, indicating a potential continuation of the upward trend. Several factors contribute to this sentiment, supporting the possibility of a bullish movement towards the 1st resistance level.
The 1st support level at 50397.42 aligns with a pullback support and the 50% Fibonacci Retracement level. This convergence suggests a strong historical level where buying interest has emerged in the past. Additionally, the 2nd support at 47932.73 corresponds to an overlap support and the 38.20% Fibonacci Retracement, further reinforcing its significance as a potential support zone.
On the resistance side, the 1st resistance level at 52887.54 is identified as a multi-swing high resistance, indicating a historical barrier to upward movement. Furthermore, the 2nd resistance level at 55332.29 coincides with the 161.80% Fibonacci Extension, adding to its significance as a potential barrier to further bullish movement.
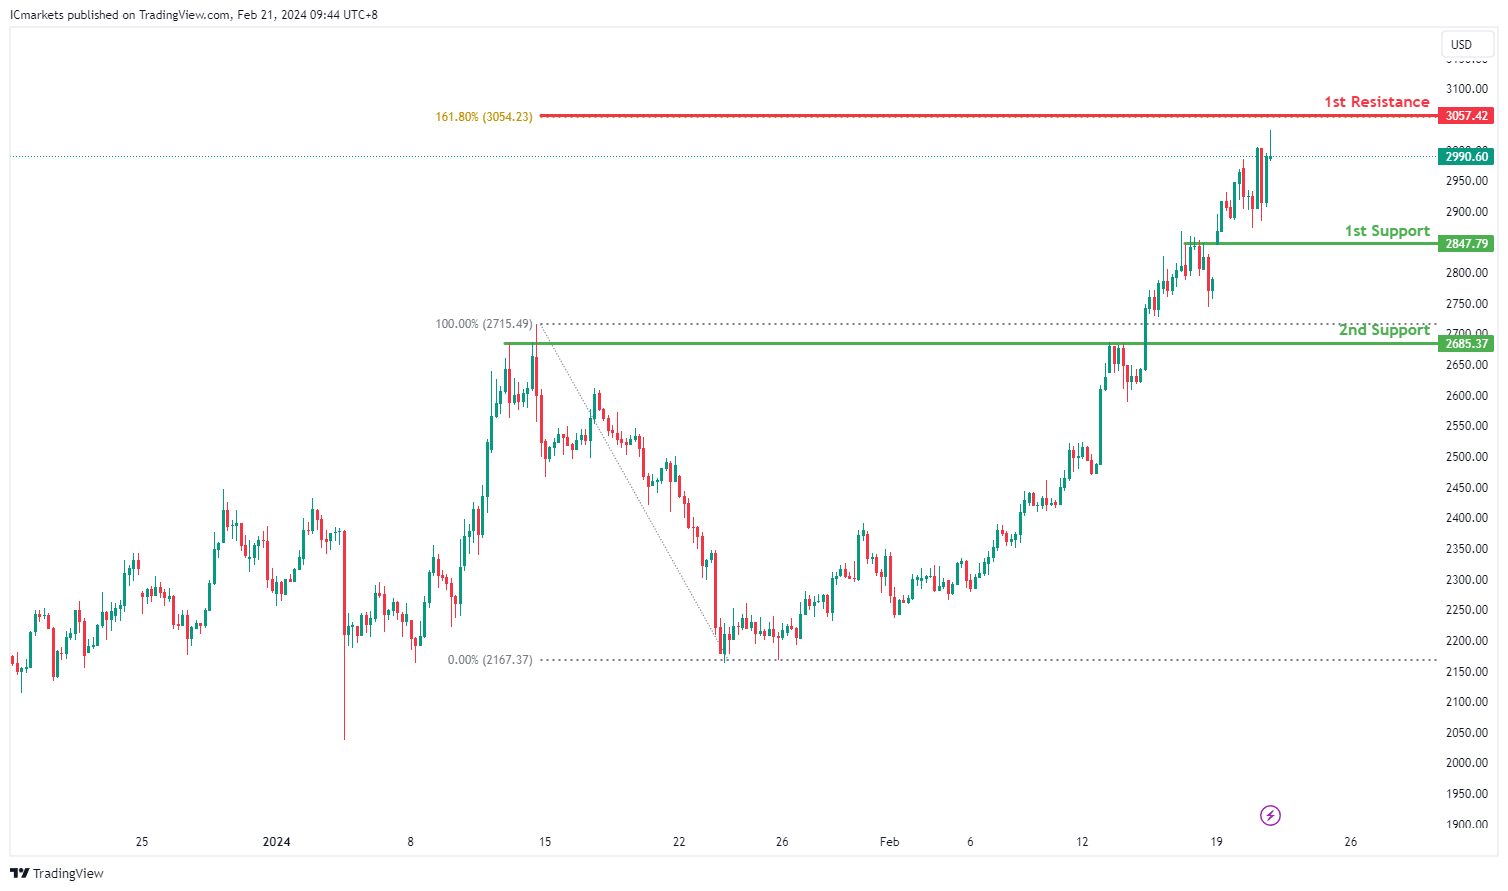
ETH/USD:
The ETH/USD chart currently exhibits bullish momentum, suggesting a potential continuation of the upward trend. Several factors support the possibility of a bullish movement towards the 1st resistance level.
The 1st support level at 2847.79 aligns with an overlap support, indicating a significant historical level where buying interest has emerged. Additionally, the 2nd support at 2685.37 corresponds to a pullback support, further reinforcing its importance as a potential area of support.
On the resistance side, the 1st resistance level at 3057.42 is identified as a 161.80% Fibonacci Extension. Fibonacci extensions are often used to identify potential levels of future resistance or support based on past price movements.
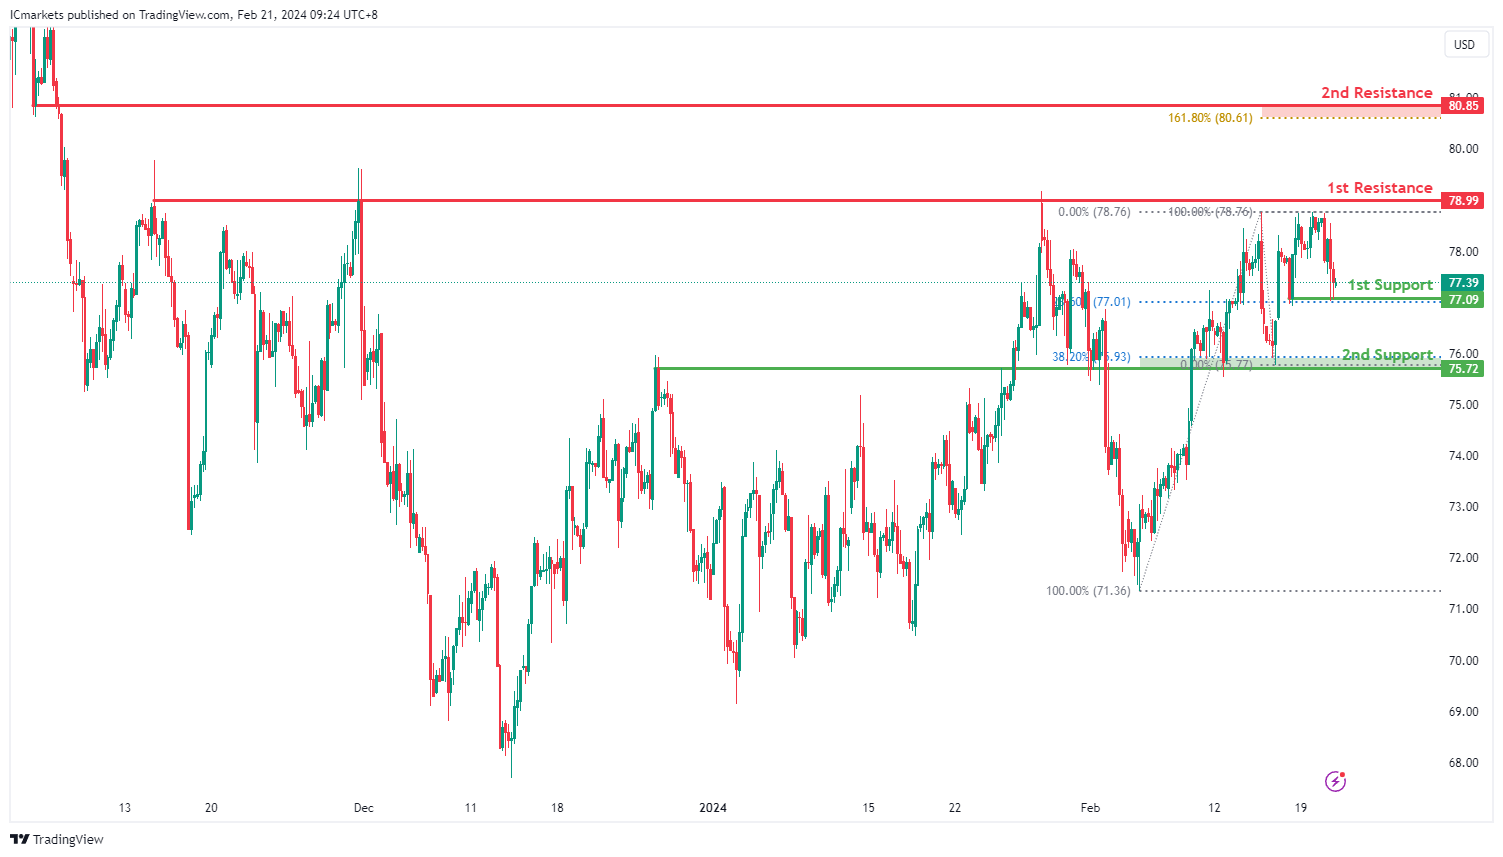
WTI/USD:
The WTI (West Texas Intermediate) chart currently exhibits an overall bullish momentum. However, there is a potential scenario for price to drop towards the 1st support before making a bullish bounce and rise towards the 1st resistance.
The 1st support level at 77.09 is noted as a pullback support that aligns with the 23.60% Fibonacci Retracement level. Further below, the 2nd support level at 75.72 is marked as an overlap support that aligns close to the 38.20% Fibonacci Retracement level, reinforcing its significance as a key support zone.
To the upside, the 1st resistance level at 78.99 is identified as a multi-swing-high resistance. Higher up, the 2nd resistance level at 80.85 is marked as a pullback resistance that aligns close to the 161.80% Fibonacci Extension level, further highlighting its importance as a potential resistance zone.
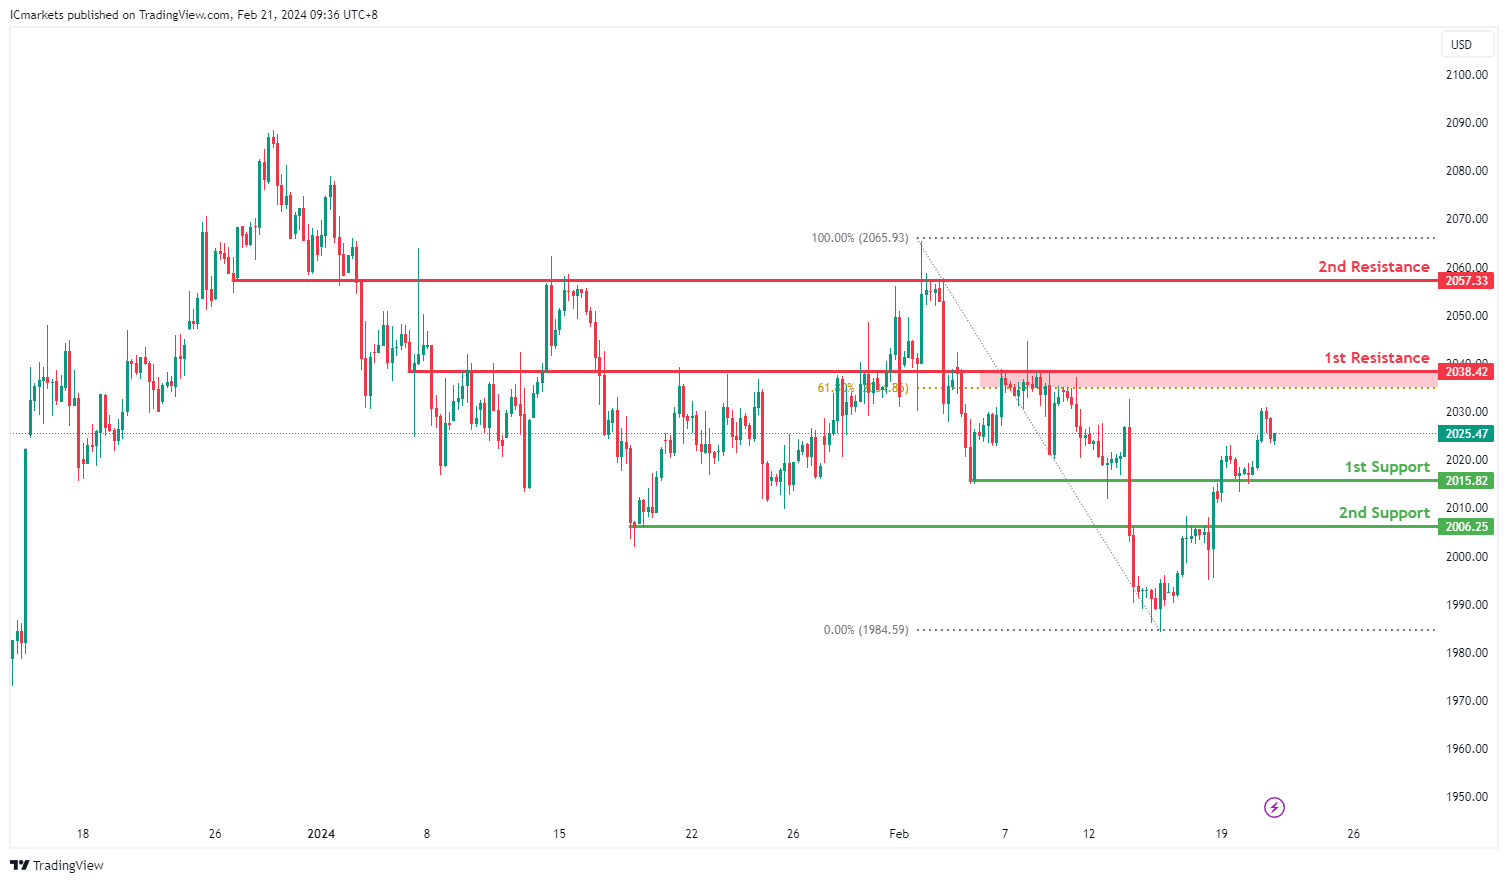
XAU/USD (GOLD):
The XAUUSD (Gold/US Dollar) chart currently demonstrates bullish momentum, suggesting a potential bullish bounce off the 1st support level followed by a movement towards the 1st resistance.
The 1st support level at 2015.82 is considered significant as it aligns with an overlap support, indicating a historical level where buying interest has been observed. This level may attract buyers, potentially leading to a bounce in the price.
Additionally, the 2nd support at 2006.25 is identified as a pullback support, further reinforcing its importance as a level where buyers may step in to support the price. This level indicates a potential retracement area where buying interest could be renewed.
On the resistance side, the 1st resistance level at 2038.42 is characterized as an overlap resistance, suggesting its significance as a historical barrier where selling pressure may increase. This level could act as a hurdle for further upward movement in the price of gold.
Similarly, the 2nd resistance at 2057.33 is identified as an overlap resistance, indicating its importance as a level where selling interest may intensify, potentially limiting upward price movement.


