
DXY:
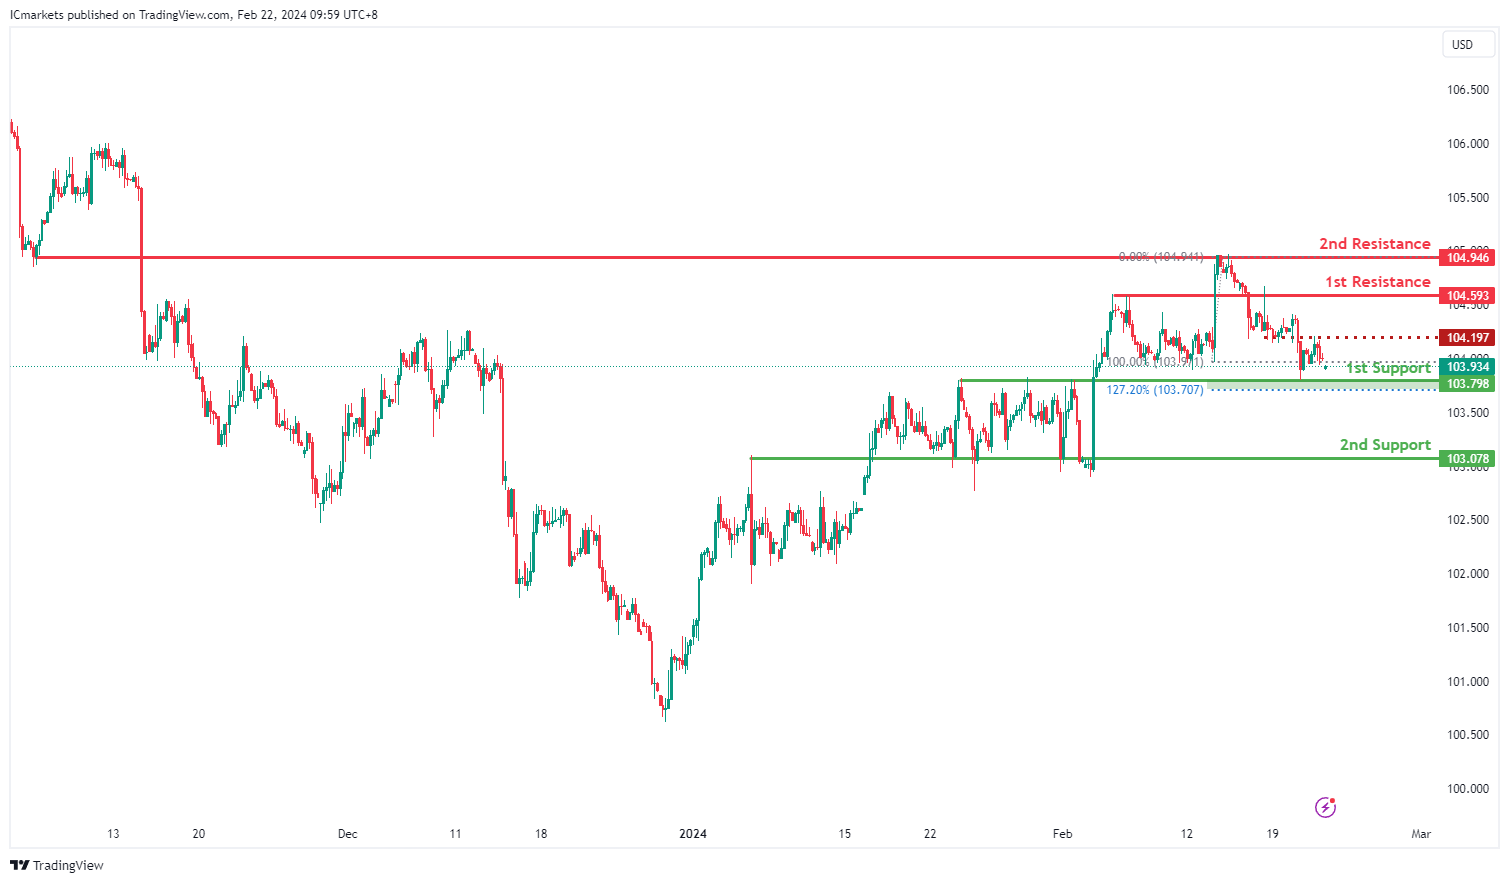
The DXY (US Dollar Index) chart currently exhibits bullish momentum, suggesting a potential bullish bounce off the 1st support level followed by a movement towards the 1st resistance.
The 1st support level at 103.79 is identified as an overlap support, indicating a historical level where buying interest has previously emerged to support the price. Additionally, the presence of the 127.20% Fibonacci Extension adds further significance to this support zone, potentially reinforcing its ability to attract buyers.
Similarly, the 2nd support at 103.07 is characterized as an overlap support, further strengthening its importance as a level where buyers may intervene to support the price.
On the resistance side, the 1st resistance level at 104.59 is identified as an overlap resistance, indicating its historical significance as a barrier where selling pressure may increase.
Furthermore, the 2nd resistance at 104.94 is noted as an overlap resistance, further reinforcing its significance as a level where selling interest may intensify.
An intermediate resistance level at 104.19 is also identified, aligning with an overlap resistance. This level adds additional confluence to the resistance zone, potentially acting as a barrier to further upward movement.
EUR/USD:
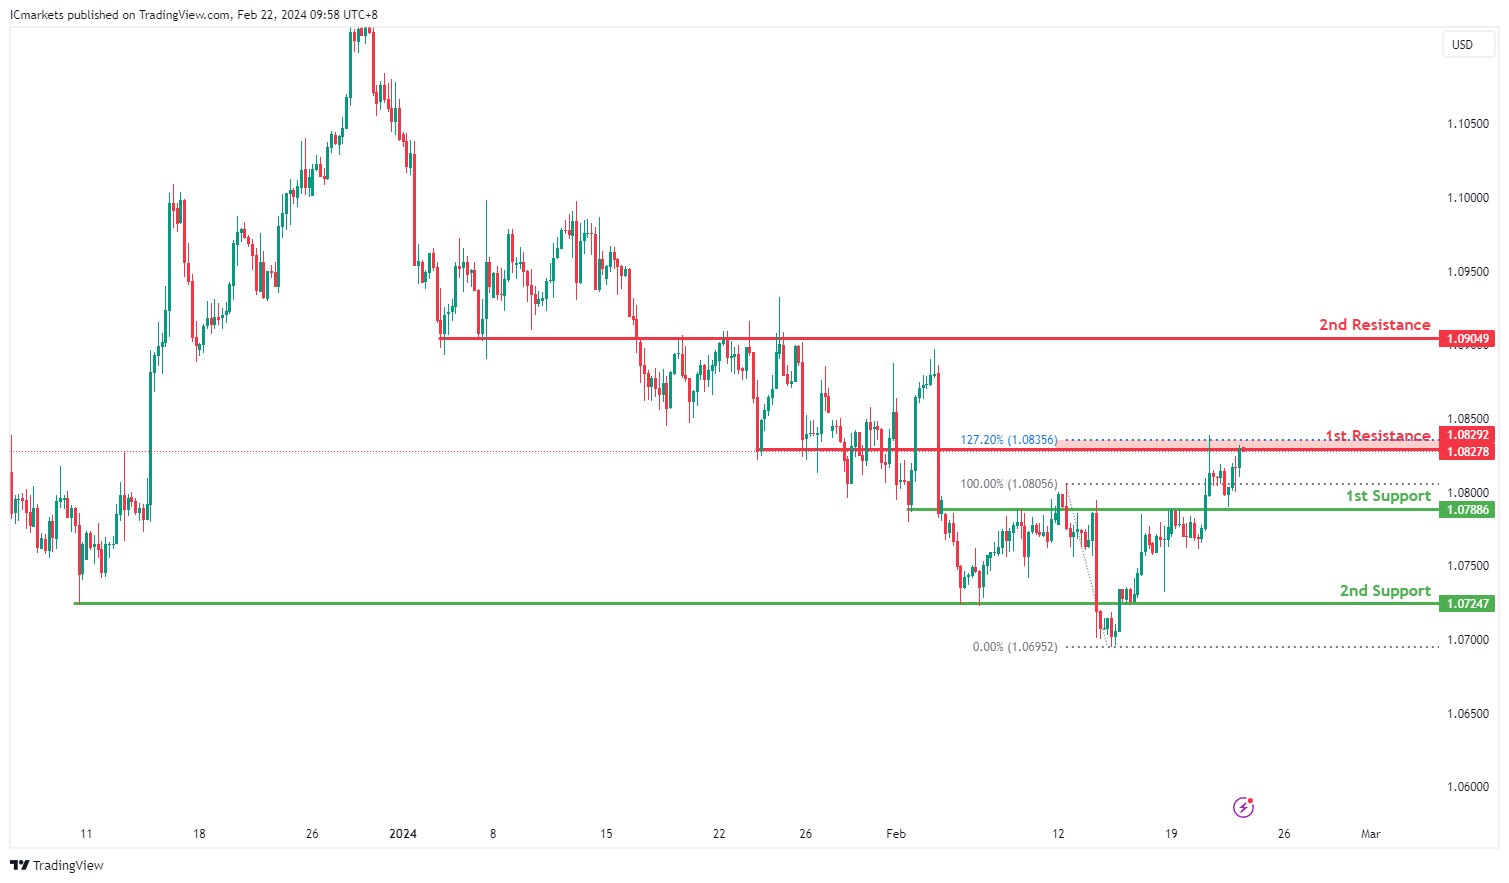
The EUR/USD chart currently indicates a bearish momentum, suggesting a potential bearish reaction off the 1st resistance level followed by a drop towards the 1st support.
The 1st support at 1.0788 is identified as an overlap support, indicating its historical significance as a level where buying interest has previously emerged to support the price.
Additionally, the 2nd support at 1.0724 is characterized as an overlap support, further reinforcing its importance as a potential level where buyers may intervene to support the price.
On the resistance side, the 1st resistance level at 1.0829 is identified as an overlap resistance, indicating its historical significance as a barrier where selling pressure may increase. Furthermore, the presence of the 127.20% Fibonacci Extension adds further confluence to this resistance zone.
The 2nd resistance at 1.0904 is noted as an overlap resistance, further reinforcing its significance as a level where selling interest may intensify.
EUR/JPY:
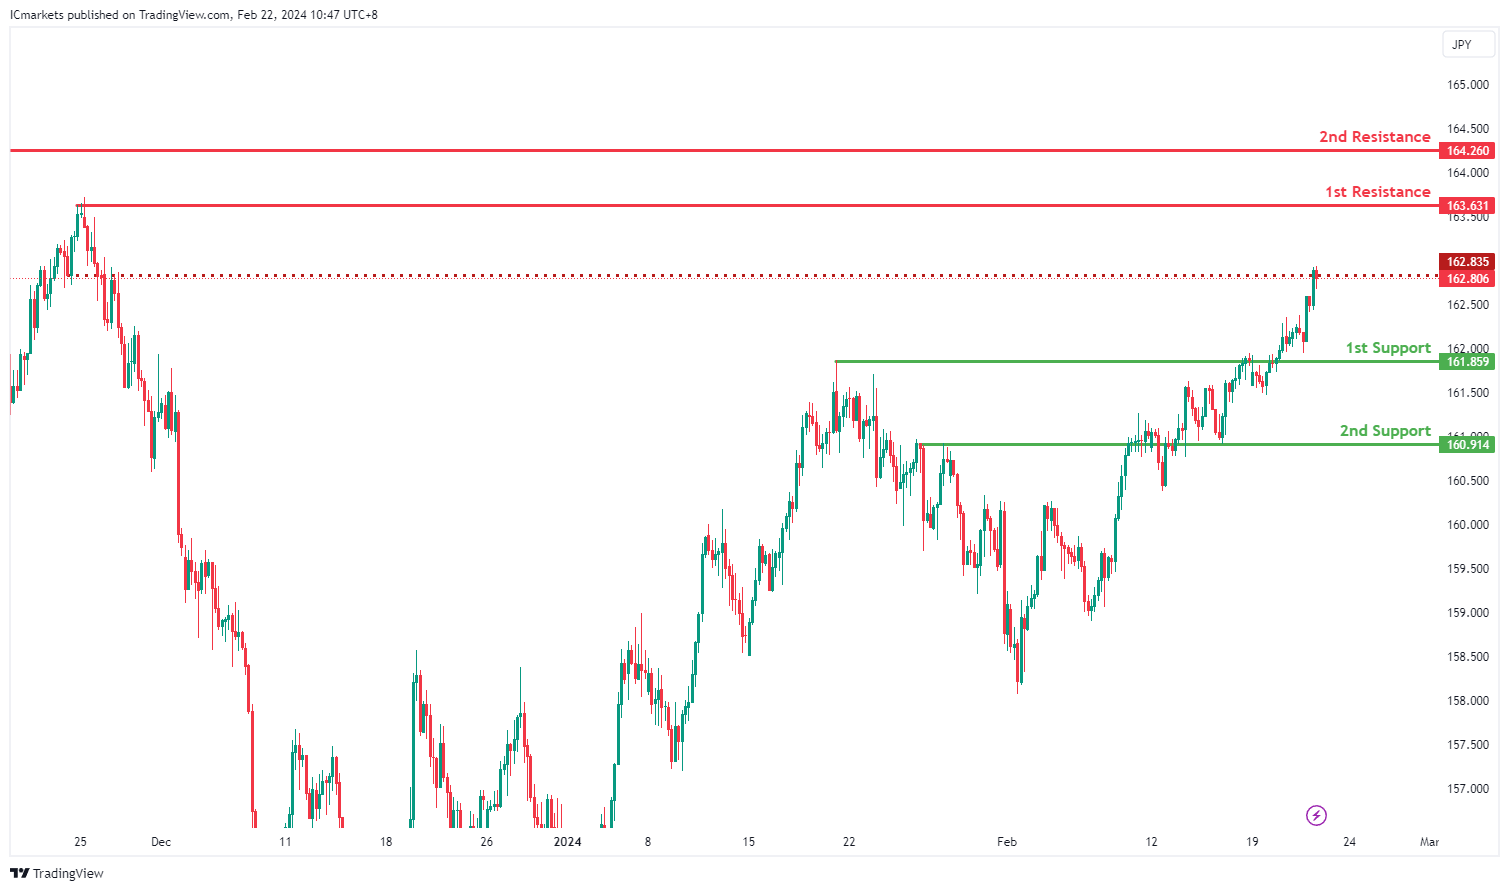
The EUR/JPY chart is currently exhibiting bullish momentum, indicating a potential continuation of the upward trend. Several factors contribute to this sentiment, supporting the possibility of a bullish movement towards the 1st resistance level.
The 1st support level at 161.859 aligns with an overlap support, suggesting a historical level where buying interest has previously emerged. Similarly, the 2nd support at 160.914 corresponds to another overlap support, reinforcing its significance as a potential area of support.
On the resistance side, the intermediate resistance at 162.835 is identified as an overlap resistance, indicating a historical barrier to upward movement. Additionally, the 1st resistance level at 163.631 aligns with a swing high resistance, further strengthening its significance as a potential barrier to further upward movement.
Furthermore, the 2nd resistance level at 164.26 is identified as a multi-swing high resistance, adding to its significance as a potential barrier to further bullish movement.
EUR/GBP:
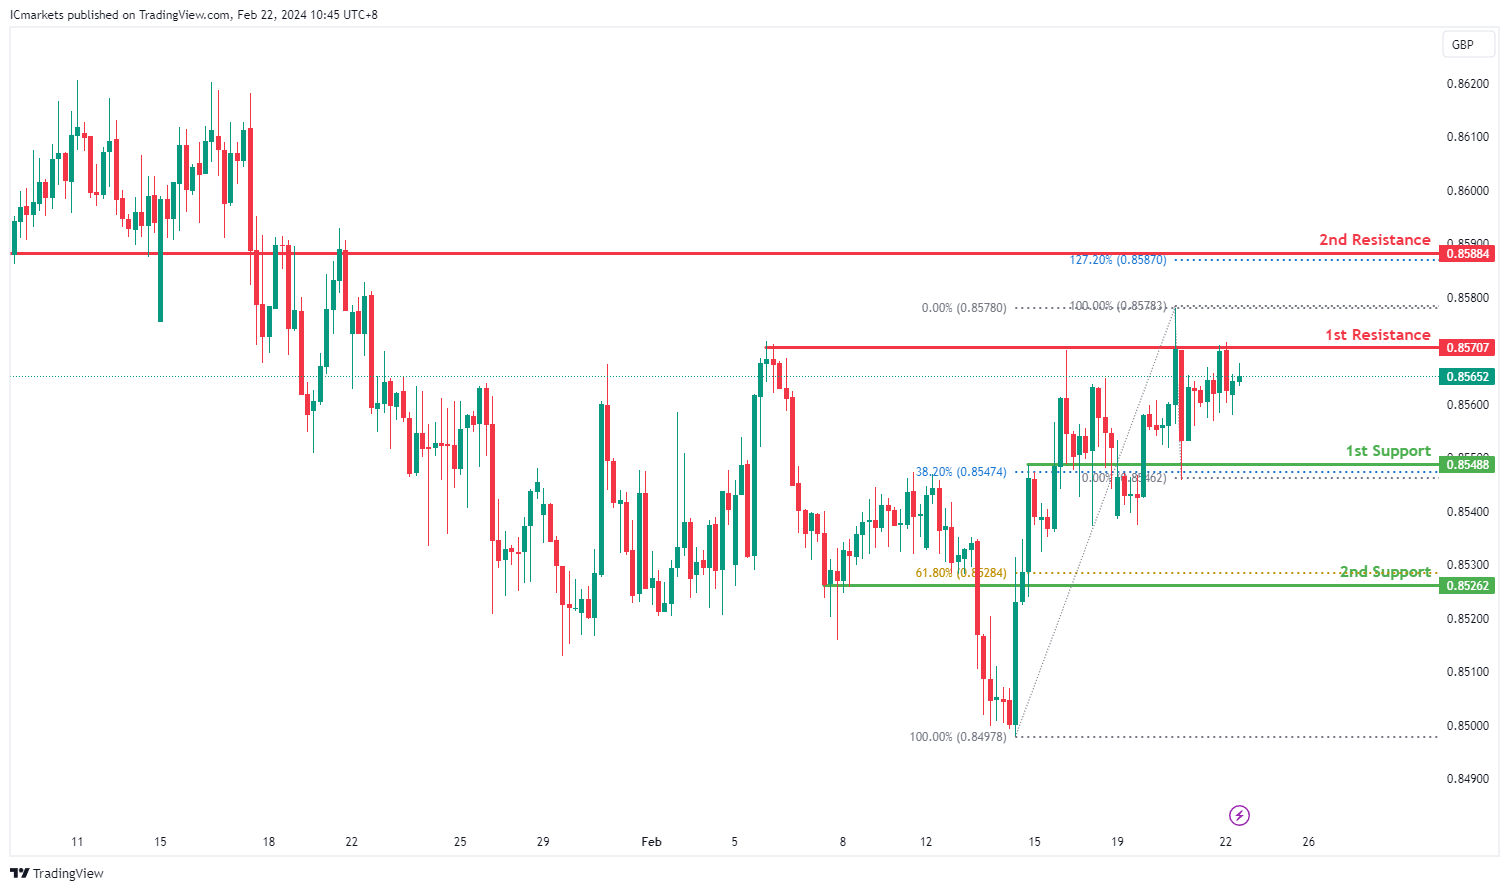
The EUR/GBP chart currently displays bullish momentum, suggesting a potential continuation of the upward trend. Several factors support the possibility of a bullish movement towards the 1st resistance level.
The 1st support at 0.85488 aligns with an overlap support and the 38.20% Fibonacci Retracement, indicating a significant historical level where buying interest has emerged. Additionally, the 2nd support at 0.85262 corresponds to a swing low support and the 61.80% Fibonacci Retracement, further reinforcing its significance as a potential area of support.
On the resistance side, the 1st resistance level at 0.85707 is identified as a pullback resistance, suggesting a historical barrier to upward movement. Moreover, the 2nd resistance level at 0.85884 aligns with an overlap resistance and the 127.20% Fibonacci Extension, adding to its significance as a potential barrier to further bullish movement.
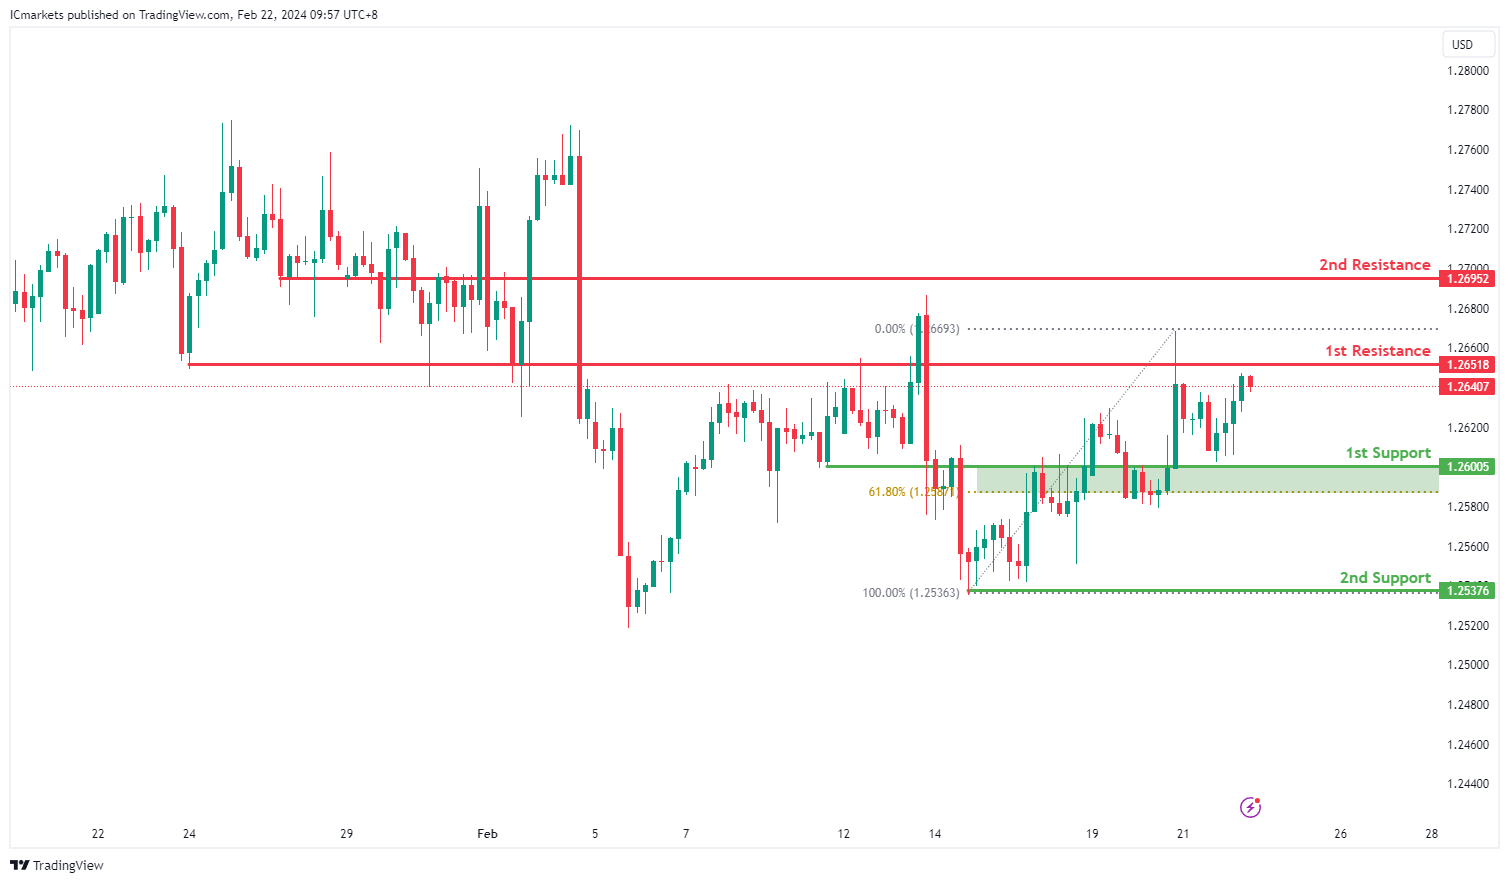
GBP/USD:
The GBP/USD chart currently suggests a bearish momentum, indicating a potential bearish reaction off the 1st resistance level followed by a drop towards the 1st support.
The 1st support at 1.2600 is identified as a pullback support, suggesting its significance as a level where buying interest may emerge to support the price.
Furthermore, the 2nd support at 1.2537 is characterized as a multi-swing low support, indicating its historical importance as a level where buyers have previously intervened to support the price.
On the resistance side, the 1st resistance level at 1.2651 is identified as an overlap resistance, suggesting its historical significance as a barrier where selling pressure may increase.
Additionally, the 2nd resistance at 1.2695 is noted as a pullback resistance, further reinforcing its importance as a level where selling interest may intensify.
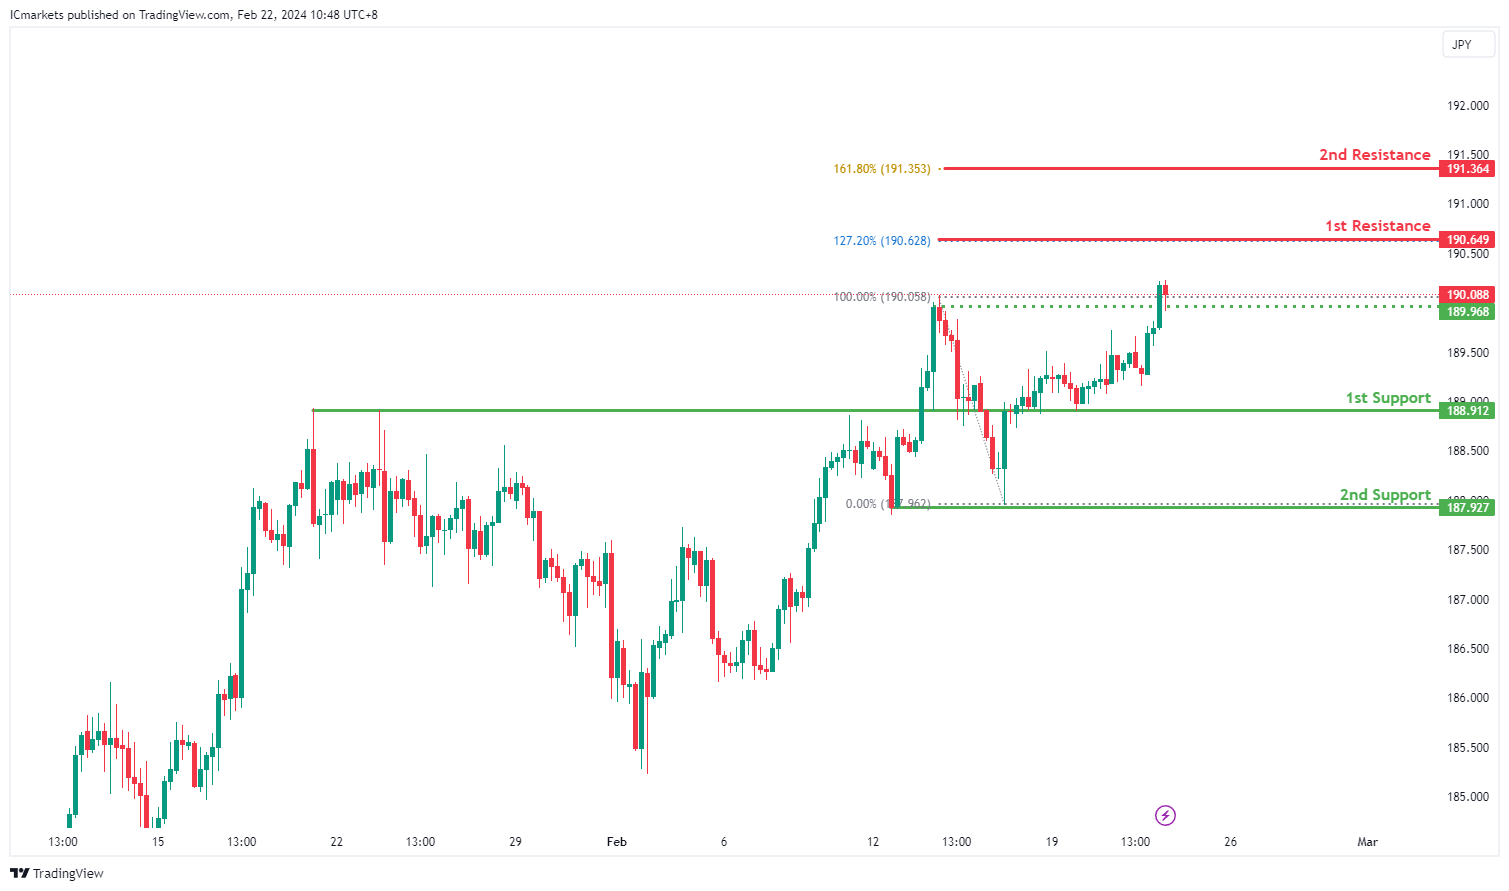
GBP/JPY:
The GBP/JPY chart currently exhibits bullish momentum, suggesting a potential continuation of the upward trend. Several factors support the possibility of a bullish movement towards the 1st resistance level.
The 1st support at 188.912 aligns with an overlap support, indicating a significant historical level where buying interest has emerged. Additionally, the 2nd support at 187.927 corresponds to a swing low support, further reinforcing its importance as a potential area of support.
On the resistance side, the 1st resistance level at 190.649 aligns with the 127.20% Fibonacci Extension, suggesting a potential barrier to further upward movement. Moreover, the 2nd resistance level at 191.364 coincides with the 161.80% Fibonacci Extension, adding to its significance as a potential barrier to further bullish movement.
An intermediate support level at 189.97 is also identified as a pullback support, providing additional reinforcement to the support structure.
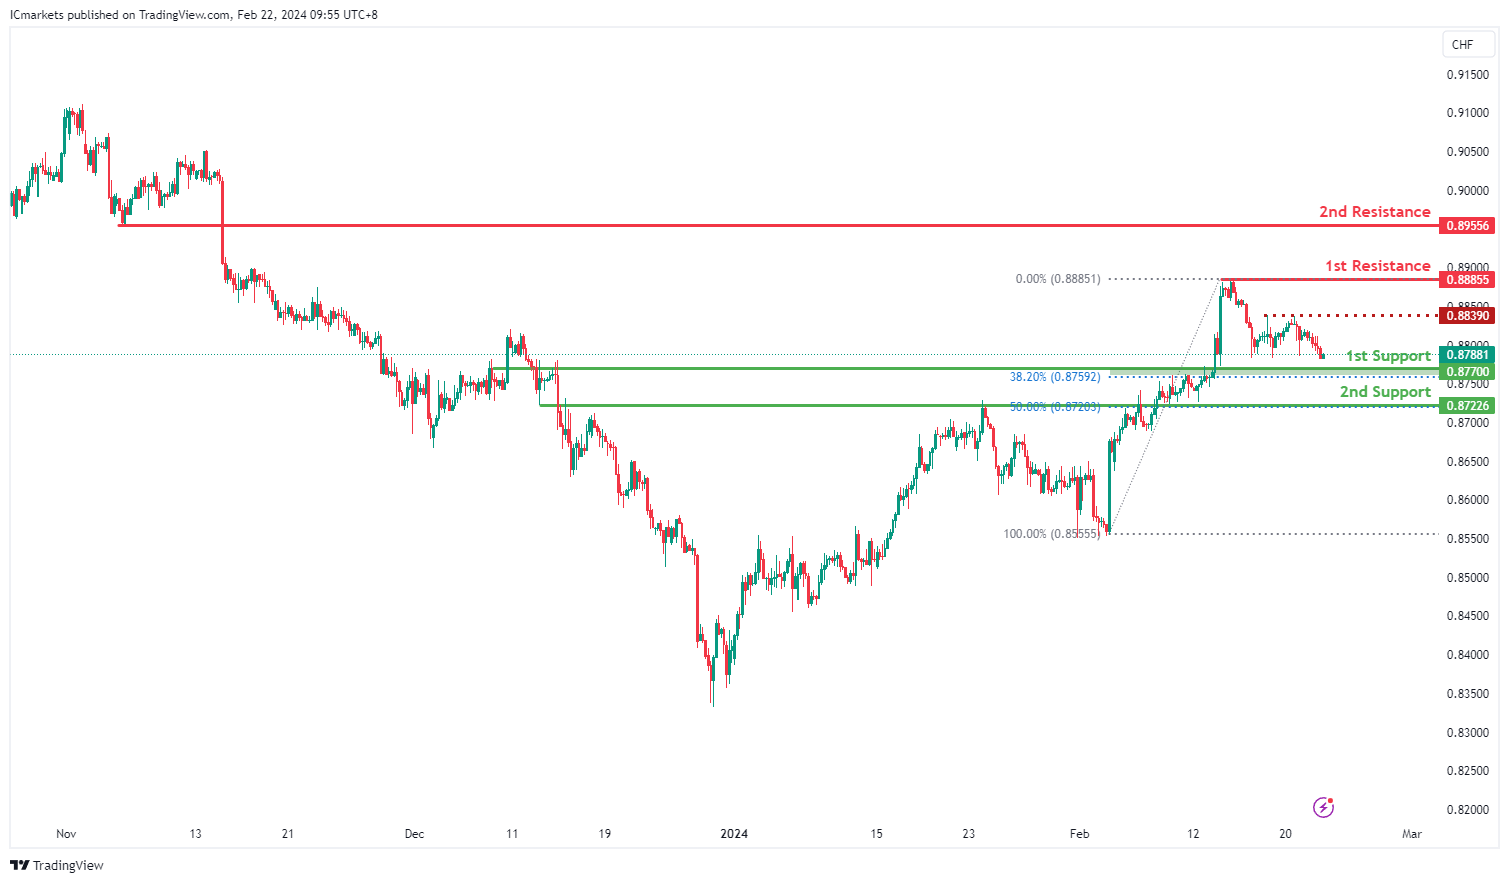
USD/CHF:
The USD/CHF chart currently indicates a bullish momentum, suggesting a potential bullish bounce off the 1st support level followed by a movement towards the 1st resistance.
The 1st support at 0.8770 is identified as an overlap support and coincides with the 38.20% Fibonacci Retracement level. This convergence implies a significant historical level where buying interest has previously emerged, potentially providing support to the price if tested.
Similarly, the 2nd support at 0.8722 is characterized as an overlap support and corresponds to the 50% Fibonacci Retracement level. This level also indicates a strong historical area where buyers have intervened to support the price, further reinforcing its significance as a potential support zone.
On the resistance side, the 1st resistance level at 0.8885 is identified as a multi-swing high resistance. This level suggests that it has acted as a significant barrier to upward price movements in the past, indicating potential selling pressure near this level.
Additionally, the 2nd resistance at 0.8955 is noted as a pullback resistance. This suggests that it has served as a level where selling interest has intensified, further confirming its importance as a resistance zone.
An intermediate resistance level at 0.8839 is also identified, aligning with the multi-swing high resistance. This level could act as an additional barrier to upward movement, potentially influencing price action in the short term.
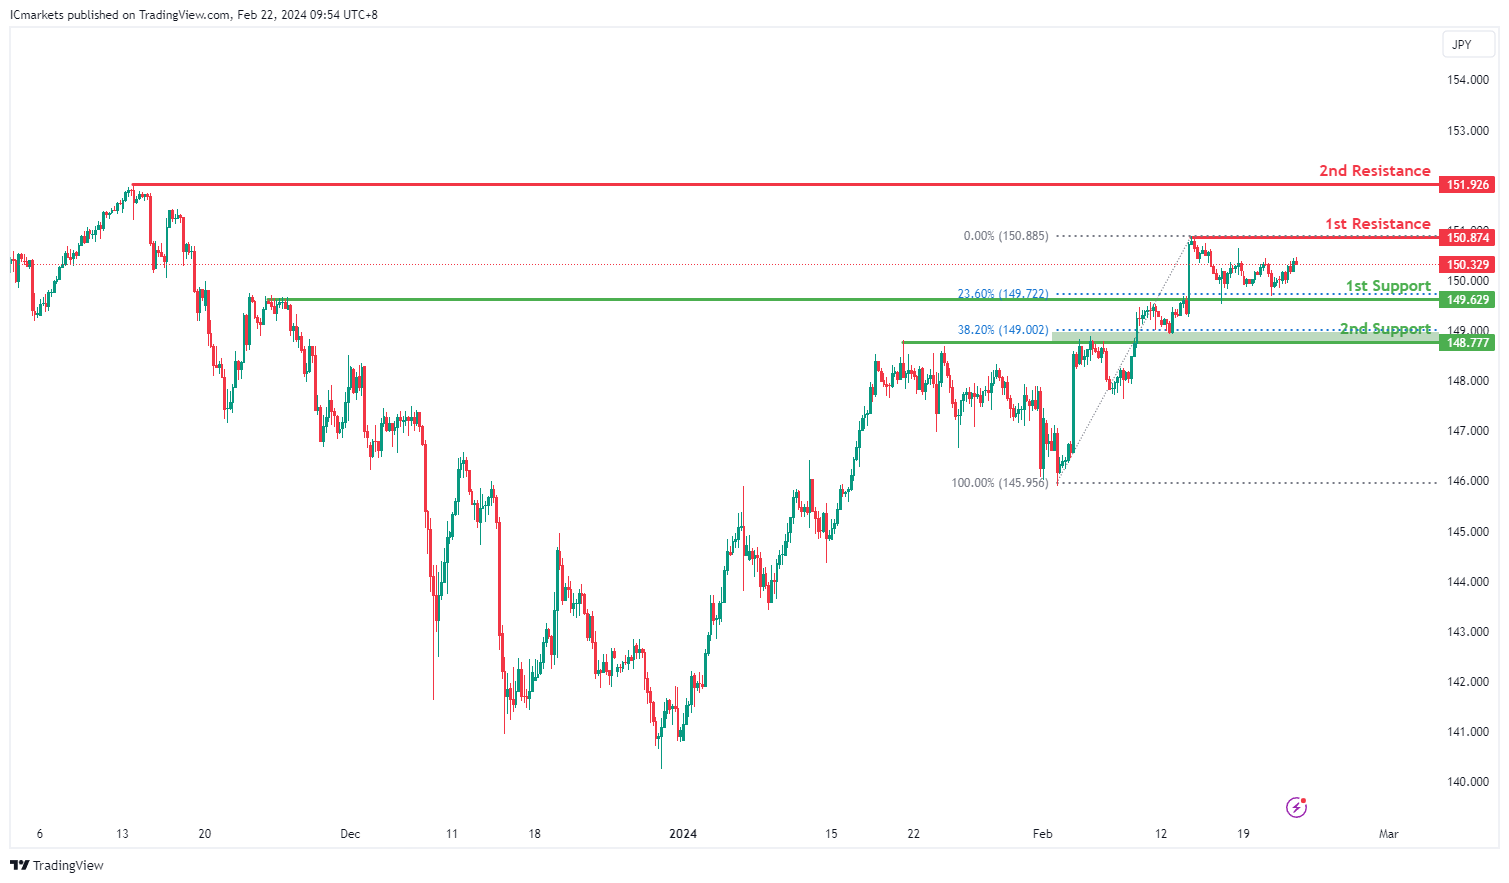
USD/JPY:
The USD/JPY chart currently suggests a neutral momentum, indicating a potential fluctuation between the 1st resistance and 1st support levels.
The 1st support at 149.62 is identified as an overlap support and aligns with the 23.60% Fibonacci Retracement level. This convergence suggests a strong historical level where buying interest has emerged in the past, potentially providing support to the price if tested.
Similarly, the 2nd support at 148.77 is characterized as an overlap support and corresponds to the 38.20% Fibonacci Retracement level. This level also indicates a significant historical area where buyers have intervened to support the price, reinforcing its importance as a potential support zone.
On the resistance side, the 1st resistance level at 150.87 is identified as a swing high resistance. This level suggests that it has acted as a significant barrier to upward price movements in the past, indicating potential selling pressure near this level.
Additionally, the 2nd resistance at 151.92 is noted as another swing high resistance, further confirming its importance as a historical point where selling interest has been strong.
USD/CAD:
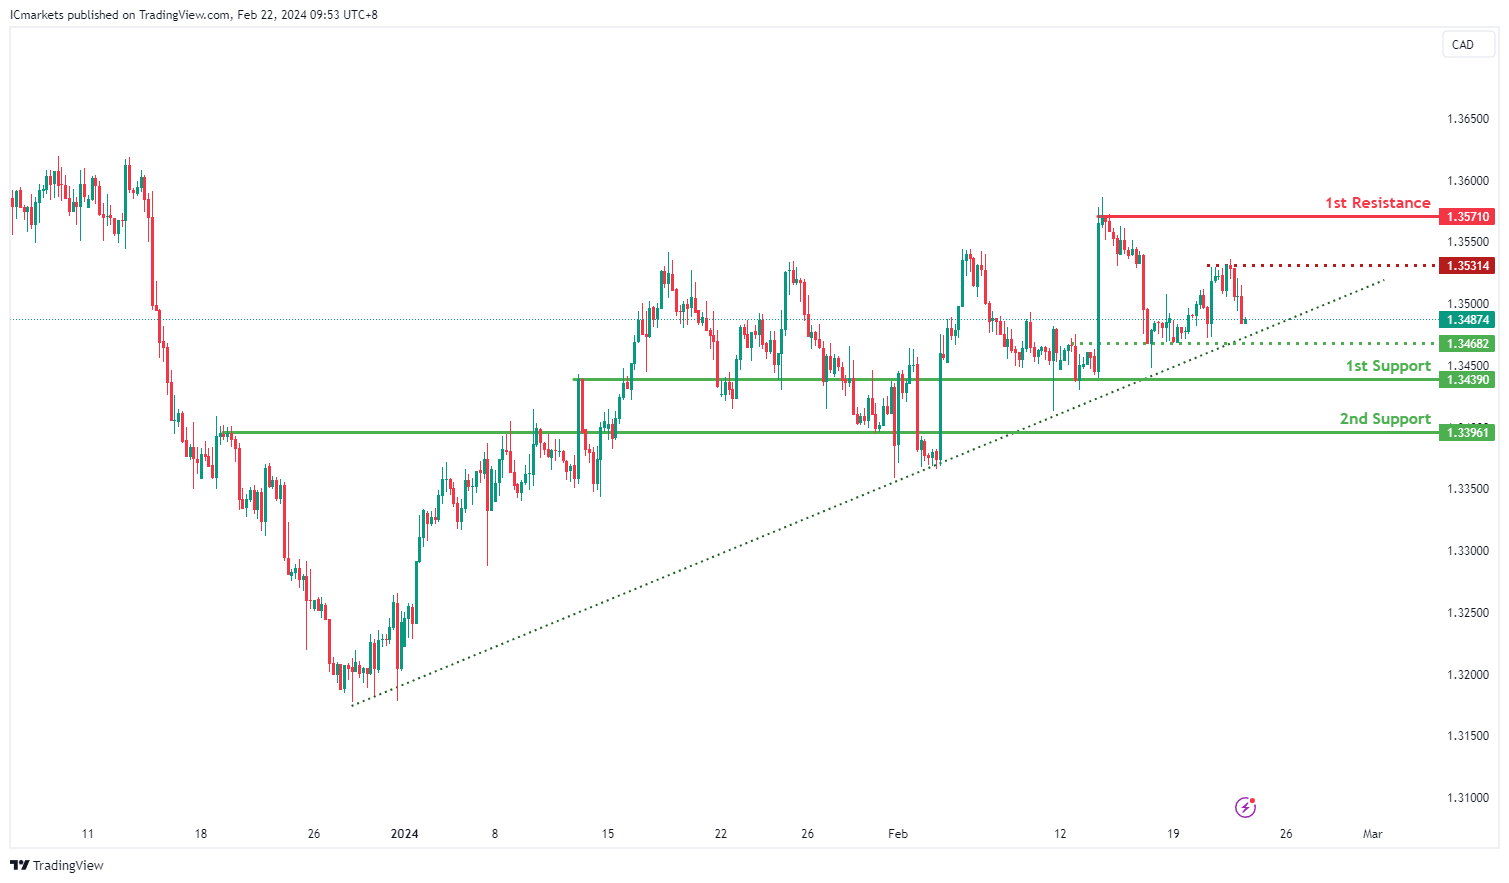
The USD/CAD chart currently exhibits a bullish momentum, supported by its position within a bullish ascending channel, signaling a potential uptrend continuation.
Potential price action could involve a bullish rebound off the 1st support level, followed by an advance towards the 1st resistance level.
The 1st support at 1.3439 is deemed significant as a historical level of buying interest, acting as a pullback support where buyers may step in to support the price.
Moreover, the 2nd support at 1.3396 is characterized as a pullback support, indicating its historical relevance as a level where buyers have intervened, adding further strength to the support zone.
On the resistance side, the intermediate resistance at 1.3531 is identified as a swing high resistance, suggesting its historical significance as a barrier to upward movement, potentially prompting a pullback or consolidation.
Additionally, the 1st resistance level at 1.3571 is recognized as a multi-swing high resistance, further validating its importance as a historical point where selling pressure has emerged, potentially limiting further upward movement.
AUD/USD:
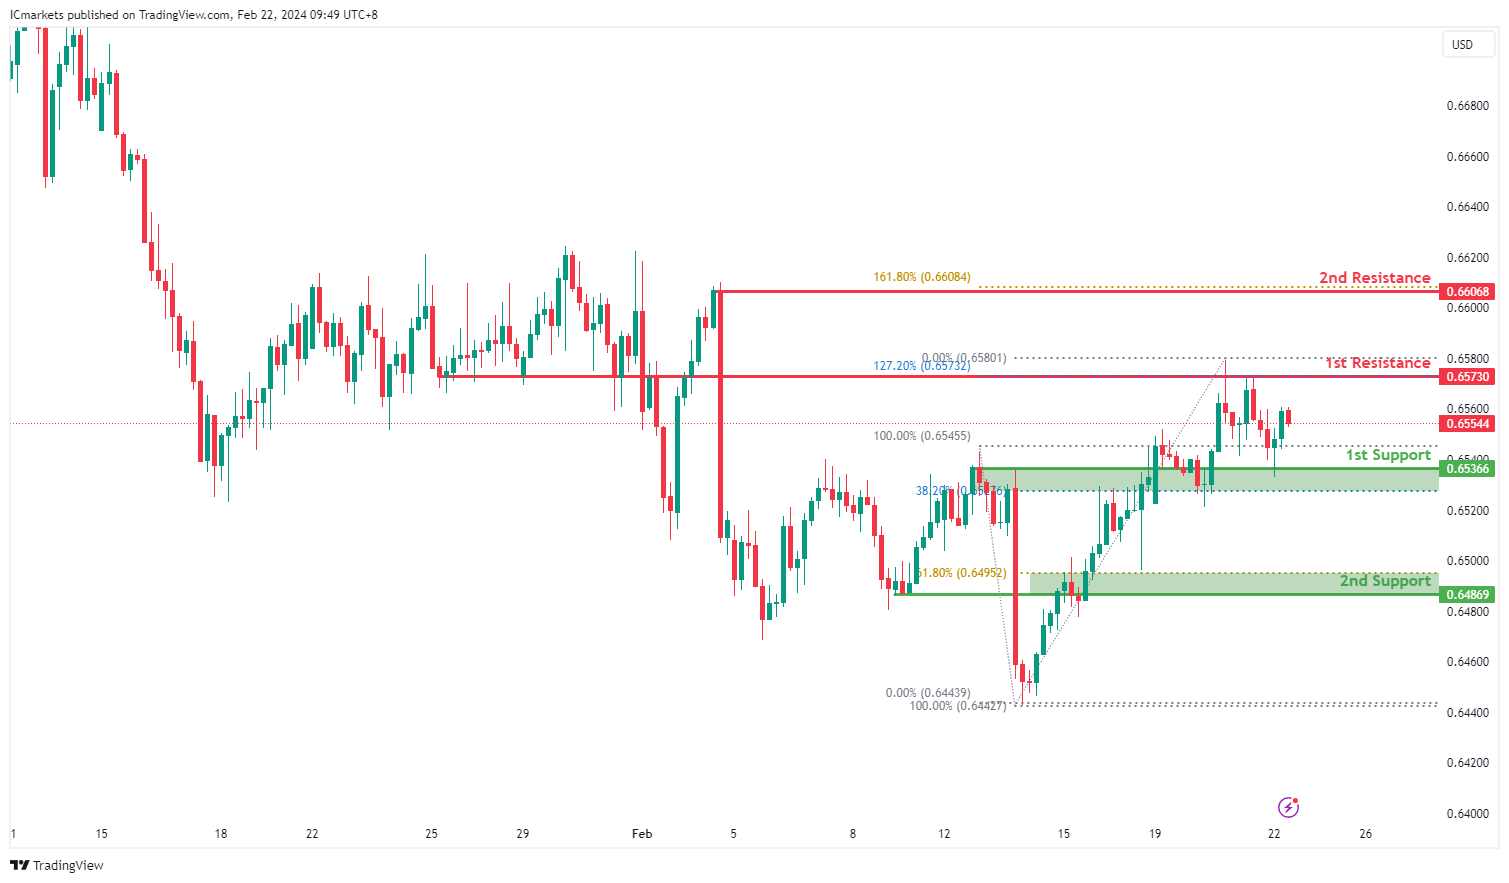
The AUD/USD chart currently indicates a bearish momentum, suggesting a potential continuation of the downtrend towards the 1st support level.
The 1st support at 0.6536 is identified as an overlap support, implying its historical significance as a level where buying interest has emerged in the past, potentially providing a floor for price action.
Additionally, the 2nd support at 0.6486 is characterized as an overlap support and aligns with the 61.80% Fibonacci Retracement level, further reinforcing its importance as a potential area of price support.
On the resistance side, the 1st resistance level at 0.6573 is recognized as an overlap resistance, indicating its historical significance as a barrier to upward movement, potentially attracting selling pressure.
Furthermore, the 2nd resistance at 0.6606 is noted as a swing high resistance and corresponds to the 161.80% Fibonacci Extension level, suggesting its importance as a potential area where selling interest may intensify.
NZD/USD
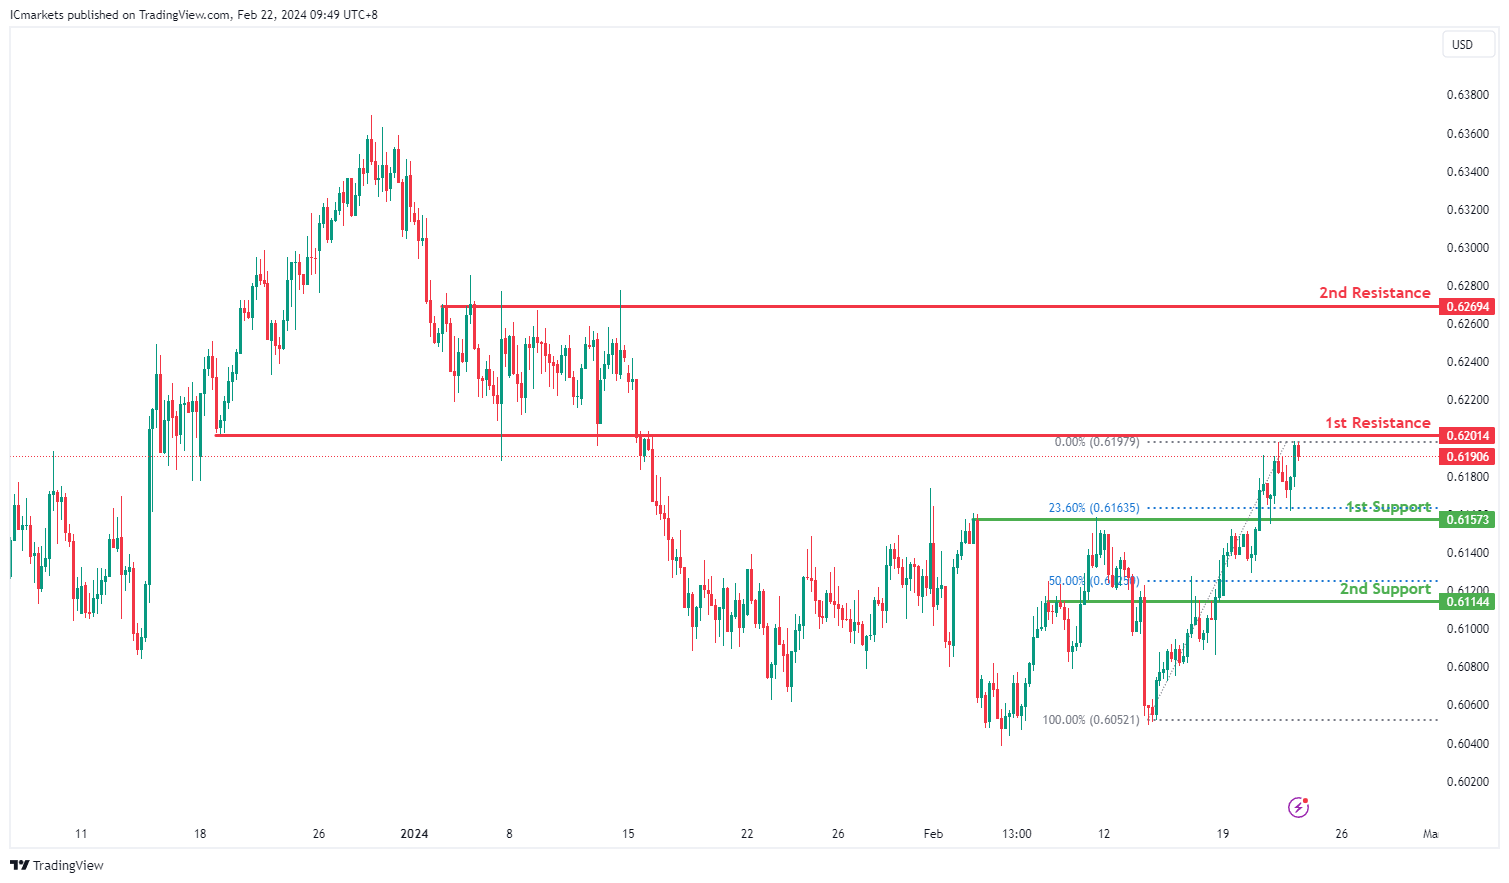
The NZD/USD chart currently exhibits a bearish momentum, indicating a potential bearish reaction off the 1st resistance level followed by a drop towards the 1st support.
The 1st support at 0.6157 is identified as an overlap support, suggesting its historical significance as a level where buying interest has emerged in the past. Additionally, this support aligns with the 23.60% Fibonacci Retracement level, adding further confluence to its importance.
Furthermore, the 2nd support at 0.6114 is characterized as an overlap support and coincides with the 50% Fibonacci Retracement level, strengthening its role as a potential area of price support.
On the resistance side, the 1st resistance level at 0.6201 is recognized as an overlap resistance, indicating its historical significance as a barrier to upward movement. This level may attract selling pressure as traders seek to capitalize on potential reversals.
Additionally, the 2nd resistance at 0.6269 is noted as a multi-swing high resistance, further reinforcing its importance as a level where selling interest may intensify.
DJ30:
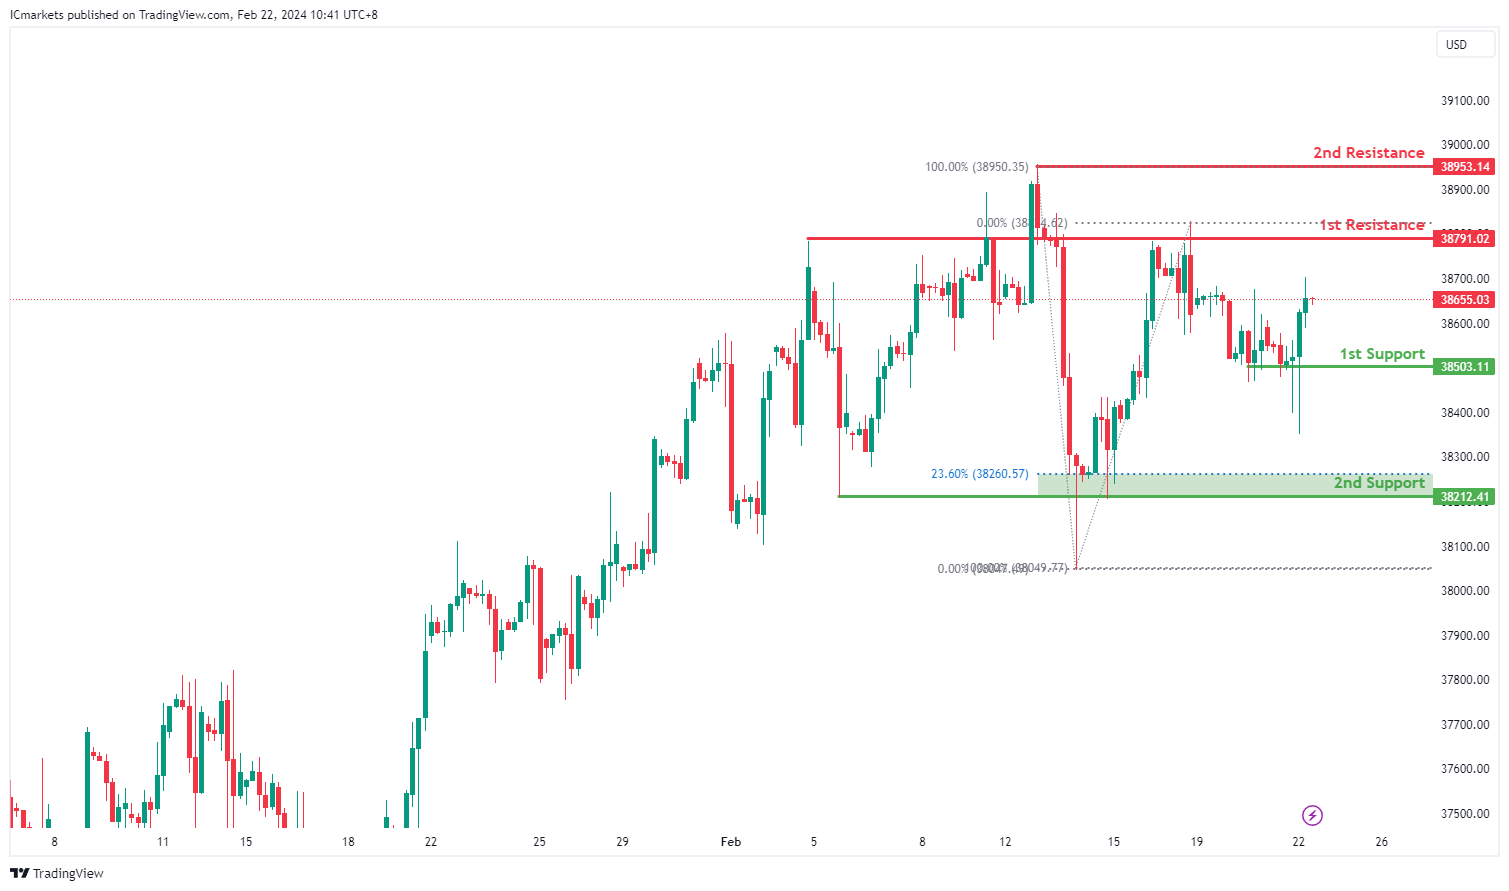
The DJ30 chart currently indicates bullish momentum, suggesting a potential continuation of the upward trend. There are several factors supporting the possibility of a bullish movement towards the 1st resistance level.
The 1st support at 38503.11 is a multi-swing low support, indicating a significant historical level where buying interest has previously emerged. Furthermore, the 2nd support at 38212.41 aligns with a multi-swing low support and the 23.60% Fibonacci Retracement level, providing additional reinforcement to its significance as a potential area of support.
On the resistance side, the 1st resistance level at 38791.02 is identified as an overlap resistance, suggesting a historical barrier where selling pressure may increase. Additionally, the 2nd resistance level at 38953.14 corresponds to a swing high resistance, further adding to its significance as a potential barrier to further bullish movement.
GER40:
The GER40 chart currently exhibits bullish momentum, indicating a potential continuation of the upward trend. Several factors contribute to this momentum, supporting the possibility of a bullish movement towards the 1st resistance level.
The 1st support at 17061.18 aligns with an overlap support, suggesting a significant historical level where buying interest has emerged. Additionally, the 2nd support at 16930.84 corresponds to a swing low support, further reinforcing its importance as a potential area of support.
On the resistance side, the 1st resistance level at 17219.01 is identified as a swing high resistance and coincides with the 127.20% Fibonacci Extension, suggesting a potential barrier where selling pressure may increase. Furthermore, the 2nd resistance level at 17309.34 aligns with a swing high resistance and the 161.80% Fibonacci Extension, adding to its significance as a potential barrier to further bullish movement.

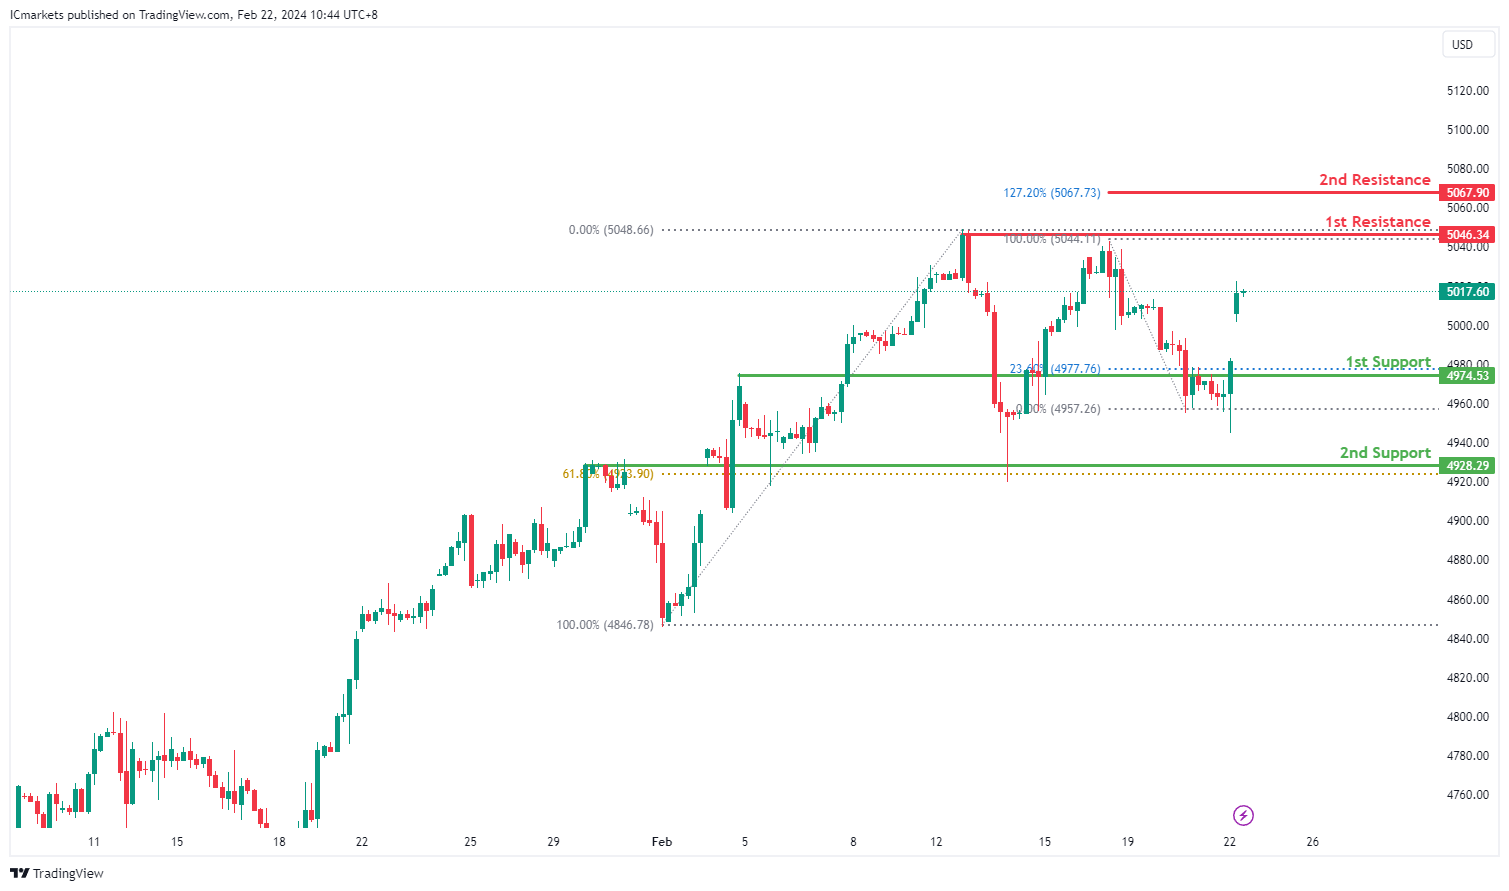
US500:
The US500 chart currently shows bullish momentum, suggesting a potential continuation of the upward trend. Several factors indicate the possibility of a bullish movement towards the 1st resistance level.
The 1st support at 4974.53 aligns with an overlap support and the 23.60% Fibonacci Retracement level, indicating a significant historical level where buying interest has emerged. Additionally, the 2nd support at 4928.29 corresponds to another overlap support and the 61.80% Fibonacci Retracement level, further reinforcing its importance as a potential area of support.
On the resistance side, the 1st resistance level at 5046.34 is identified as a swing high resistance, suggesting a potential barrier where selling pressure may increase. Furthermore, the 2nd resistance level at 5067.90 aligns with the 127.20% Fibonacci Extension, adding to its significance as a potential barrier to further bullish movement.
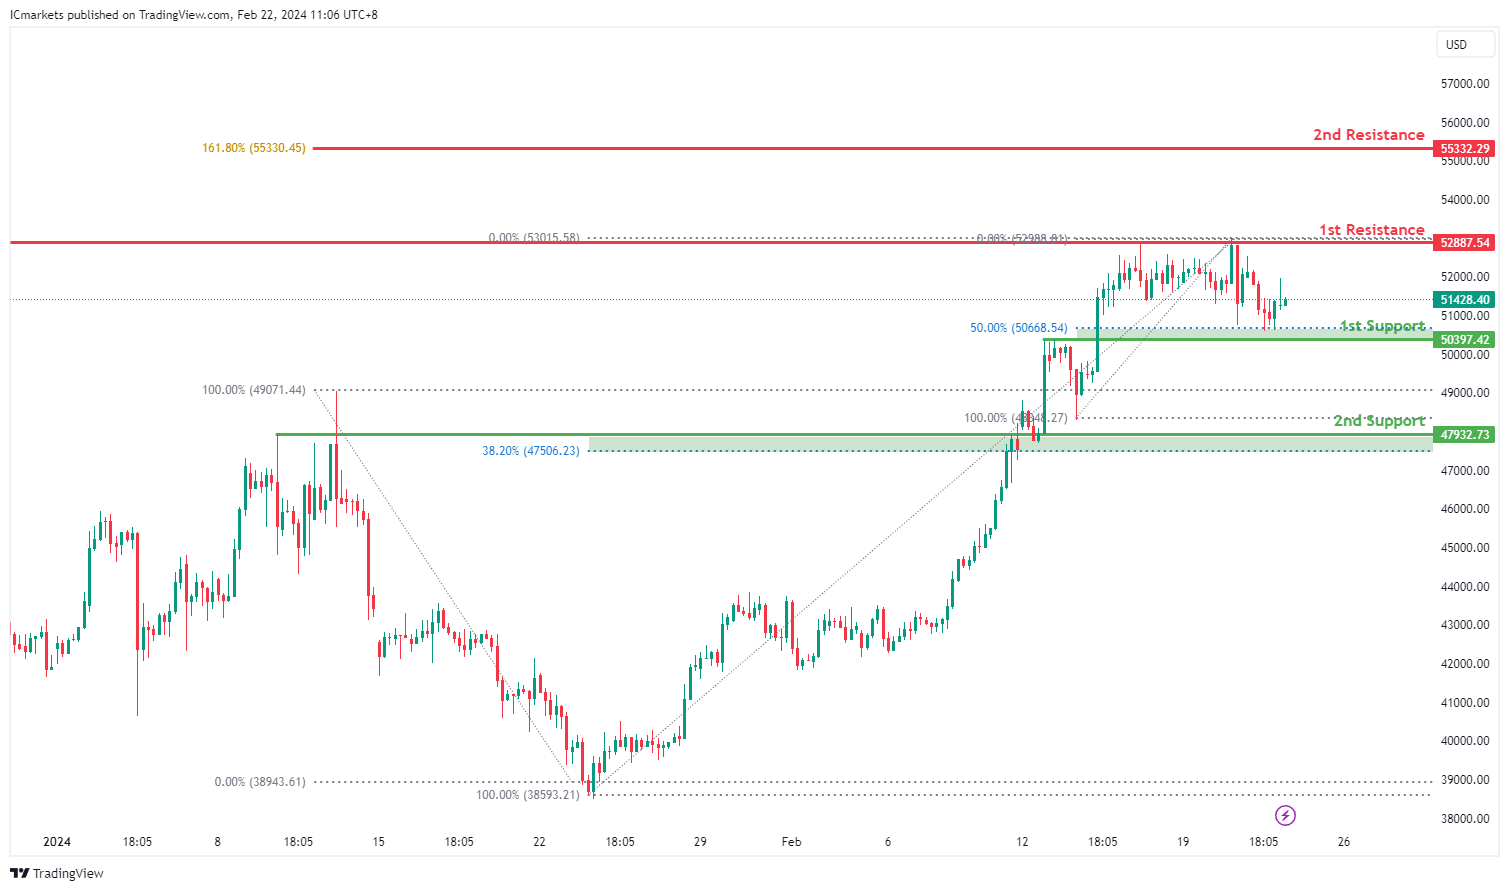
BTC/USD:
The BTC/USD chart currently demonstrates bullish momentum, suggesting a potential continuation of the upward trend. Several factors indicate the possibility of a bullish movement towards the 1st resistance level.
The 1st support at 50397.42 aligns with a pullback support and the 50% Fibonacci Retracement level, indicating a significant historical level where buying interest has emerged. Furthermore, the 2nd support at 47932.73 corresponds to an overlap support and the 38.20% Fibonacci Retracement level, further reinforcing its importance as a potential area of support.
On the resistance side, the 1st resistance level at 52887.54 is identified as a multi-swing high resistance, suggesting a potential barrier where selling pressure may increase. Additionally, the 2nd resistance level at 55332.29 aligns with the 161.80% Fibonacci Extension, adding to its significance as a potential barrier to further bullish movement.
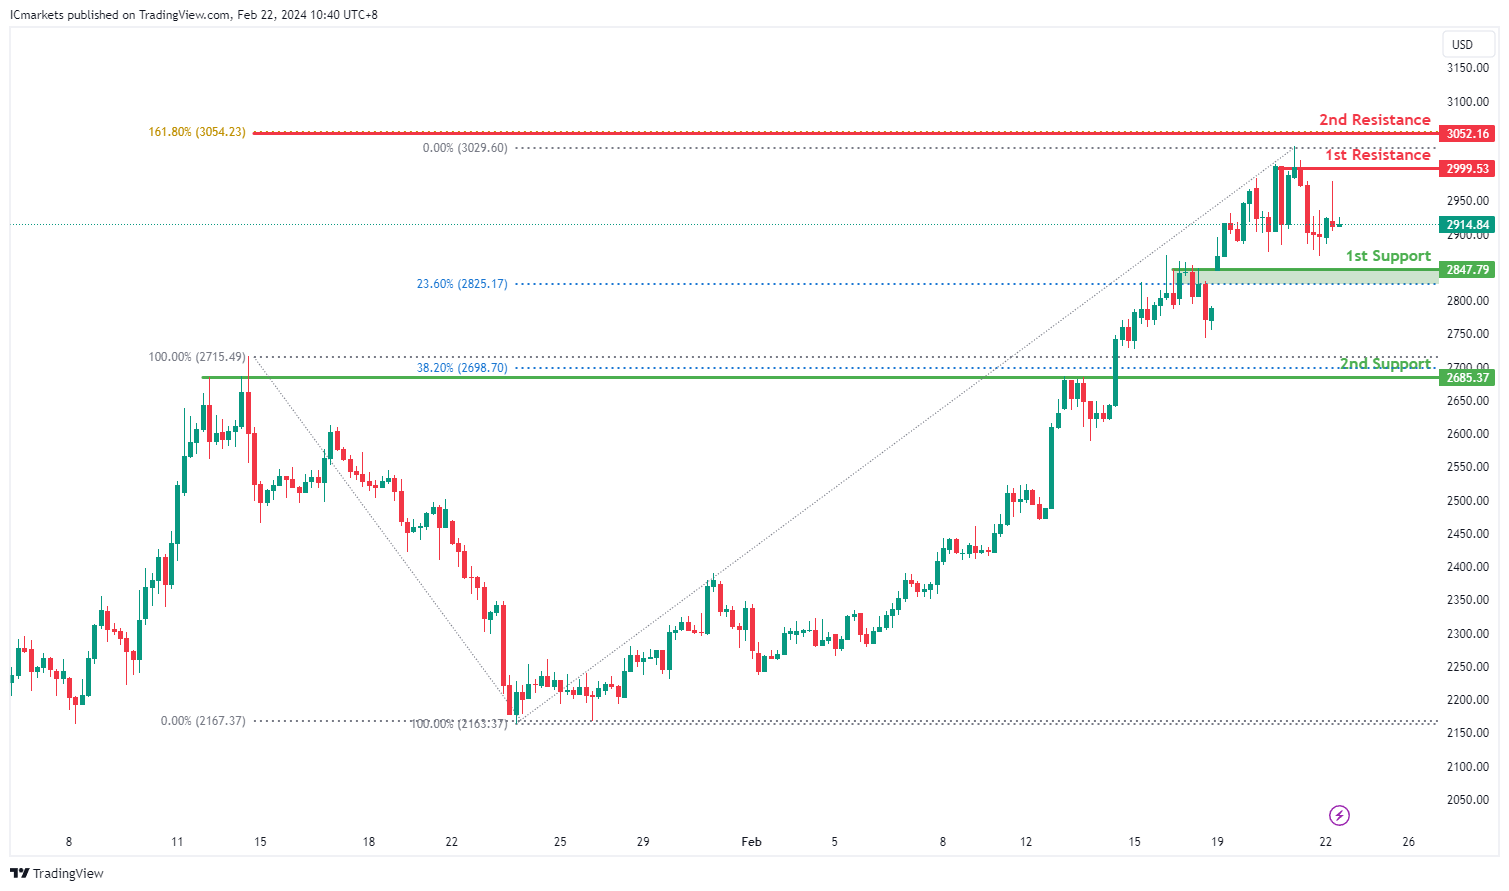
ETH/USD:
The ETH/USD chart currently indicates bullish momentum, suggesting a potential continuation of the upward trend. There are indications that the price might experience a short-term drop to the 1st support level before rebounding and ascending towards the 1st resistance level.
The 1st support at 2847.79 is supported by an overlap support and coincides with the 23.60% Fibonacci Retracement level, marking a significant historical level where buying interest has previously emerged. Additionally, the 2nd support at 2685.37 aligns with a pullback support and the 38.20% Fibonacci Retracement level, further reinforcing its potential as a support zone.
On the resistance side, the 1st resistance level at 2999.53 is identified as a multi-swing high resistance, suggesting a level where selling pressure may intensify. Moreover, the 2nd resistance level at 3052.16 corresponds to the 161.80% Fibonacci Extension, indicating a potential barrier to further bullish movement.
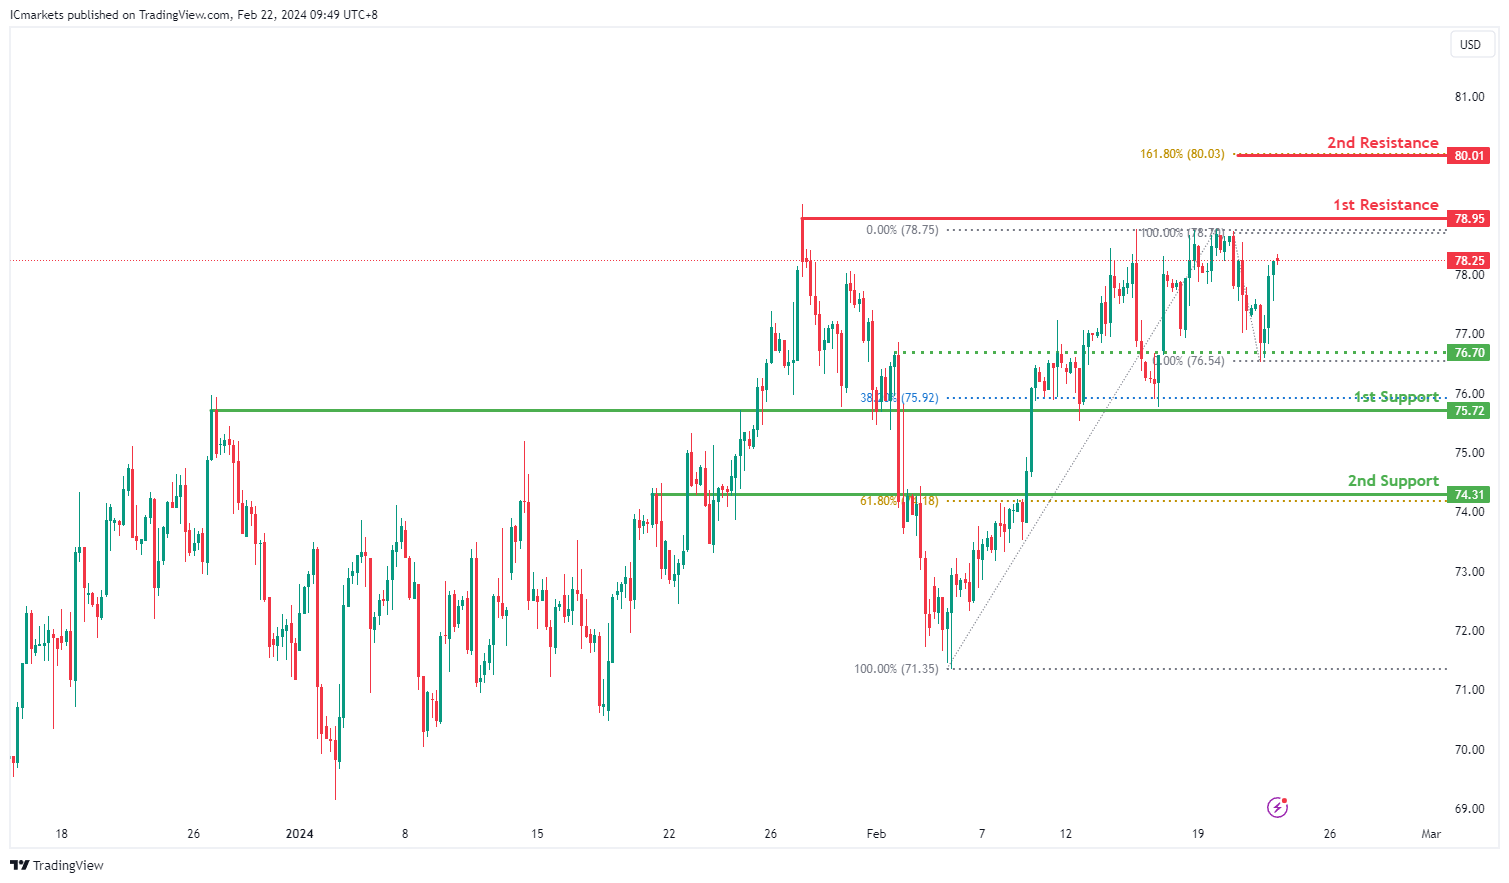
WTI/USD:
The WTI (West Texas Intermediate) chart currently reflects a bearish momentum, suggesting a potential bearish reaction off the 1st resistance level followed by a drop towards the 1st support.
The 1st support at 75.72 is identified as an overlap support and coincides with the 38.20% Fibonacci Retracement level, indicating its significance as a historical level where buying interest has previously emerged.
Furthermore, the 2nd support at 74.31 is characterized as a pullback support and aligns with the 61.80% Fibonacci Retracement level, further reinforcing its potential importance as a level where buyers may enter the market.
On the resistance side, the 1st resistance level at 78.95 is recognized as a swing high resistance, suggesting its historical significance as a barrier to upward movement. This level may attract selling pressure as traders look to capitalize on potential reversals.
Additionally, the 2nd resistance at 80.01 is noted as a significant level, as it corresponds to the 161.80% Fibonacci Extension, indicating potential strong resistance to further price appreciation.
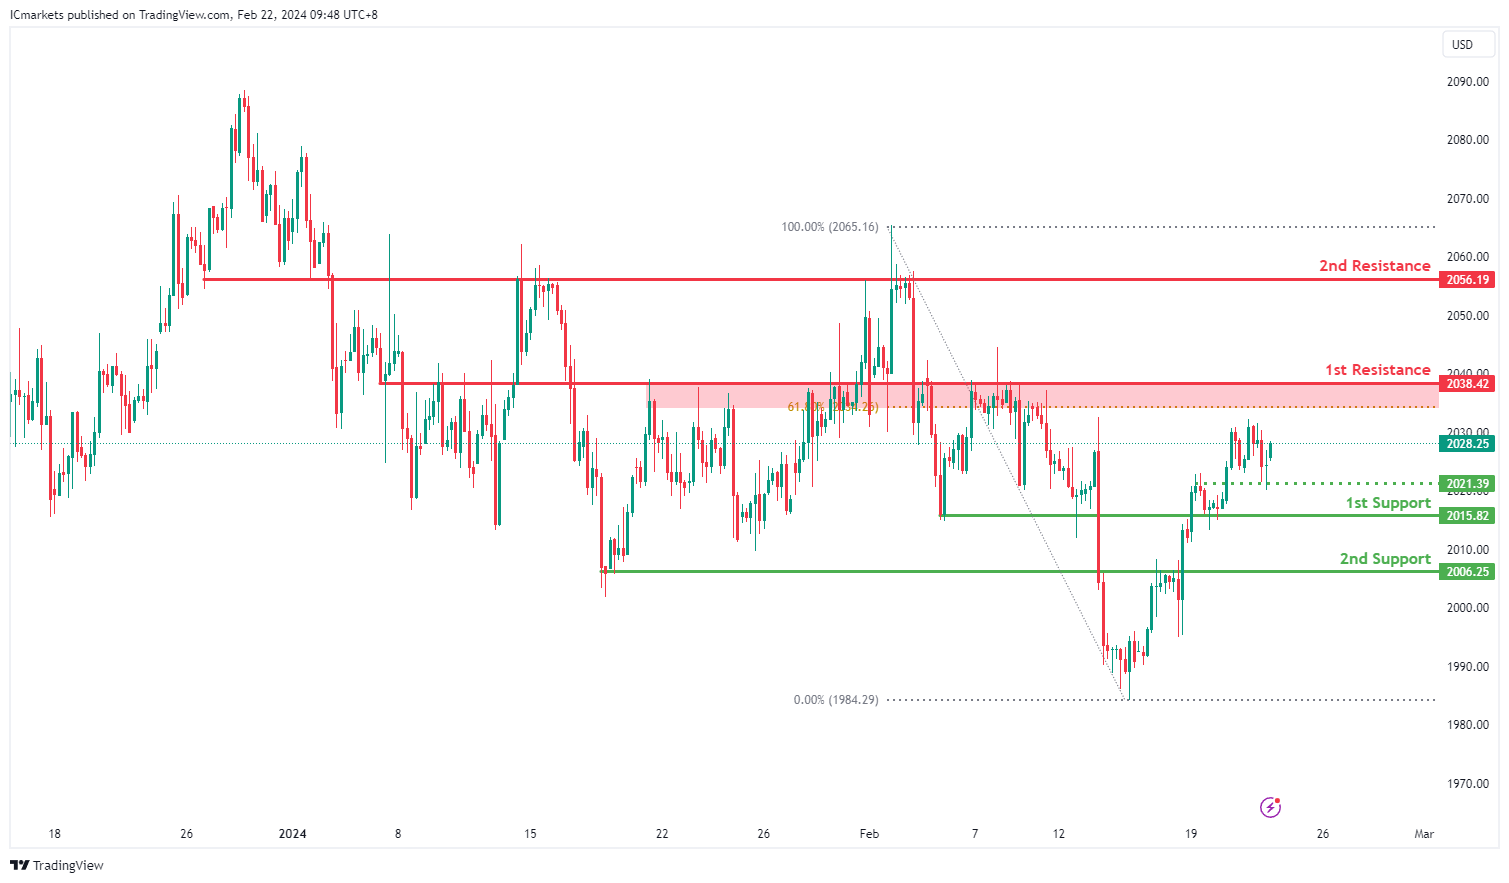
XAU/USD (GOLD):
The XAUUSD (Gold/US Dollar) chart currently indicates a bearish momentum, suggesting a potential bearish reaction off the 1st resistance level followed by a drop towards the 1st support.
The 1st support at 2015.82 is identified as an overlap support, indicating its historical significance as a level where buying interest has previously emerged. This level may attract buyers looking to enter the market or defend existing long positions.
Additionally, the 2nd support at 2006.25 is characterized as a pullback support, suggesting its importance as a level where buyers may intervene to support the price after a retracement. This level aligns with the overall bearish sentiment on the chart.
On the resistance side, the 1st resistance level at 2038.42 is recognized as an overlap resistance and coincides with the 61.80% Fibonacci Retracement level. This level may attract selling interest as traders look to capitalize on potential reversals or profit-taking opportunities.
Furthermore, the 2nd resistance at 2056.19 is identified as another overlap resistance, indicating its historical significance as a level where selling pressure has been observed. This level may act as a barrier to further upward movement.
An intermediate support level at 2021.39 is also identified, aligning with an overlap support. This level could provide additional support to the price if tested, potentially influencing price action in the short term.


