
- Bearish Scenario: Shorts below 18100 with TP1: 17900, TP2: 17814, and 17630 with S.L. above 18130 or at least 1% of account capital*.
- Anticipated Bullish Scenario: Intraday longs above 18130 with TP: 18219, TP2: 18270, and TP3: 18428, with S.L. below 18050 or at least 1% of account capital*. Apply trailing stop.
Bullish Scenario after Retracement: (After breaking support at 17813.95) Intraday longs above 17630 with TP: 17813, TP2: 17900, and TP3: 18000, with S.L. below 17600 or at least 1% of account capital*. Apply trailing stop.
H4 Scenarios:
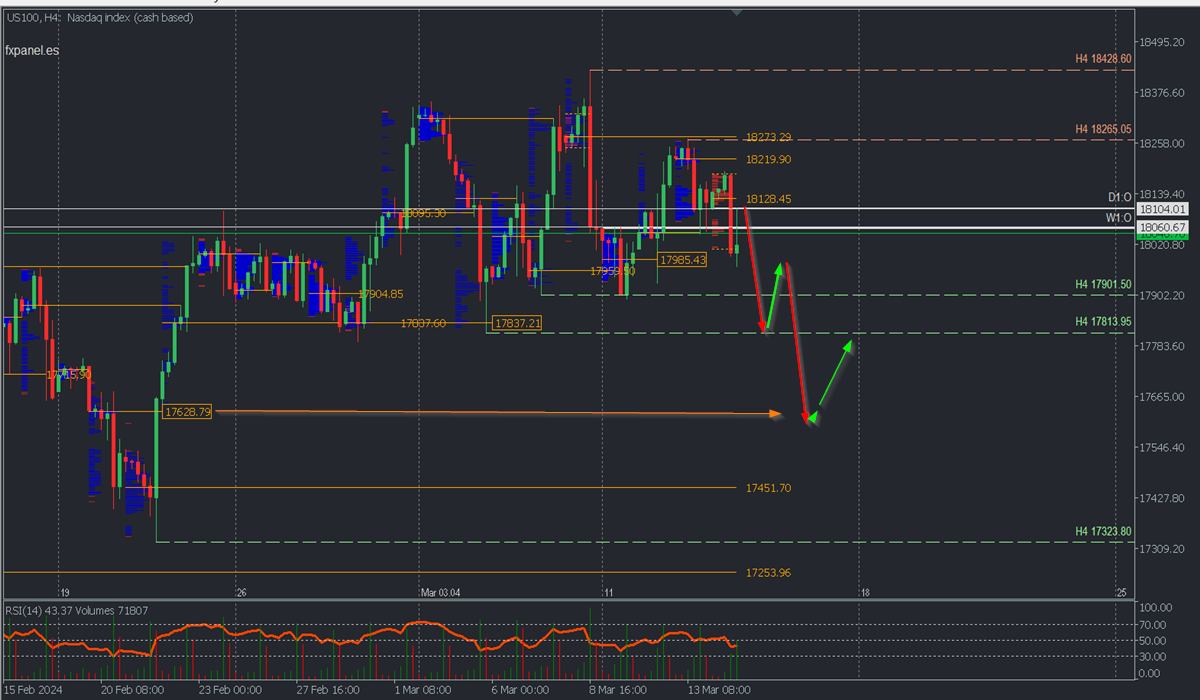
After last week’s historic high reached 18428.60, a sales POC formed around 18273.29, an area that was the target of the recent rally and efficiently defended by the bears.
The decline has left three uncovered POCs at 18273.29, 18219.90, and today’s Thursday at 18128.45, forming a block of sales, which for now will keep prices under pressure to seek supports at 17901.50 and 17813.95, especially after decisively breaking the buying zone around 17985.43.
The breaking of the indicated supports will initiate a more extended corrective phase, with the next target being the buying zone around 17629, whose breaking on a second touch will extend the decline towards 17452. Note that US100 prices tend not to reach zones exactly but to approach within a few pips.
The bullish continuation can be renewed from the buying zones observed in the H4 chart and after the decisive breaking of the sales above zones, which will allow the price to challenge the resistances at 18265 and 18428, in an attempt to create new all-time highs.
For now, the price challenges the buying zone between 17984 and 17960, whose bullish reaction was limited to the day (D1:O) and week (W1:O) openings, indicating that as long as prices remain below the openings, it is more likely to extend sales to seek liquidity further down in the following buying zones marked on the chart with orange lines and levels.
*Uncovered POC: POC = Point of Control: It is the level or zone where the highest volume concentration occurred. If there was a bearish movement from it previously, it is considered a sales zone and forms a resistance zone. On the contrary, if there was previously a bullish impulse, it is considered a buying zone, usually located at lows, forming support zones
**Consider this risk management suggestion
**It is essential that risk management is based on capital and traded volume. For this, a maximum risk of 1% of capital is recommended. It is suggested to use risk management indicators such as Easy Order.


