
- Bearish scenario: Shorts below 80.00 with TP1: 79.60, TP2: 79.30, and 78.83 with S.L. above 80.62 or at least 1% of account capital*.
- Anticipated bullish scenario: Intraday longs above 80.70 with TP: 81.50, TP2: 81.85, and TP3: 83.00, with S.L. below 80.00 or at least 1% of account capital*. Apply trailing stop.
- Bullish scenario after retracement: (After breaking bellow 80.00) Intraday longs above 78.40 with TP: 81.00, TP2: 81.50, and TP3: 82.00, with S.L. below 77.30 or at least 1% of account capital*. Apply trailing stop.
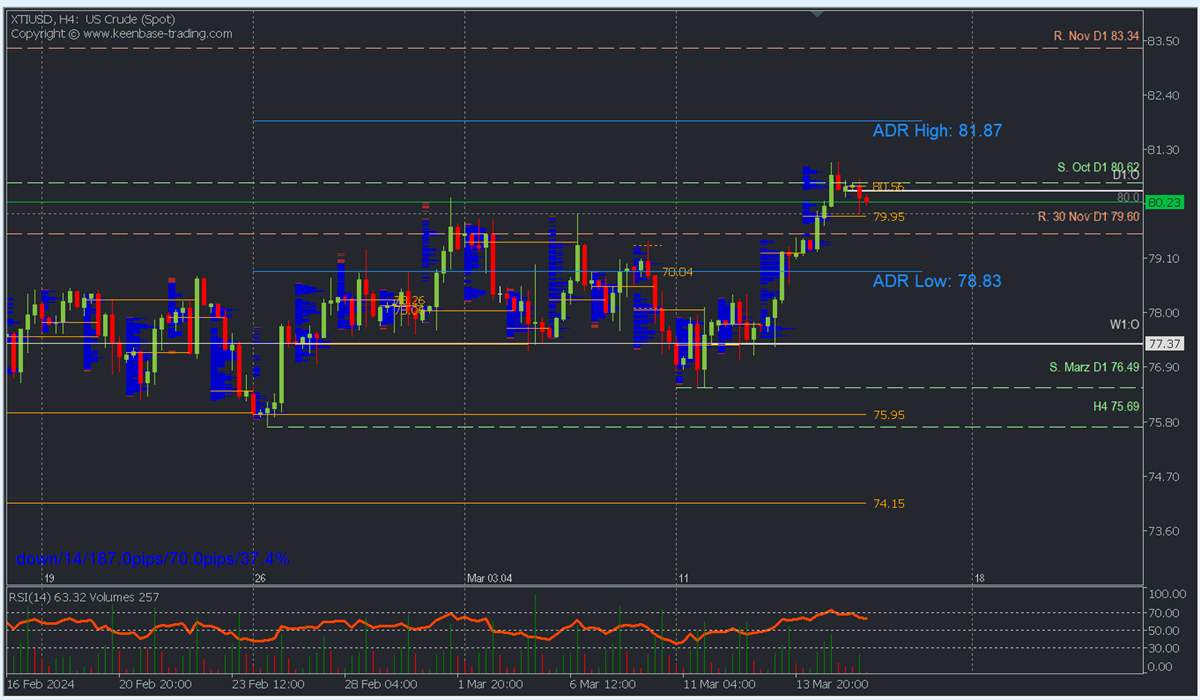
Scenario from H4 chart:
The uptrend since January broke the last relevant macro resistance (daily chart) of the October to December downtrend at 79.60, hence a retracement of at least 1/3 to 50% of the recent bullish expansion is required before a new rally confirms a macro trend change to bullish.
Under the current scenario, a retracement towards buying zones between 80.00 and the broken level at 79.60 is expected, with a possible downward extension towards 78.83, after which renew purchases aiming for the bullish average range 81.87 intraday and subsequently November resistance at 83.34, confirming the trend change.
A more extended correction towards the weekly open at 77.37 will again place the price in a buying zone to initiate the trend change rally. However, this zone acts as support, so the price must stay above it to consider the possibility of a new rise.
A decisive breakout (with a candle body) of the support at the weekly open of 77.37 will indicate renewed bearishness in the upcoming week, targeting 76.49 and 75.69.
*Uncovered POC: POC = Point of Control: It is the level or zone where the highest volume concentration occurred. If there was a bearish movement from it previously, it is considered a selling zone and forms a resistance zone. Conversely, if there was a bullish impulse previously, it is considered a buying zone, usually located at lows, forming support zones.
**Consider this risk management suggestion
**It is essential that risk management is based on capital and traded volume. Therefore, a maximum risk of 1% of capital is recommended. It is suggested to use risk management indicators such as Easy Order.


