
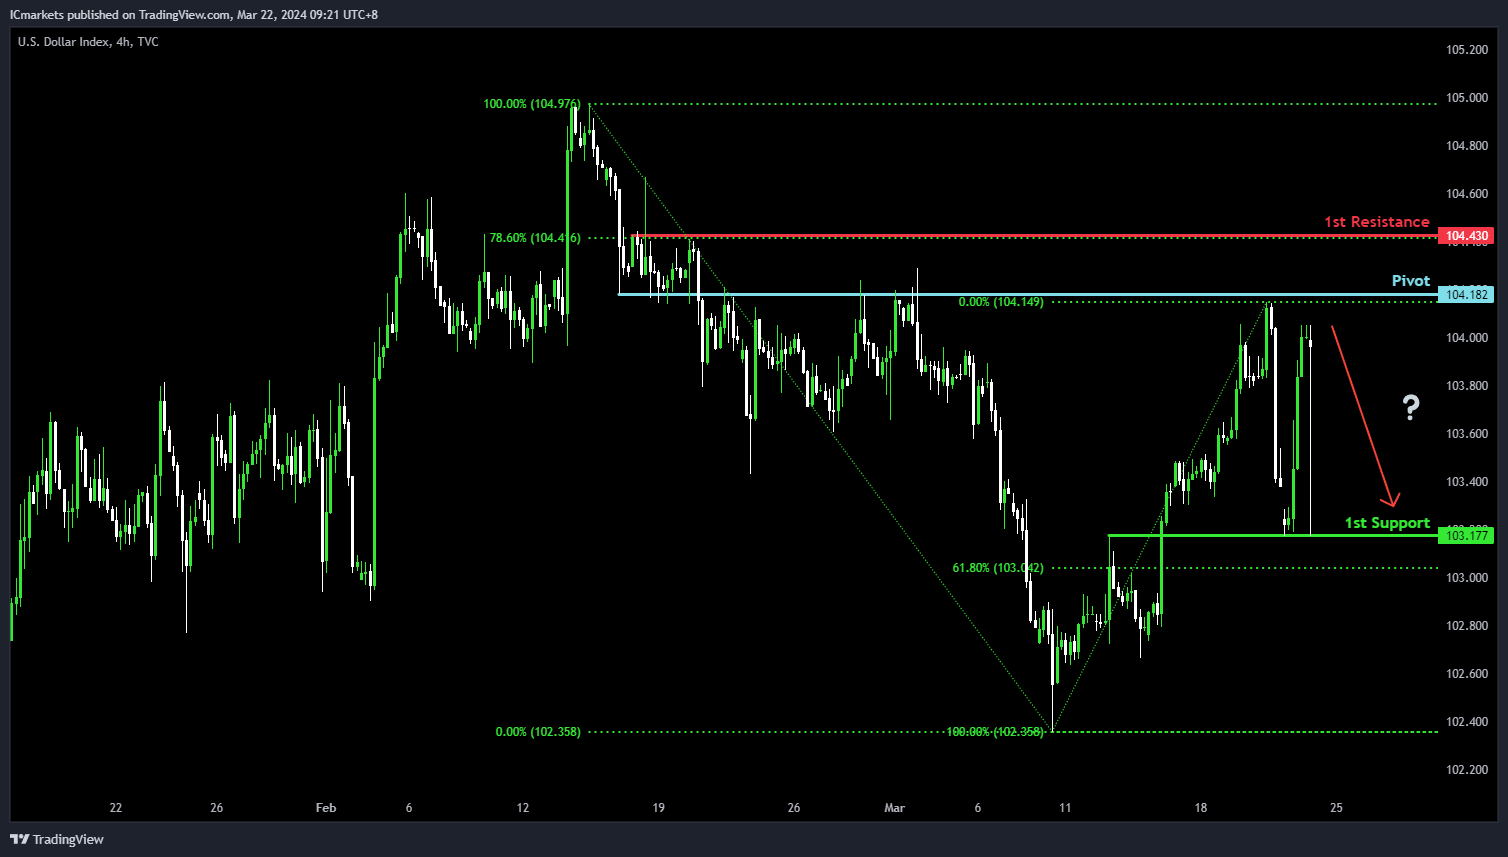
DXY:
The dollar index (DXY) chart currently demonstrates an overall bullish momentum. In this context, there is a potential scenario for price to rise towards the pivot before potentially making a bearish reaction and pull back towards the 1st support.
The pivot level at 104.18 is identified as an overlap resistance where price could potentially pull back from to drop lower. The 1st support level at 103.17 is marked as an overlap support that aligns close to the 61.80% Fibonacci Retracement level, reinforcing its significance as a key support level.
On the resistance side, the 1st resistance level at 104.43 is noted as a pullback resistance that aligns with the 78.60% Fibonacci Retracement level, potentially limiting any further upward movement.
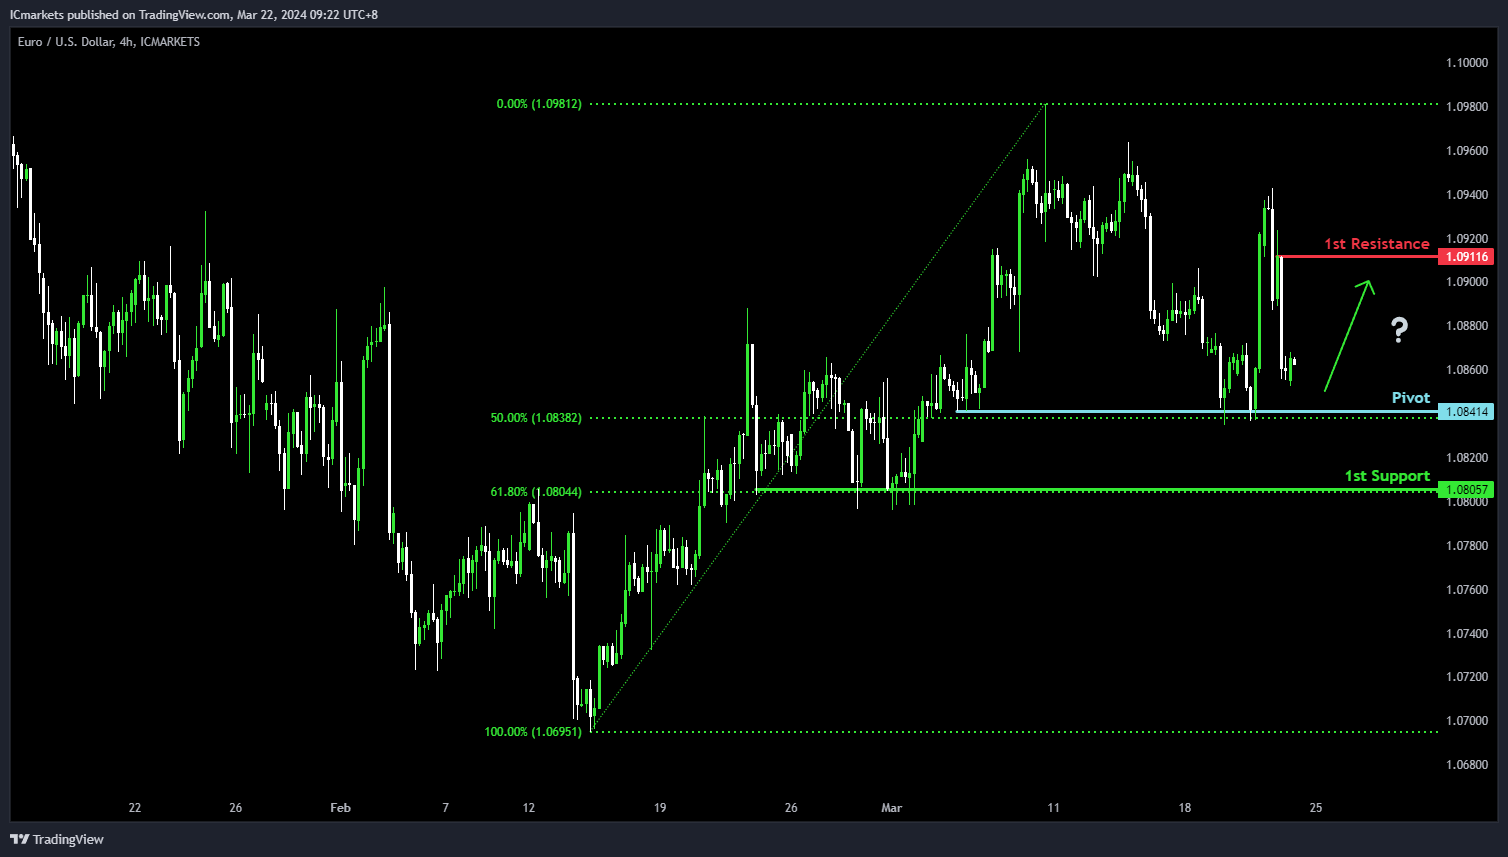
EUR/USD:
The EUR/USD chart currently demonstrates an overall bearish momentum. In this context, there is a potential scenario for price to continue falling towards the pivot before potentially making a weak bullish reaction.
The pivot level at 1.0841 is identified as a pullback support that aligns with the 50.00% Fibonacci Retracement level where price could potentially bounce from to move higher. The 1st resistance level at 1.0911 is noted as a pullback resistance, potentially limiting any further upward movement.
On the support side, the 1st support level at 1.0805 is marked as a pullback support that aligns with the 61.80% Fibonacci Retracement level, reinforcing its significance as a key support level.
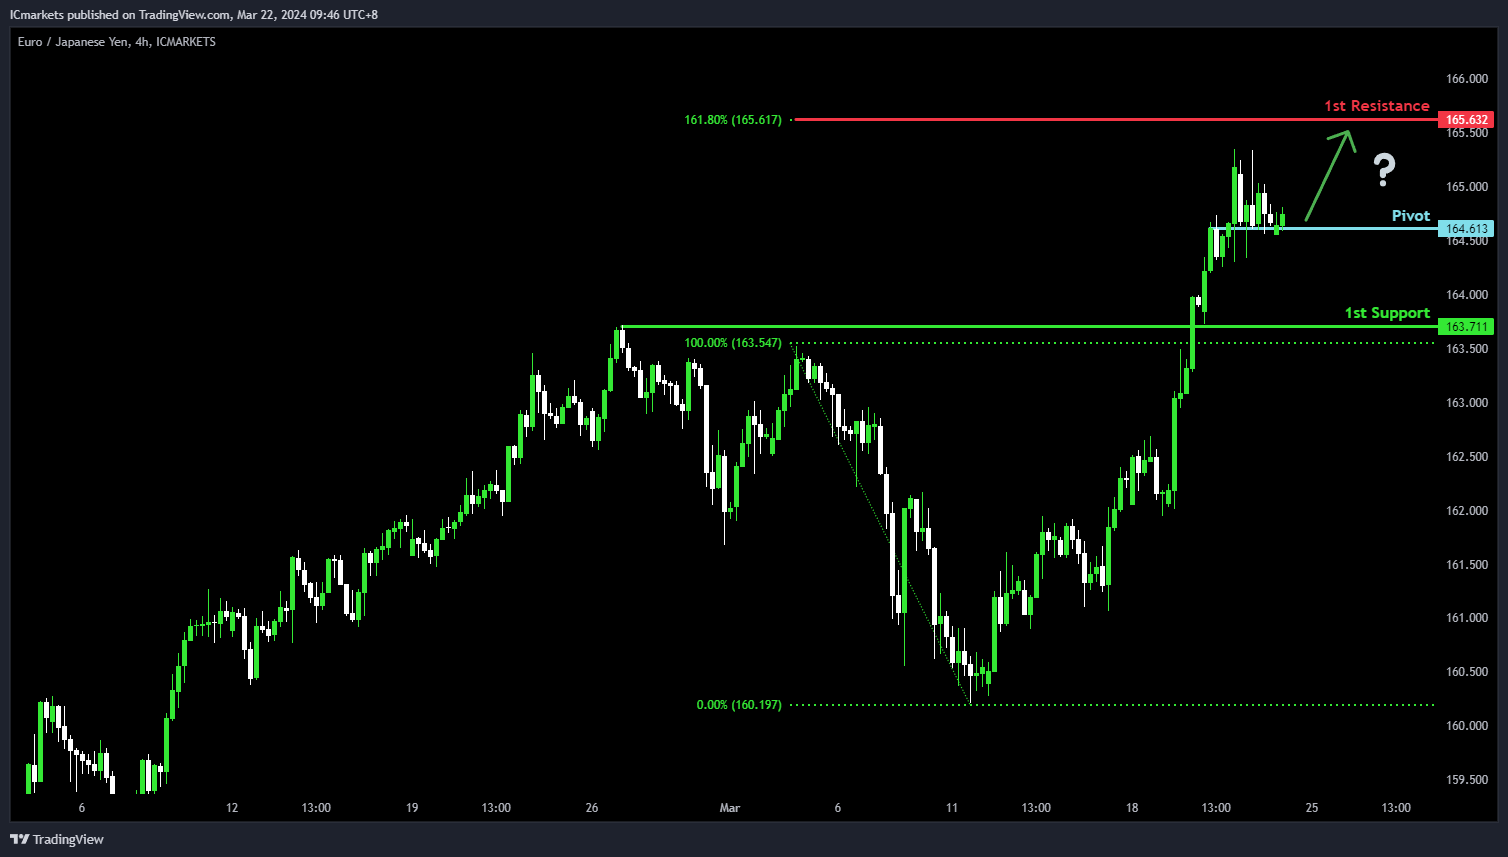
EUR/JPY:
The EUR/JPY chart currently demonstrates an overall bullish momentum. In this context, there is a potential scenario for price to potentially bounce off the pivot to rise towards the 1st resistance.
The pivot level at 164.61 is identified as an overlap support where price could potentially bounce from to rise higher. The 1st resistance level at 165.63 is noted as a resistance level that aligns with the 161.80% Fibonacci Extension level, potentially limiting any further upward movement.
On the support side, the 1st support level at 163.71 is marked as an overlap support, reinforcing its significance as a key support level.
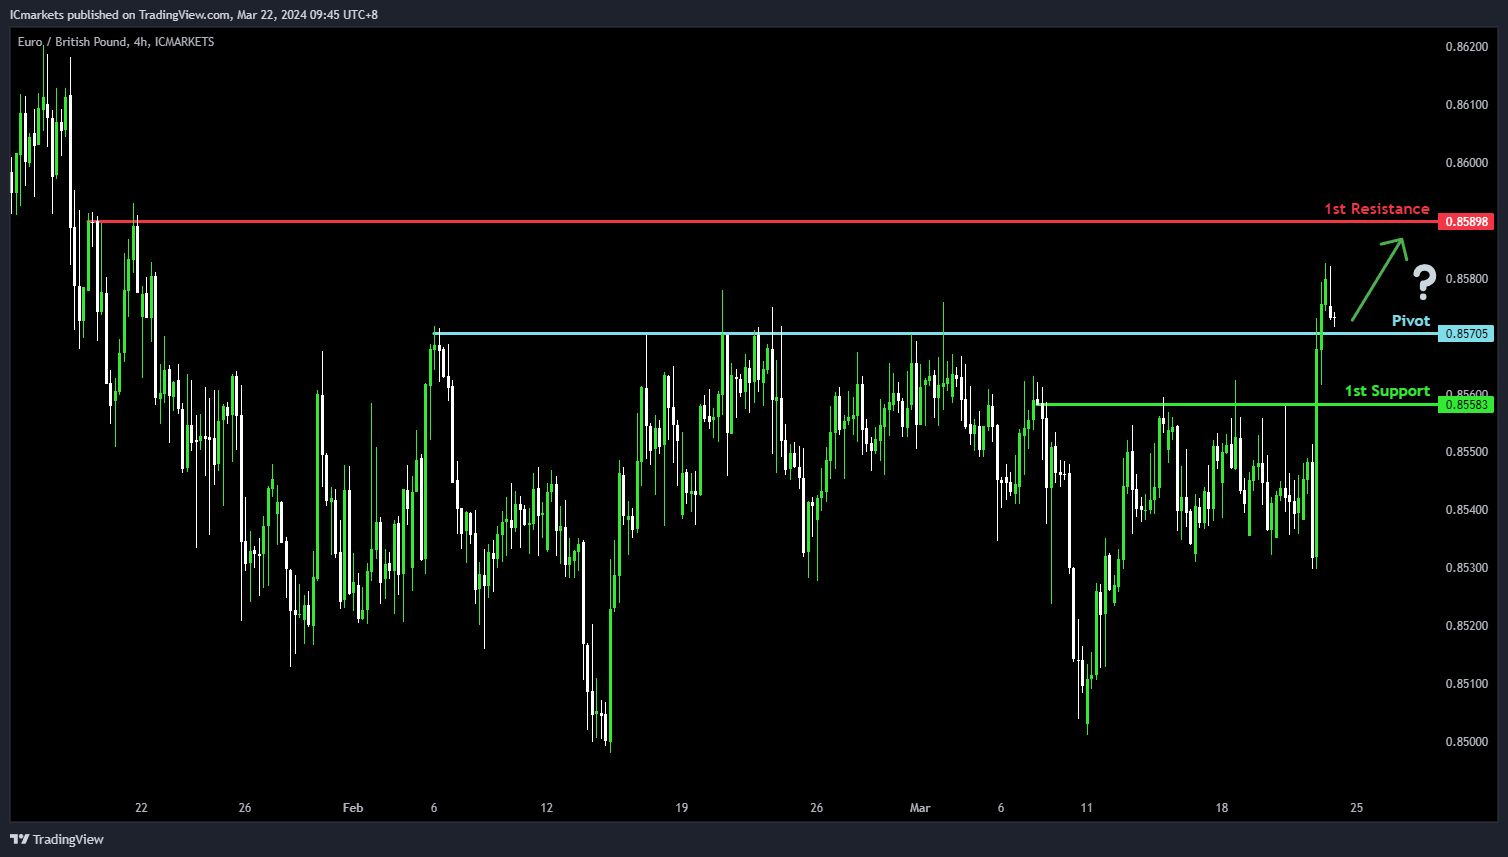
EUR/GBP:
The EUR/GBP chart currently demonstrates an overall bullish momentum. In this context, there is a potential scenario for price to potentially bounce off the pivot to rise towards the 1st resistance.
The pivot level at 0.8570 is identified as a pullback where price could potentially bounce from to rise higher. The 1st resistance level at 0.8589 is noted as a pullback resistance, potentially limiting any further upward movement.
On the support side, the 1st support level at 0.8558 is marked as a pullback support, reinforcing its significance as a key support level.
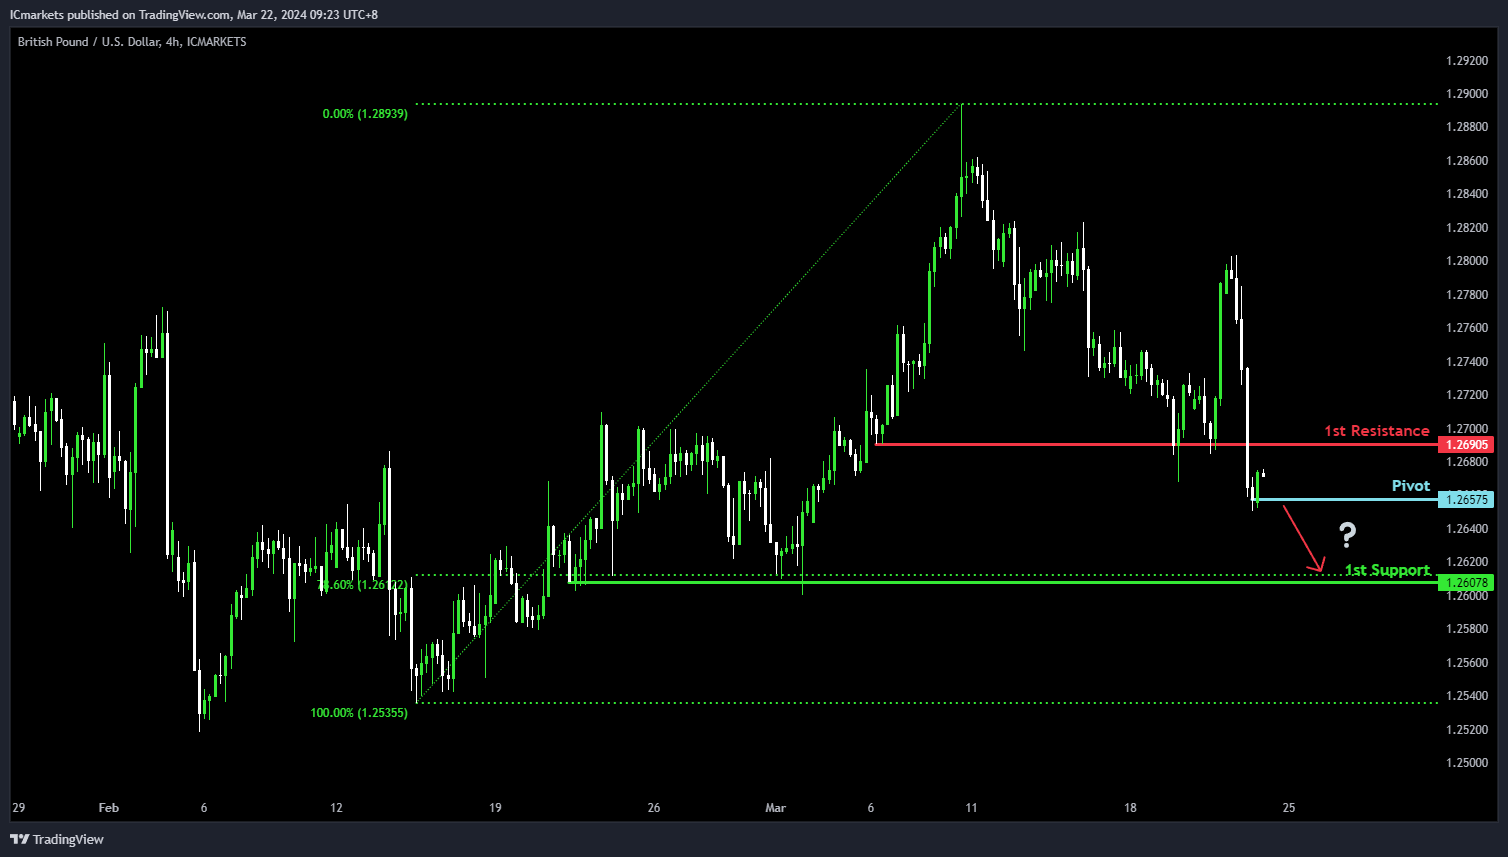
GBP/USD:
The GBP/USD chart currently demonstrates an overall bearish momentum. In this context, there is a potential scenario for price to break under the pivot and fall towards the 1st support.
The pivot level at 1.2657 is identified as a pullback support where price could potentially break under to continue the bearish momentum. The 1st support level at 1.2607 is marked as a pullback support that aligns with the 78.60% Fibonacci Retracement level, reinforcing its significance as a key support level.
On the resistance side, the 1st resistance level at 1.2690 is noted as a pullback resistance, potentially limiting any further upward movement.
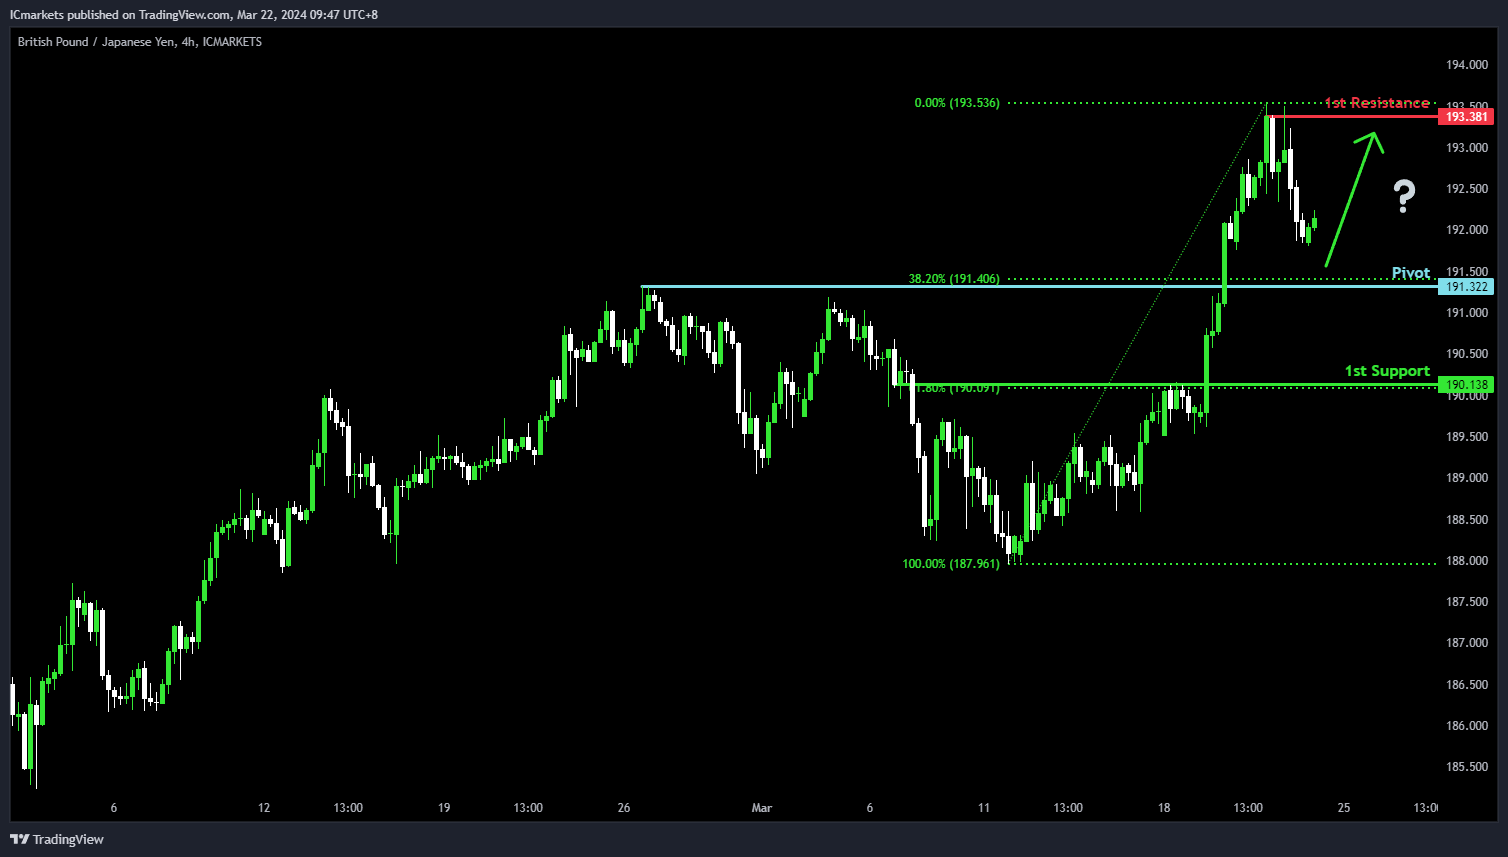
GBP/JPY:
The GBP/JPY chart currently demonstrates an overall bullish momentum. In this context, there is a potential scenario for price to potentially bounce off the pivot to rise towards the 1st resistance.
The pivot level at 191.32 is identified as a pullback support that aligns with the 38.20% Fibonacci Retracement level where price could potentially bounce from to rise higher. The 1st resistance level at 193.38 is noted as a pullback resistance, potentially limiting any further upward movement.
On the support side, the 1st support level at 190.13 is marked as an overlap support that aligns with the 61.80% Fibonacci Retracement level, reinforcing its significance as a key support level.
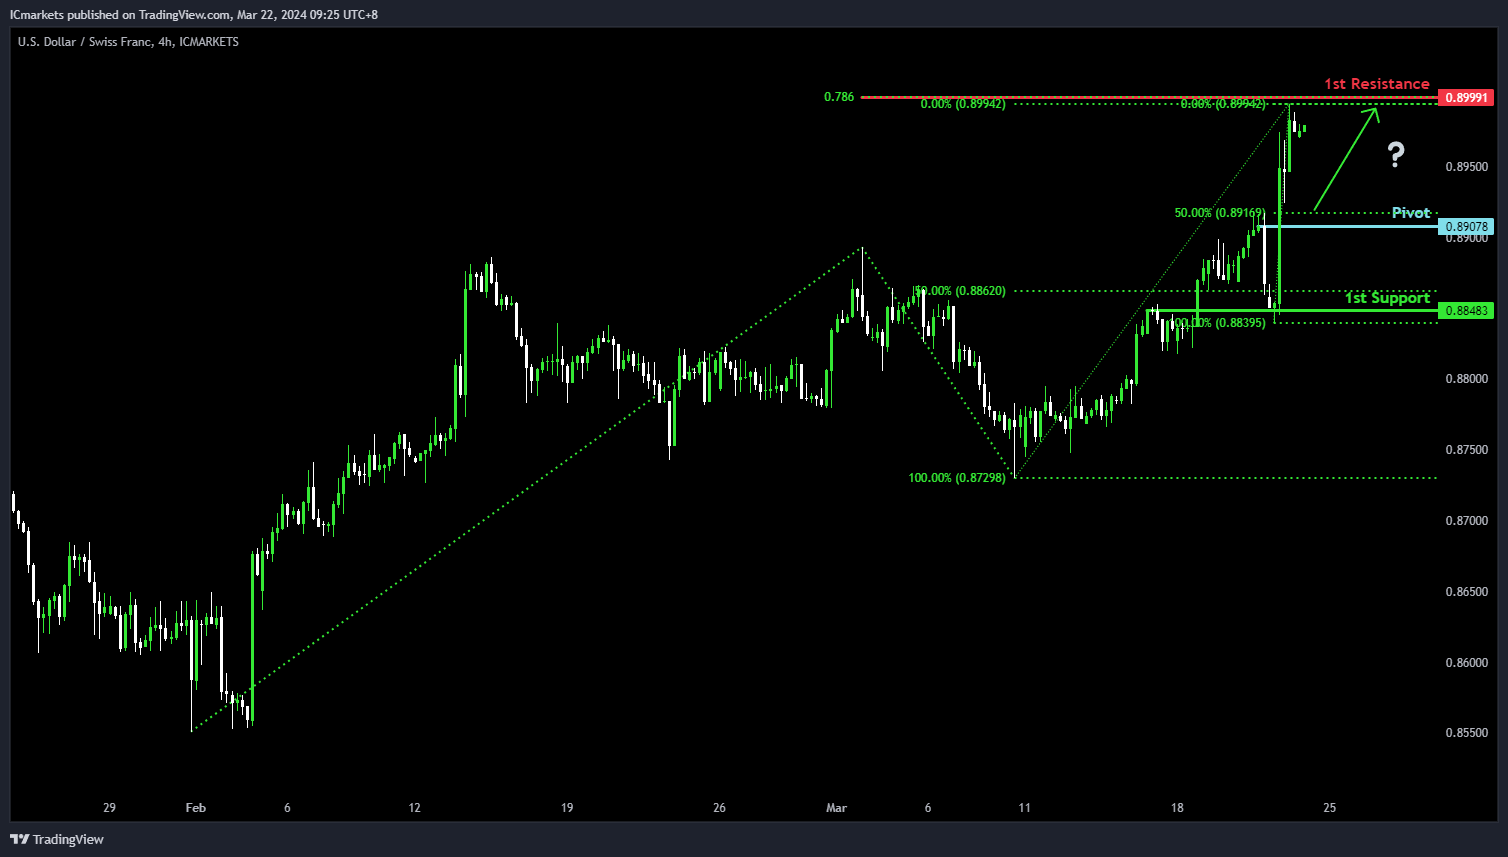
USD/CHF:
The USD/CHF chart currently demonstrates an overall bullish momentum. In this context, there is a potential scenario for price to potentially bounce off the pivot to rise towards the 1st resistance.
The pivot level at 0.8907 is identified as a pullback support that aligns close to the 50.00% Fibonacci Retracement level where price could potentially bounce from to rise higher. The 1st resistance level at 0.8999 is noted as a resistance level that aligns with the 78.60% Fibonacci Projection level, potentially limiting any further upward movement.
On the support side, the 1st support level at 0.8848 is marked as an overlap support that aligns close to the 50.00% Fibonacci Retracement level, reinforcing its significance as a key support level.
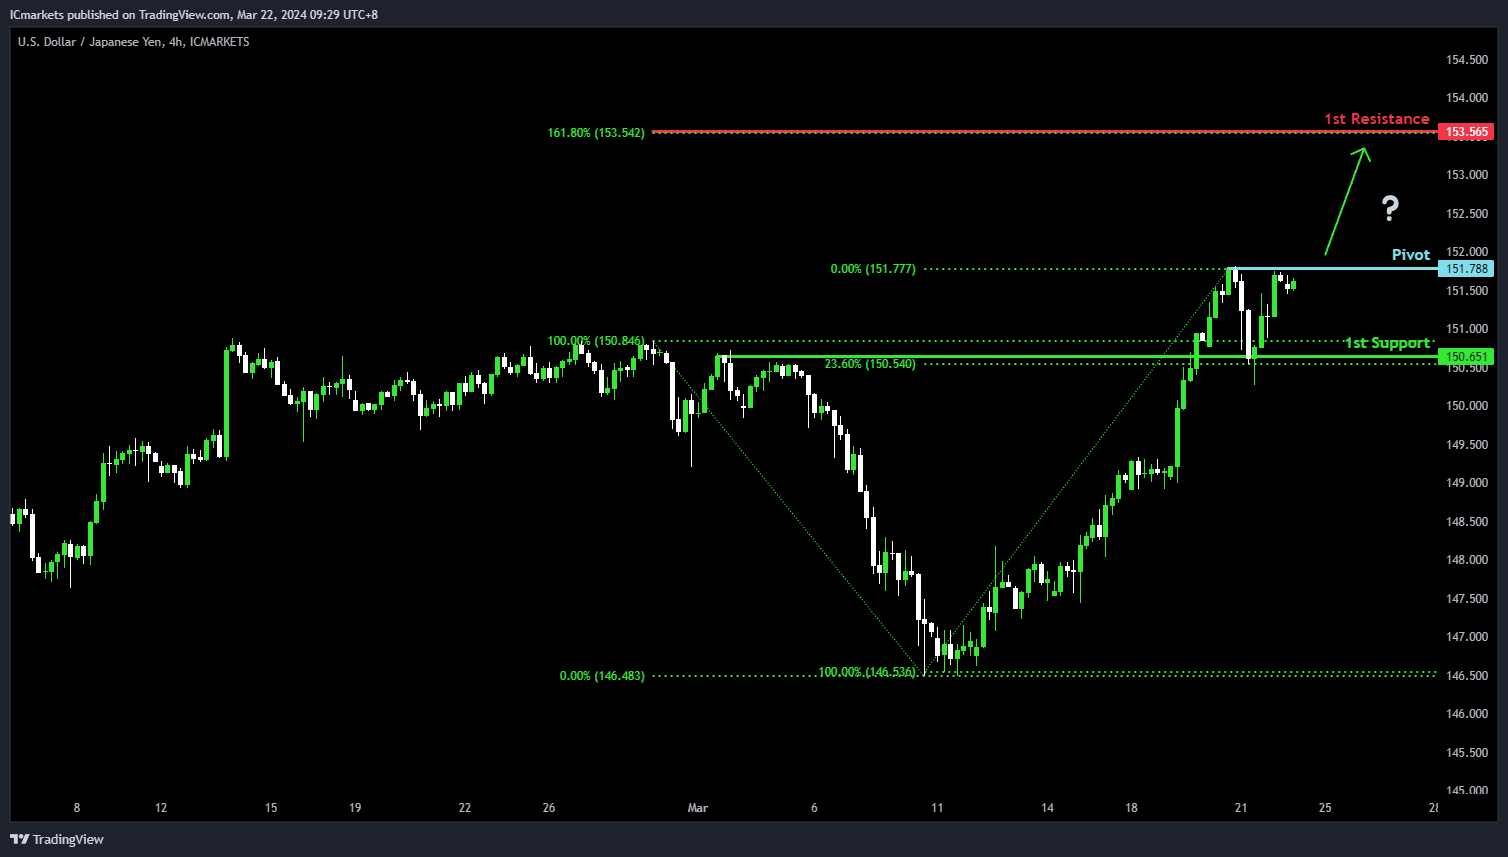
USD/JPY:
The USD/JPY chart currently demonstrates an overall bullish momentum. In this context, there is a potential scenario for price to potentially break above the pivot to rise towards the 1st resistance.
The pivot level at 151.78 is identified as a pullback resistance where price could potentially break above to rise higher. The 1st resistance level at 153.56 is noted as a resistance level that aligns with the 161.80% Fibonacci Extension level, potentially limiting any further upward movement.
On the support side, the 1st support level at 150.65 is marked as an overlap support that aligns close to the 23.60% Fibonacci Retracement level, reinforcing its significance as a key support level.
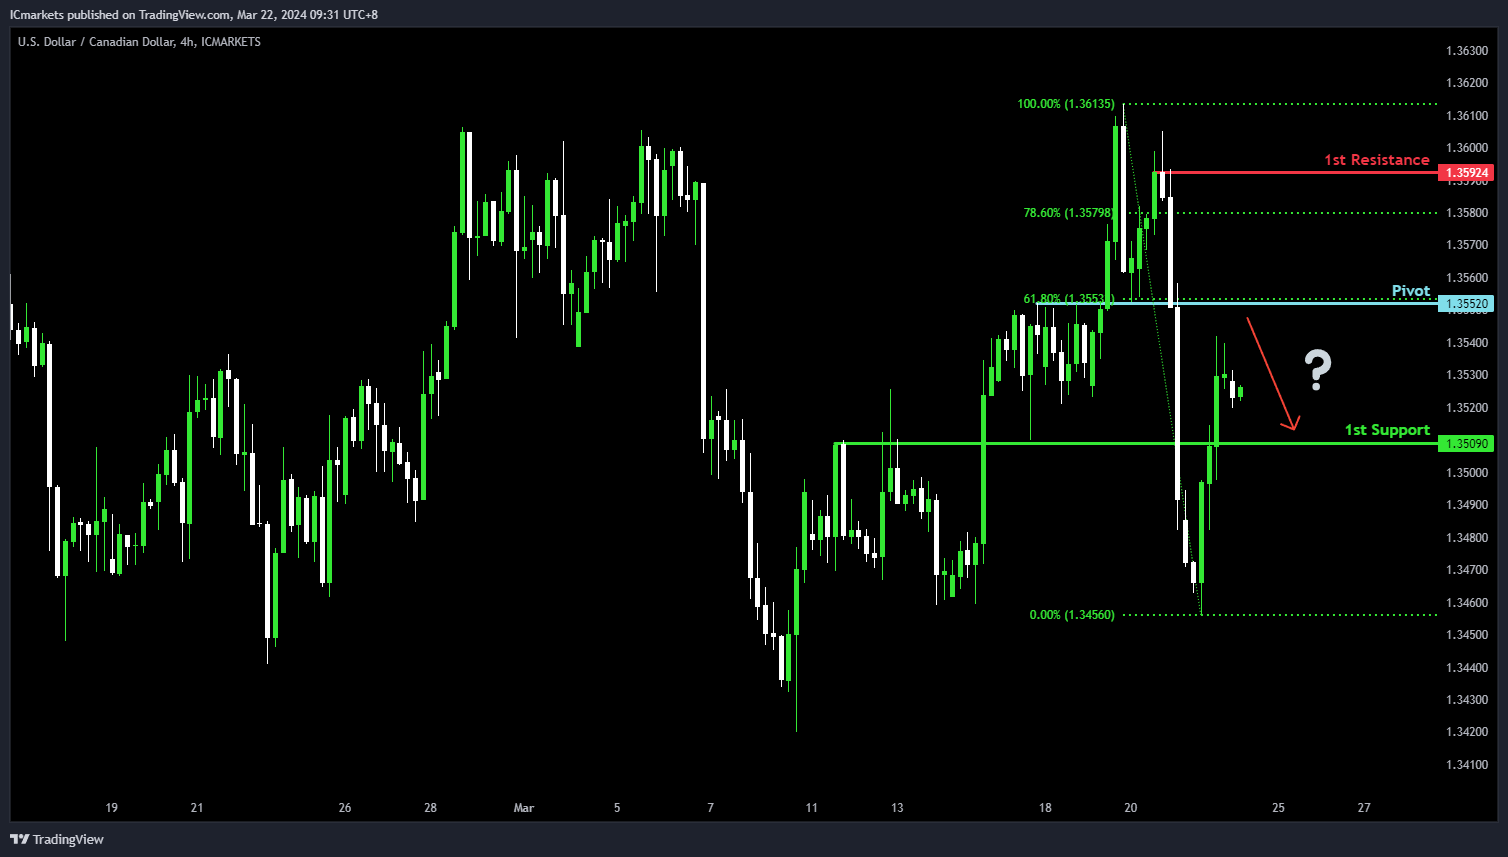
USD/CAD:
The USD/CAD chart currently demonstrates an overall bullish momentum. In this context, there is a potential scenario for price to rise towards the pivot and make a weak bearish reaction from here.
The pivot level at 1.3552 is identified as a pullback resistance that aligns with the 61.80% Fibonacci Retracement level where price could potentially make a weak bearish reaction. The 1st resistance level at 1.3592 is noted as a pullback resistance that sits above the 78.60% Fibonacci Retracement level, potentially limiting any further upward movement.
On the support side, the 1st support level at 1.3509 is marked as an overlap support, reinforcing its significance as a key support level.
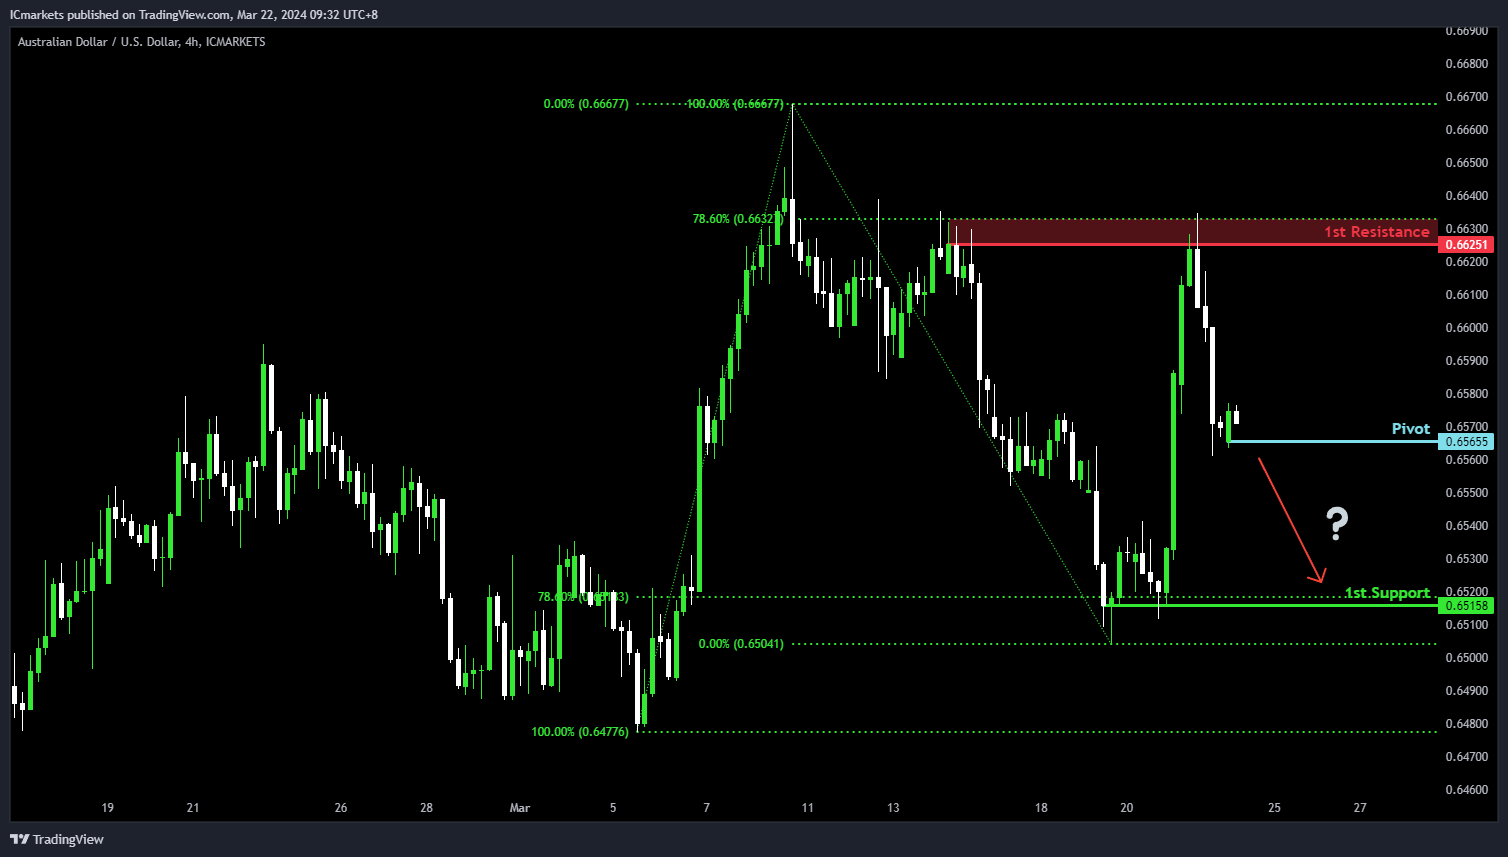
AUD/USD:
The AUD/USD chart currently demonstrates an overall bearish momentum. In this context, there is a potential scenario for price to break under the pivot and fall towards the 1st support.
The pivot level at 0.6565 is identified as a pullback support where price could potentially break under to drop lower. The 1st support level at 0.6515 is marked as a pullback support that aligns with the 78.60% Fibonacci Retracement level, reinforcing its significance as a key support level.
On the resistance side, the 1st resistance level at 0.6625 is noted as a pullback resistance that aligns close to the 78.60% Fibonacci Retracement level, potentially limiting any further upward movement.
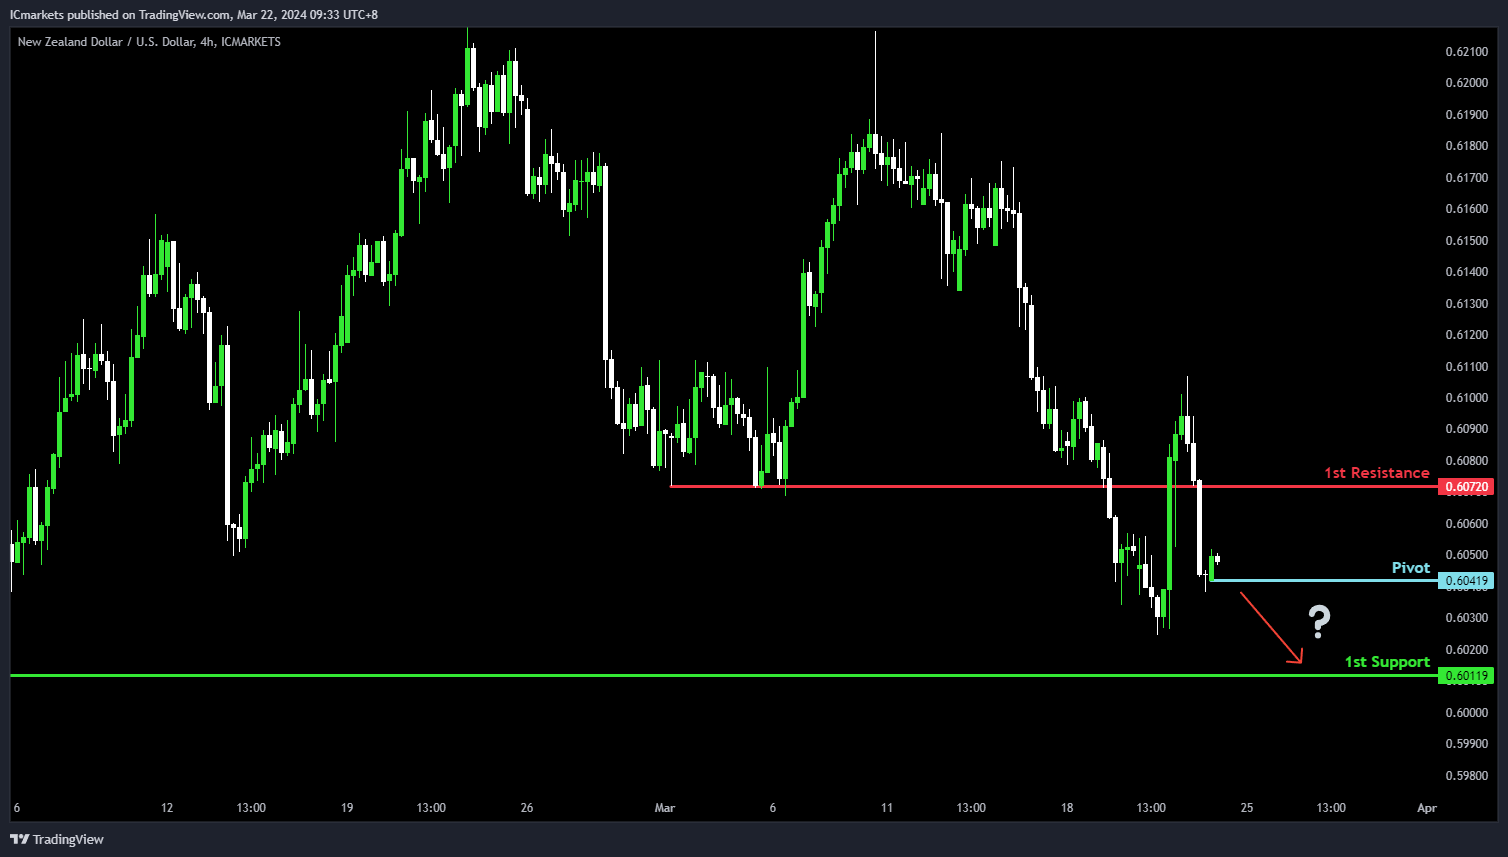
NZD/USD
The NZD/USD chart currently demonstrates an overall bearish momentum. In this context, there is a potential scenario for price to break under the pivot and fall towards the 1st support.
The pivot level at 0.6041 is identified as a pullback support where price could potentially break under to drop lower. The 1st support level at 0.6011 is also marked as a pullback support, reinforcing its significance as a key support level.
On the resistance side, the 1st resistance level at 0.6072 is noted as a pullback resistance, potentially limiting any further upward movement.
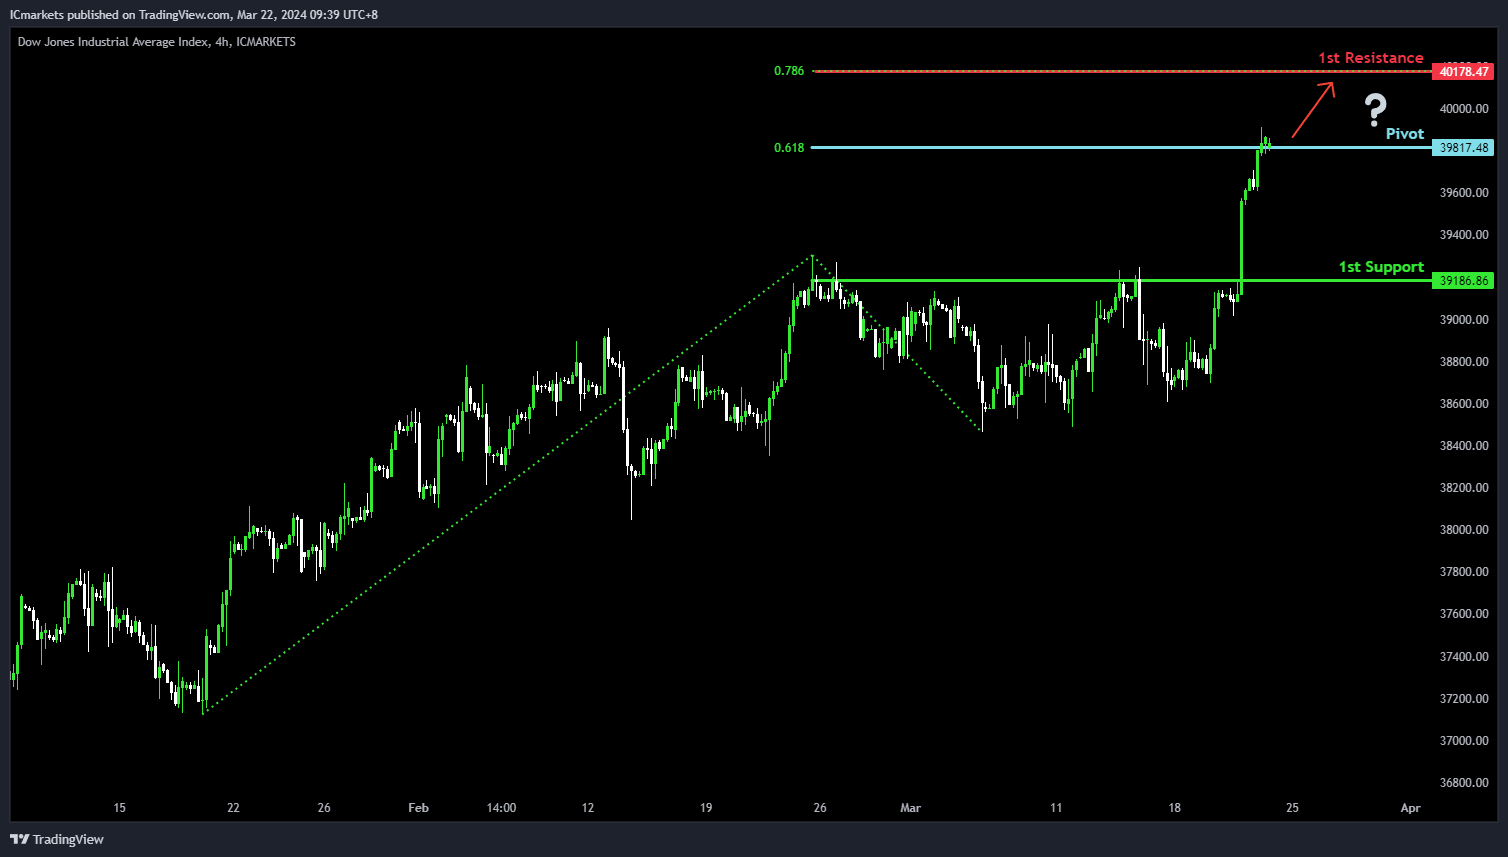
DJ30:
The Dow Jones chart (DJ30) currently demonstrates an overall bullish momentum. In this context, there is a potential scenario for price to break above the pivot and rise towards the 1st resistance.
The pivot level at 39,817.48 is identified as a level where price could potentially break above to rise higher. The 1st resistance level at 40,178.47 is noted as a resistance level that aligns with the 78.60% Fibonacci Projection level, potentially impeding any further bullish movement.
On the support side, the 1st support level at 39,186.86 is marked as a pullback support, reinforcing its significance as a key support level.
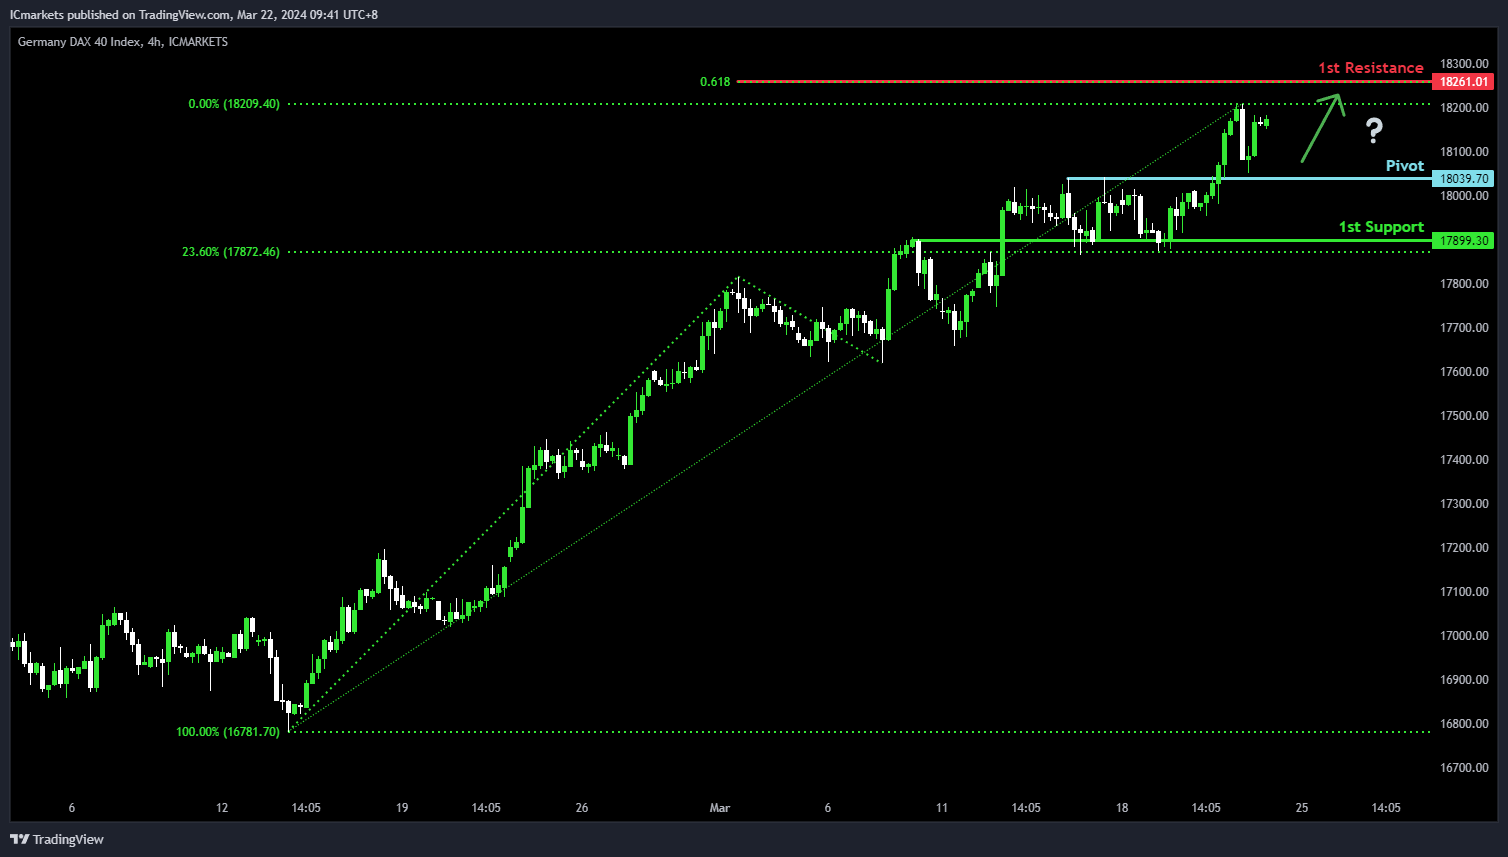
GER40:
The DAX chart (GER40) currently demonstrates an overall bullish momentum. In this context, there is a potential scenario for price to fall towards the pivot before making a bullish bounce towards the 1st resistance.
The pivot level at 18,039.70 is identified as an overlap support where price could potentially reverse from to bounce higher. The 1st resistance level at 18,261.01 is noted as a resistance level that aligns with the 61.80% Fibonacci Projection level, potentially impeding any further bullish movement.
On the support side, the 1st support level at 17,899.30 is marked as an overlap support, reinforcing its significance as a key support level.
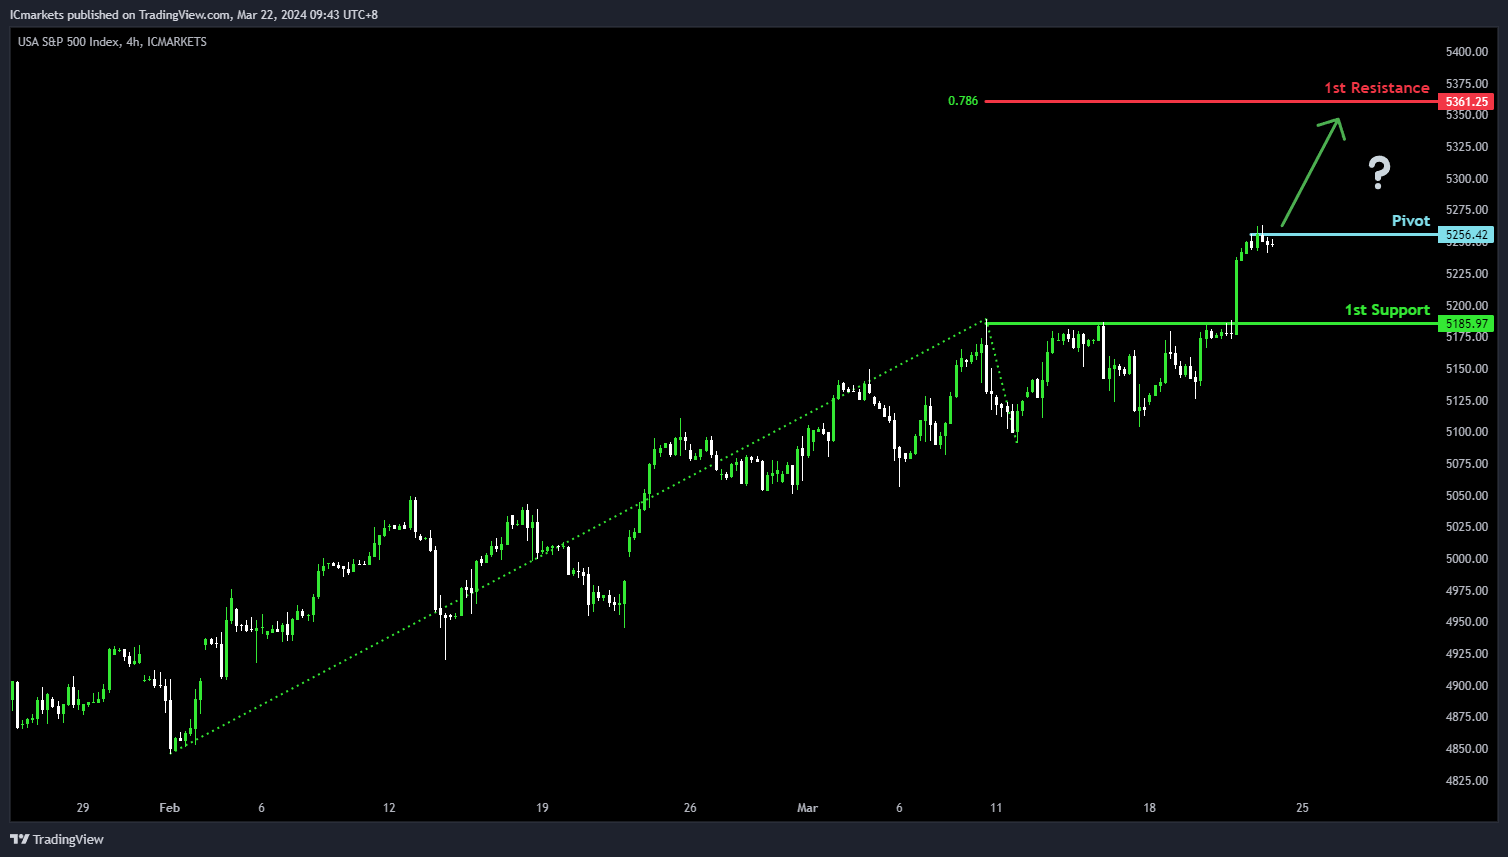
US500:
The S&P 500 chart (US500) currently demonstrates an overall bullish momentum. In this context, there is a potential scenario for price to break above the pivot and rise towards the 1st resistance.
The pivot level at 5,256.42 is identified as a level where price could potentially break above to rise higher. The 1st resistance level at 5,361.25 is noted as a resistance level that aligns with the 78.60% Fibonacci Projection level, potentially impeding any further bullish movement.
On the support side, the 1st support level at 5,185.97 is marked as a pullback support, reinforcing its significance as a key support level.
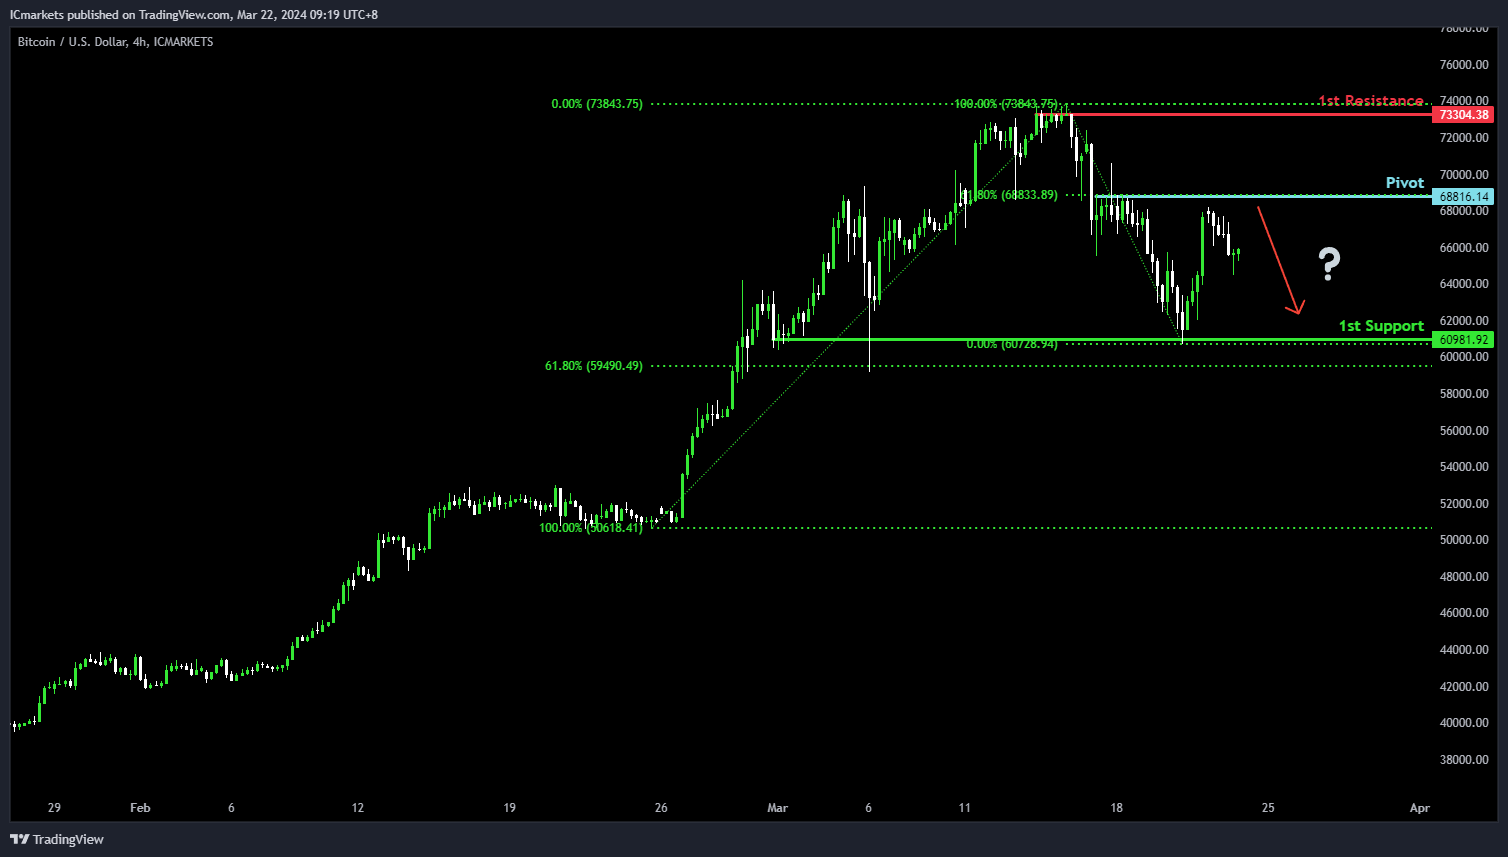
BTC/USD:
The Bitcoin chart (BTC/USD) currently demonstrates an overall bearish momentum. However, there is a potential scenario for price to rise towards the pivot and reverse to drop lower towards the 1st support.
The pivot level at 68,816.14 is identified as a pullback support that aligns with the 61.80% Fibonacci Retracement level where price could potentially make a bearish reversal and drop lower. The 1st support level at 60,981.92 is marked as a pullback support that aligns close to the 61.80% Fibonacci Retracement level, reinforcing its significance as a key support level.
To the upside, the 1st resistance level at 73,304.38 is noted as a swing-high resistance at the all-time high, further reinforcing its significance as a potential barrier to further bullish movement.
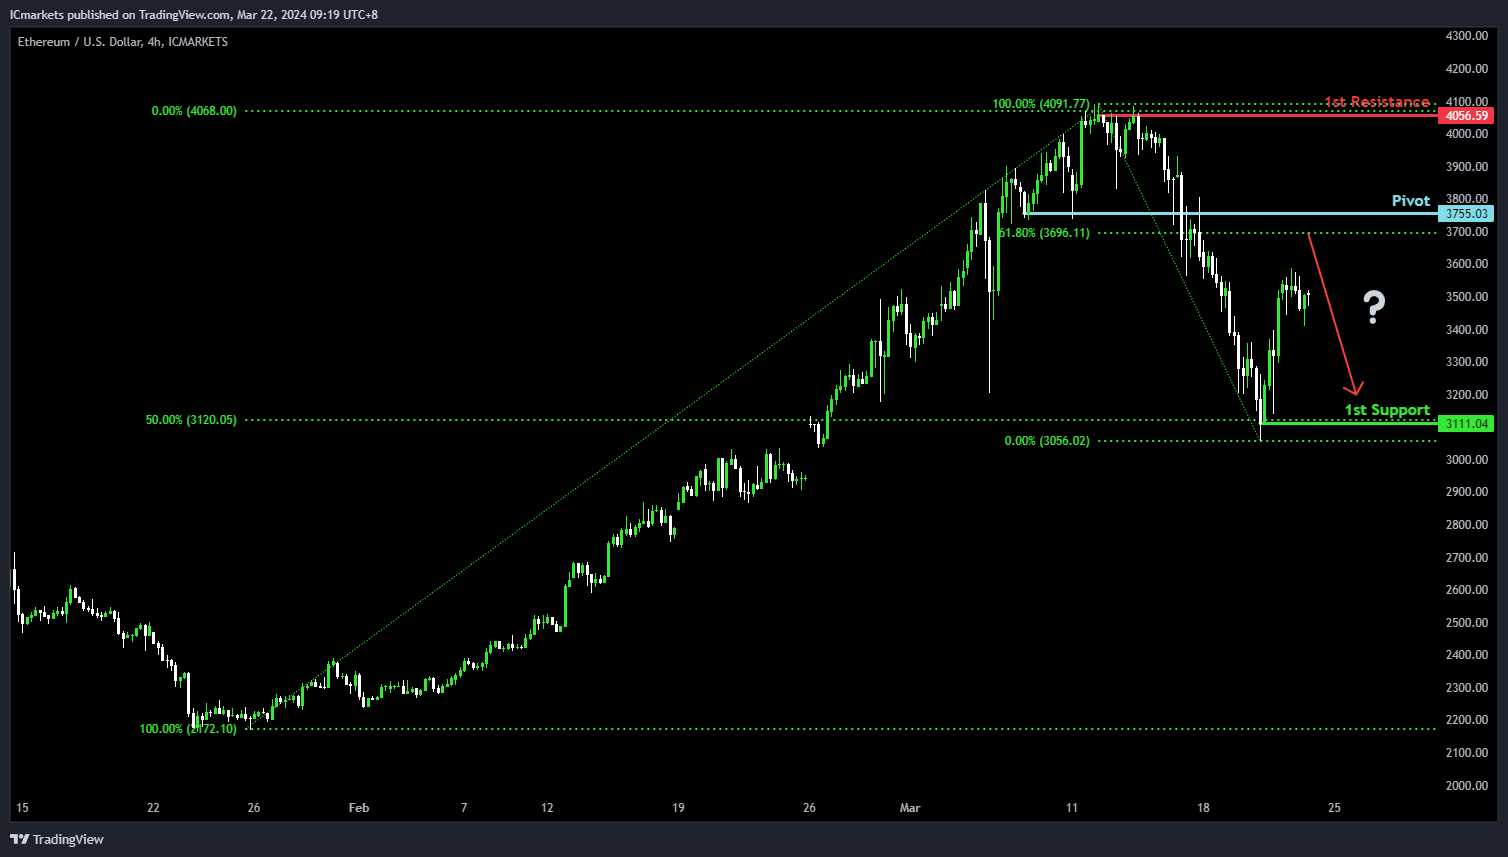
ETH/USD:
The Ethereum chart (ETH/USD) currently demonstrates an overall bearish momentum. However, there is a potential scenario for price to rise towards the pivot and reverse to drop lower towards the 1st support.
The pivot level at 3,755.03 is identified as a pullback support that aligns close to the 61.80% Fibonacci Retracement level where price could potentially make a bearish reversal and drop lower. The 1st support level at 3,111.04 is marked as a pullback support that aligns with the 50.00% Fibonacci Retracement level, reinforcing its significance as a key support level.
To the upside, the 1st resistance level at 4,056.59 is noted as a swing-high resistance, further reinforcing its significance as a potential barrier to further bullish movement.
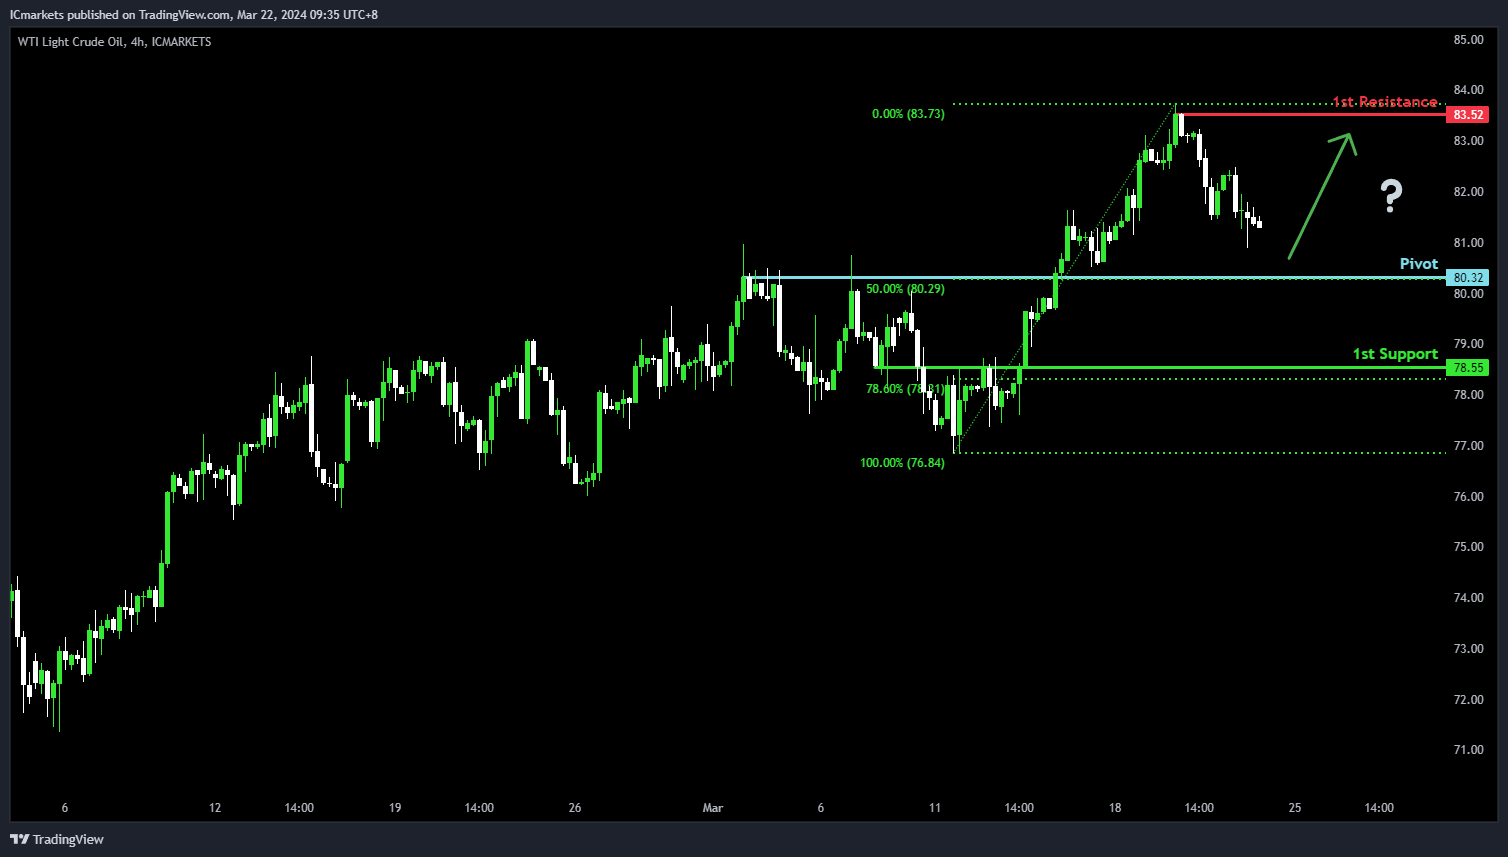
WTI/USD:
The WTI (West Texas Intermediate) oil chart currently demonstrates an overall bullish momentum. However, there is a potential scenario for price to fall towards the pivot before making a bullish bounce to rise towards the 1st resistance.
The pivot level at 80.32 is identified as an overlap support that aligns with the 50.00% Fibonacci Retracement level where price could potentially make a bullish bounce to climb higher. The 1st resistance level at 83.52 is noted as a pullback resistance, further reinforcing its significance as a potential barrier to further bullish movement.
To the downside, the 1st support level at 78.55 is marked as an overlap support that aligns close to the 78.60% Fibonacci Retracement level, reinforcing its significance as a key support level.
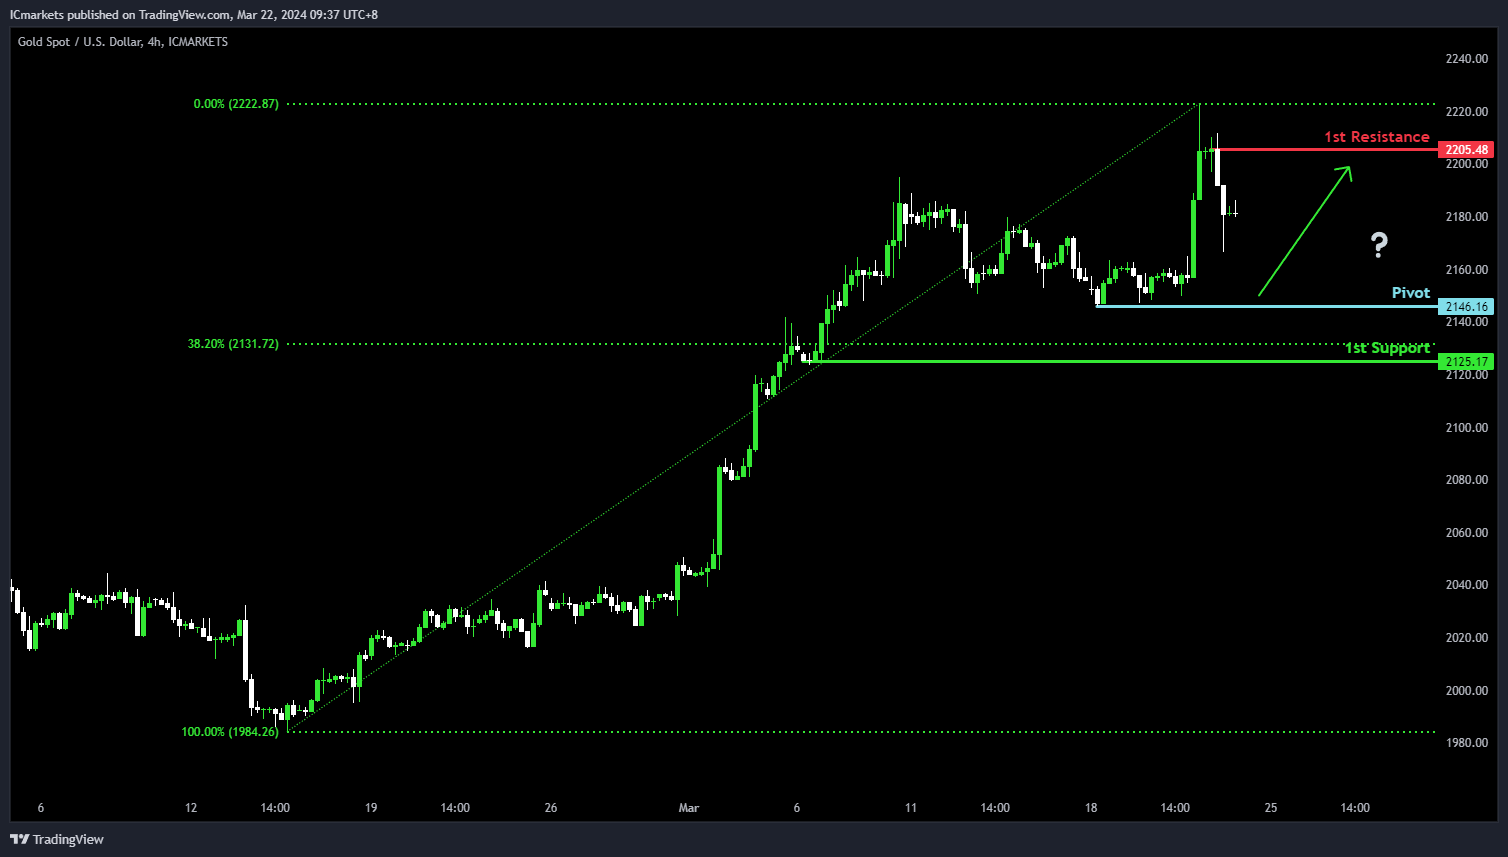
XAU/USD (GOLD):
The Gold (XAU/USD) chart currently demonstrates an overall bullish momentum. However, there is a potential scenario for price to fall towards the pivot before making a bullish bounce to rise towards the 1st resistance.
The pivot level at 2,146.16 is identified as a pullback support where price could potentially make a bullish bounce to climb higher. The 1st resistance level at 2,205.48 is noted as a pullback resistance that is situated close to the all-time high, further reinforcing its significance as a potential barrier to further bullish movement.
To the downside, the 1st support level at 2,125.17 is marked as a pullback support that aligns close to the 38.20% Fibonacci Retracement level, reinforcing its significance as a key support level.


