
During the Asian session on Wednesday, the USDCAD pair rebounded after two days of losses, reaching around 1.3590. This uptick is fueled by a stronger US dollar and lower crude oil prices, which put pressure on the Canadian dollar. The decline in Western Texas Intermediate (WTI) oil prices to approximately $80.70 is attributed to a surplus in API Weekly Crude Oil Stock, indicating an oversupply. Bank of Canada (BoC) Senior Deputy Governor Carolyn Rogers raised concerns about Canada’s low productivity and highlighted inflation concerns. Meanwhile, the US Dollar Index (DXY) rose amid a risk-off sentiment ahead of the US Personal Consumption Expenditures (PCE) release, but declining US Treasury yields suggest market expectations of potential rate cuts by the US Federal Reserve.
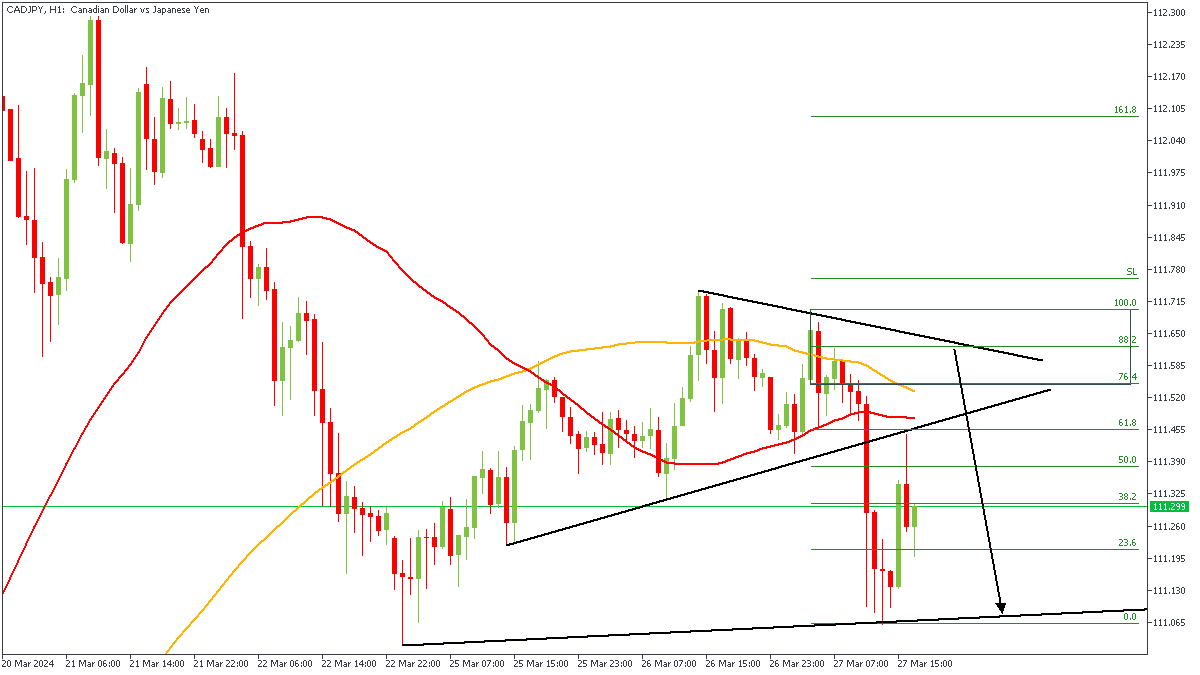
CADJPY – H1 Timeframe
The breakout of price from the wedge pattern on the 1-hour timeframe of CADJPY can be seen to have created a break in the market structure. It is my expectation to see price complete a proper retest of the supply zone responsible for the break of structure. In line with this, the 88% of the Fibonacci retracement, bearish array of the moving averages, and the moving average resistance are my confluence for the bearish sentiment.
Analyst’s Expectations:
- Direction: Bearish
- Target: 111.232
- Invalidation: 111.712
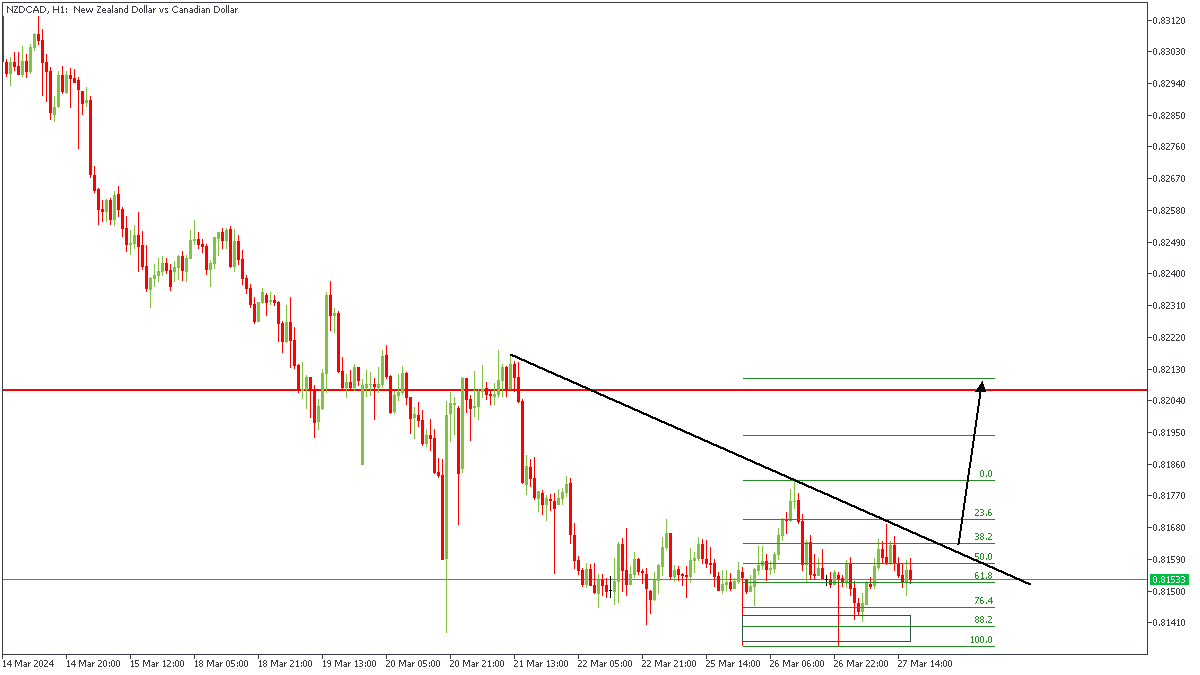
NZDCAD – H1 Timeframe
NZDCAD is currently consolidating below the trendline resistance, which indicates the likelihood of a breakout soon. Following this, I expect to see a breakout above the trendline resistance before settling for a long position on NZDCAD, in the meantime however, my fingers are crossed.
Analyst’s Expectations:
- Direction: Bullish
- Target: 0.82049
- Invalidation: 0.81457
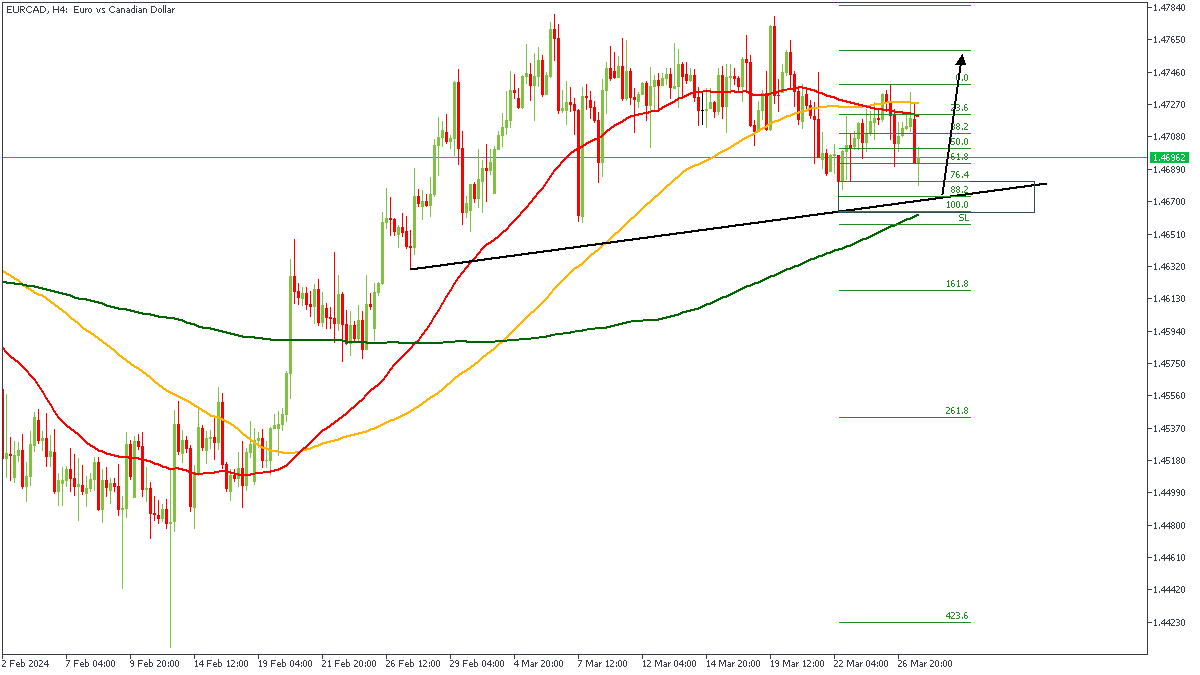
EURCAD – H4 Timeframe
EURCAD is currently approaching a trendline support; implying the likelihood of a bullish rejection from the support line. There is also the presence of a Fibonacci retracement level, 200-period moving average support, and the demand zone as further confluences for the bullish sentiment.
Analyst’s Expectations:
- Direction: Bullish
- Target: 1.47460
- Invalidation: 1.46604
CONCLUSION
The trading of CFDs comes at a risk. Thus, to succeed, you have to manage risks properly. To avoid costly mistakes while you look to trade these opportunities, be sure to do your due diligence and manage your risk appropriately.


 oil prices to approximately $80.70 is attributed to a surplus in API Weekly Crude Oil Stock, indicating an oversupply. Bank of Canada (BoC) Senior Deputy Governor Carolyn Rogers raised concerns about Canada's low productivity and highlighted inflation concerns. Meanwhile, the US Dollar Index (DXY) rose amid a risk-off sentiment ahead of the US Personal Consumption Expenditures (PCE) release, but declining US Treasury yields suggest market expectations of potential rate cuts by the US Federal Reserve.)