
The EUR/USD pair has dipped to its lowest since 15 February this year following the release of encouraging data regarding the US manufacturing sector’s activity on Monday. This improvement, the first since September 2022, has bolstered the US dollar’s position.
The Institute for Supply Management (ISM) reported that the manufacturing business activity index climbed to 50.3 points in March from 47.8 in the preceding month. This rise above the crucial 50.0-point threshold, which distinguishes contraction from expansion, signals a positive development for the sector.
Key insights from the report highlight an increase in new orders, although manufacturing employment figures remained subdued. The surge in raw material prices also influenced the overall index, which might have otherwise recorded a higher reading. Importantly, this data signifies the end of the manufacturing sector’s most prolonged downturn in 16 months, a sector that constitutes approximately 10.4% of the US economy.
Further economic data revealed that the US Core Personal Consumption Expenditure (PCE) rose by 0.3% in February, slightly below the anticipated 0.4% increase. This Core PCE index, closely monitored by the Federal Reserve, suggests that the Fed may have room to adjust interest rates downwards in June 2024, given the subdued inflationary pressures.
Market expectations for the Federal Reserve’s decision in June have seen slight adjustments. CME FedWatch Tool data indicate a 66% likelihood of policy easing, a slight decrease from the prior 68% and significantly up from 57% the previous week.
Technical analysis of EUR/USD
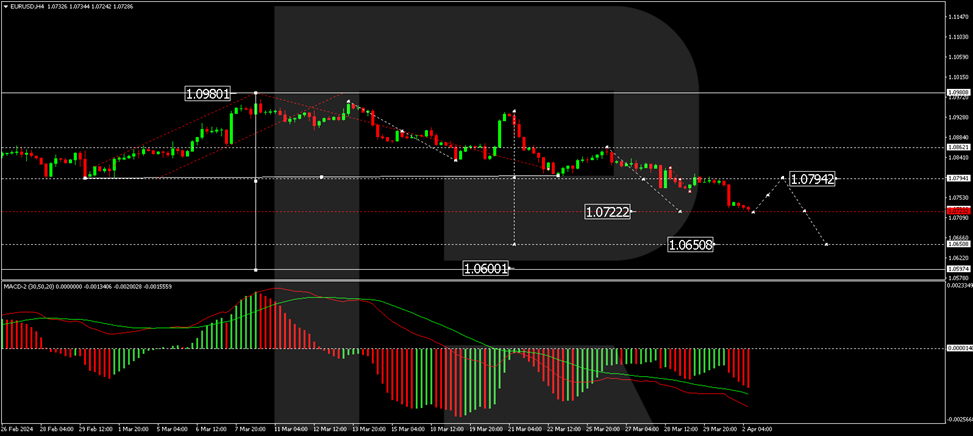
H4 Chart Analysis: the EUR/USD pair is currently in a consolidation phase around the 1.0794 level. A downward breakout from this range could lead to a continued decline towards 1.0650. A corrective move back to 1.0794, testing from below, may follow, with potential further descent to 1.0600. This scenario is supported by the MACD indicator, which shows the signal line below zero, indicating a continued downward trend.
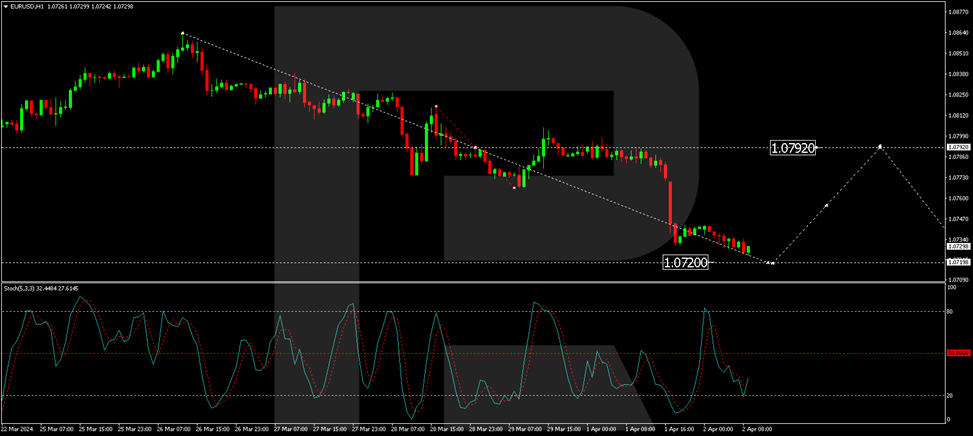
H1 Chart Analysis: a corrective structure has been completed at the 1.0804 level on the H1 chart. Following the news release, the market breached the 1.0777 level downwards, continuing the downward trajectory towards 1.0720. Upon completion, a potential uptick to 1.0790 (testing from below) could occur before another drop to the 1.0650 mark. The Stochastic oscillator, currently below 50, anticipates a further decline to the 20 mark, supporting the bearish outlook.


