
- The Japanese Government Bond (JGB) market is now anticipating a potential Q2 recovery in the Japanese economy as the 2-year and 10-year JGB yields have rallied to more than a decade high.
- The 10-year and 20-year yield premiums of US Treasuries over JGBs have shrunk in the past two weeks which in turn supports a potential bearish reversal in USD/JPY.
- However, technical analysis suggests an ongoing potential medium-term uptrend in USD/JPY.
- In the short term, watch these two key levels of 157.00 and 155.30 on the USD/JPY
Since our last publication, the price actions of the USD/JPY have staged a decline of -5.2% (837 pips) to print a recent low of 151.85 on 3 May after it hit its long-term pivotal resistance of 159.30/160.20 on 29 April.
The swift decline of USD/JPY has been attributed to a yet-to-be-confirmed Bank of Japan (BoJ) direct FX intervention on 29 April and 2 May under the instructions of the Ministry of Finance (MoF) to sell the US dollar against the yen.
Since its 3 May low of 151.85, the USD/JPY has traded sideways around a flat 20-day moving average as both bulls and bears are bombarded by conflictive factors.
Fundamentals suggest a potential revival of JPY bulls
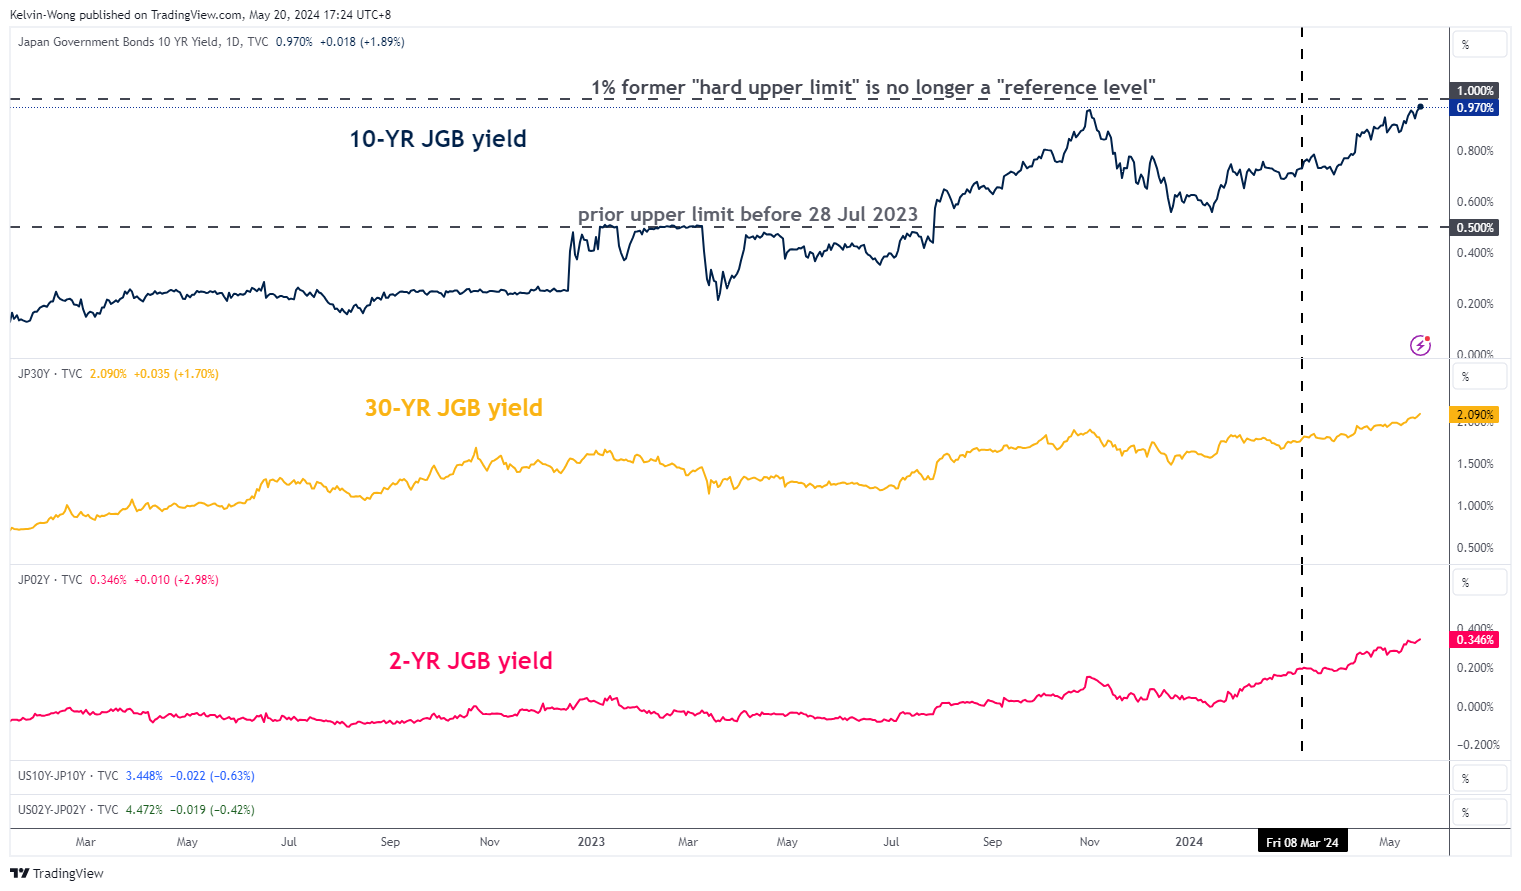
Fig 1: JGB yields medium-term & major trends as of 20 May 2024 (Source: TradingView, click to enlarge chart)
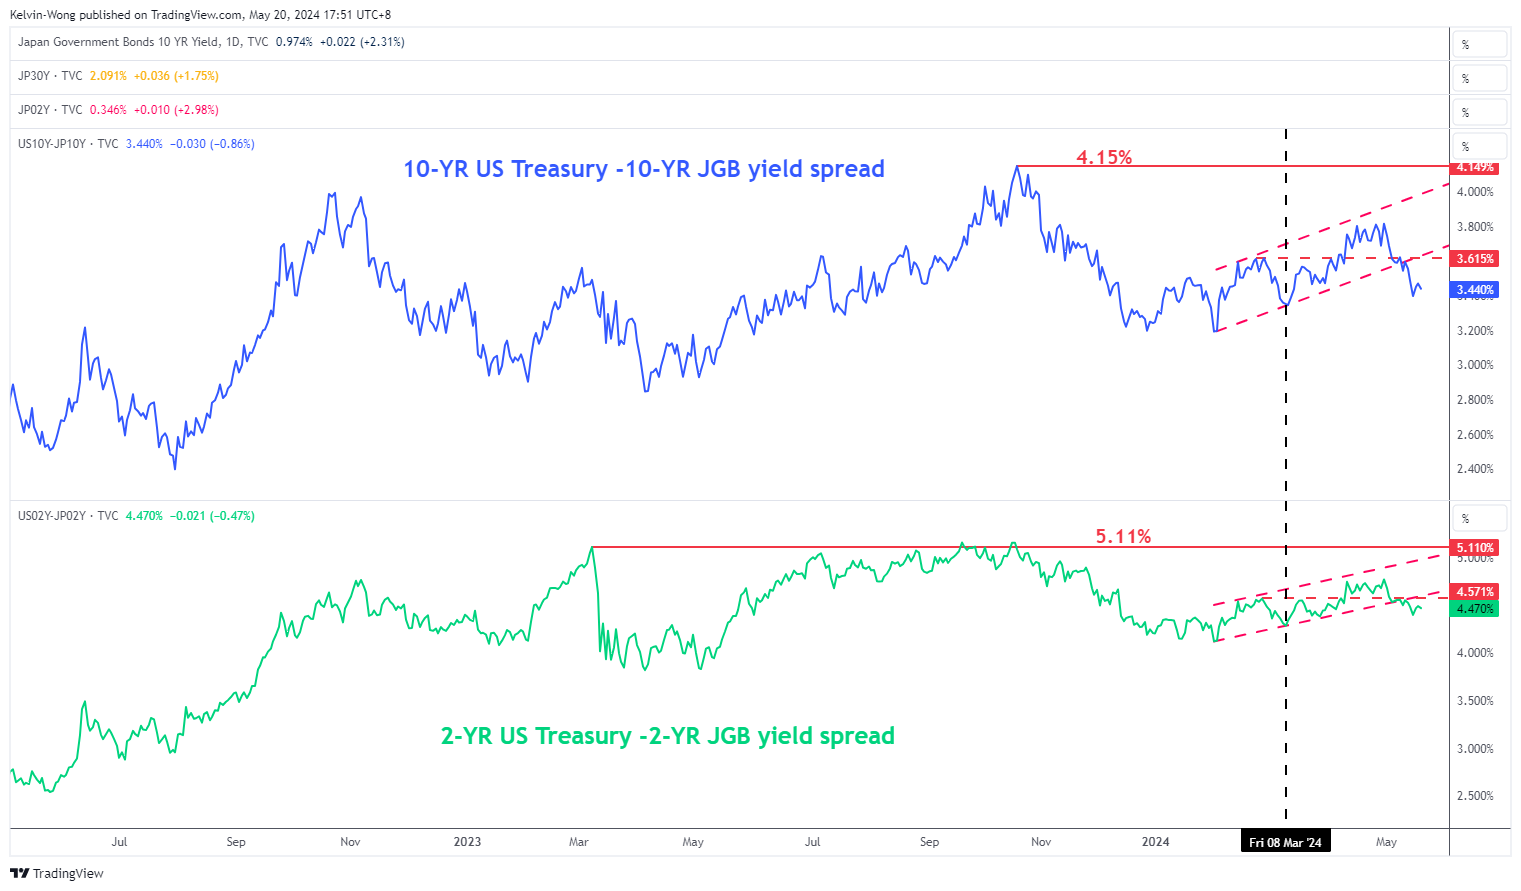
Fig 2: 2-YR & 10-YR US Treasury/JGB yield spread medium-term & major trends as of 20 May 2024 (Source: TradingView, click to enlarge chart)
Despite the weaker-than-expected preliminary Japan Q1 2024 GDP data released last Thursday, 16 May that came in at -0.5% q/q, below consensus of -0.4% q/q. The Japanese Government Bond (JGB) market has looked past this set of lagging data as both the short and long-end of the JGB curve traded higher.
The 30-year JGB yield is considered a gauge for long-term growth and inflationary trends have rallied above its prior week level to 2.09% at this time of the writing, its highest level since April 2011.
Also, the 2-year JGB yield that is more sensitive to anticipating BoJ’s monetary policy stance on its short-term overnight interest rate has inched higher concurrently to 0.35%, its highest level since June 2009 (see Fig1).
The current bullish backdrop on both the 2-year and 10-year JGB yields suggests that market participants in the JGB market have likely shrugged off the weak Q1 GDP growth data and expect the Japanese economy to potentially recover in Q2 due to the recent Shunto wage rise and tax cuts that should lift consumption spending for households.
Interestingly, the recent pace of increase in JGB yields seen in the past two weeks is much steeper than yields of the US Treasury notes. The premium on the yield spread between 10-year US Treasury/JGB and 2-year US Treasury/JGB have narrowed since the bearish breakdown below their former key medium-term supports at 3.61% and 4.57% respectively (see Fig 2).
The narrowing of the 10-year yield spread premium between US Treasury notes over JGBs has made US Treasury notes a less attractive fixed-income investment for Japanese insurance companies that in turn may reduce their US Treasuries exposure and overweight their fixed-income portfolio towards JGBs due to higher odds that the long-term JGBs yields are likely to trend higher.
These potential upcoming fixed-income portfolio adjustments from Japanese insurance companies may offer some support to stall the major yen’s weakness against the US dollar.
Medium-term momentum factor suggests potential JPY weakness
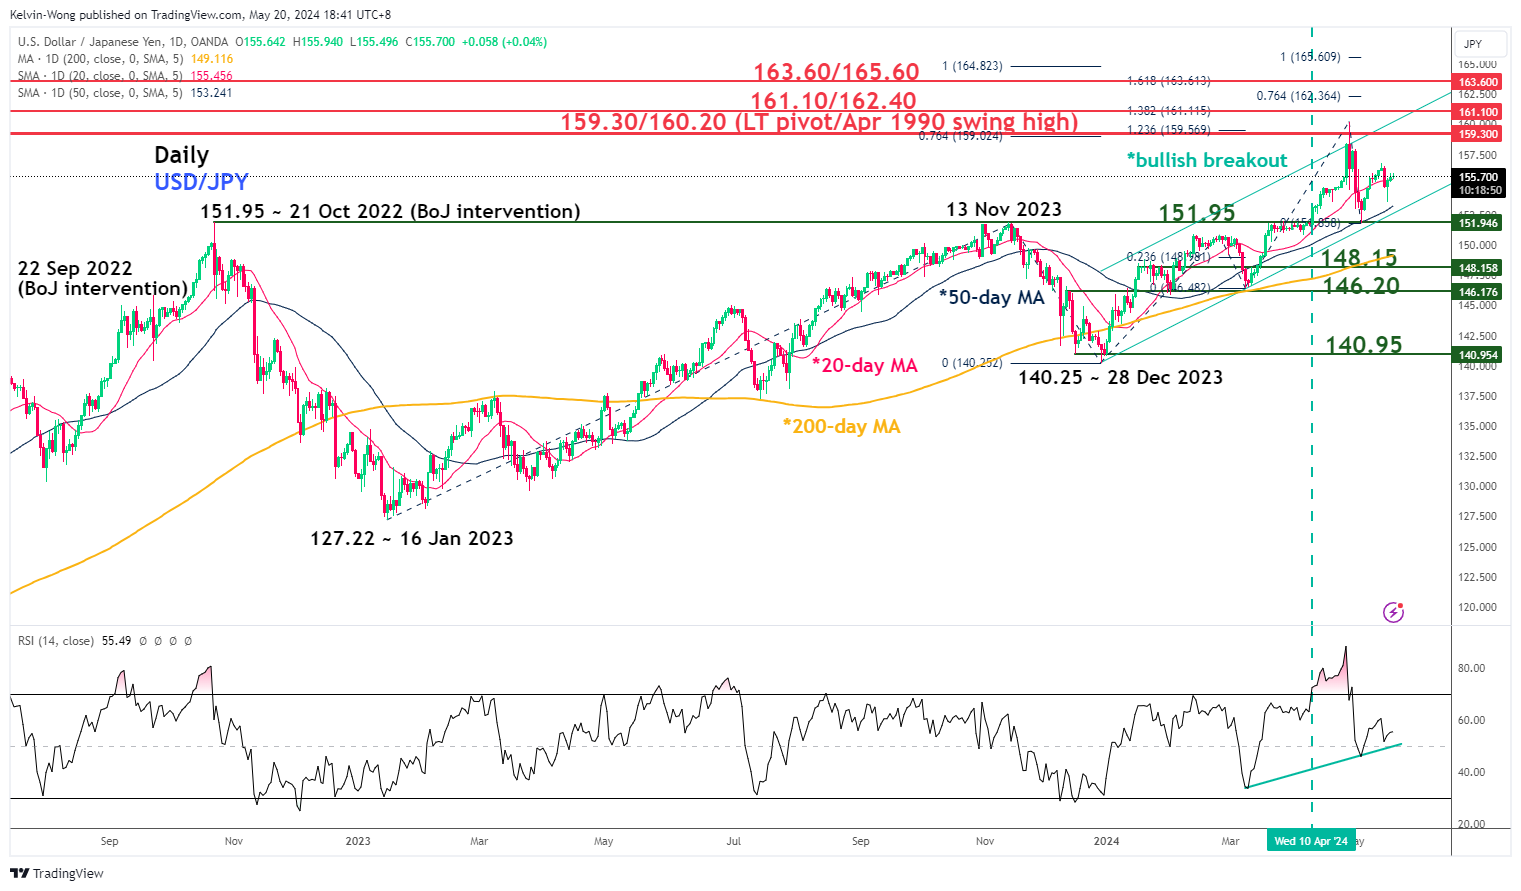
Fig 3: USD/JPY medium-term & major trends as of 20 May 2024 (Source: TradingView, click to enlarge chart)
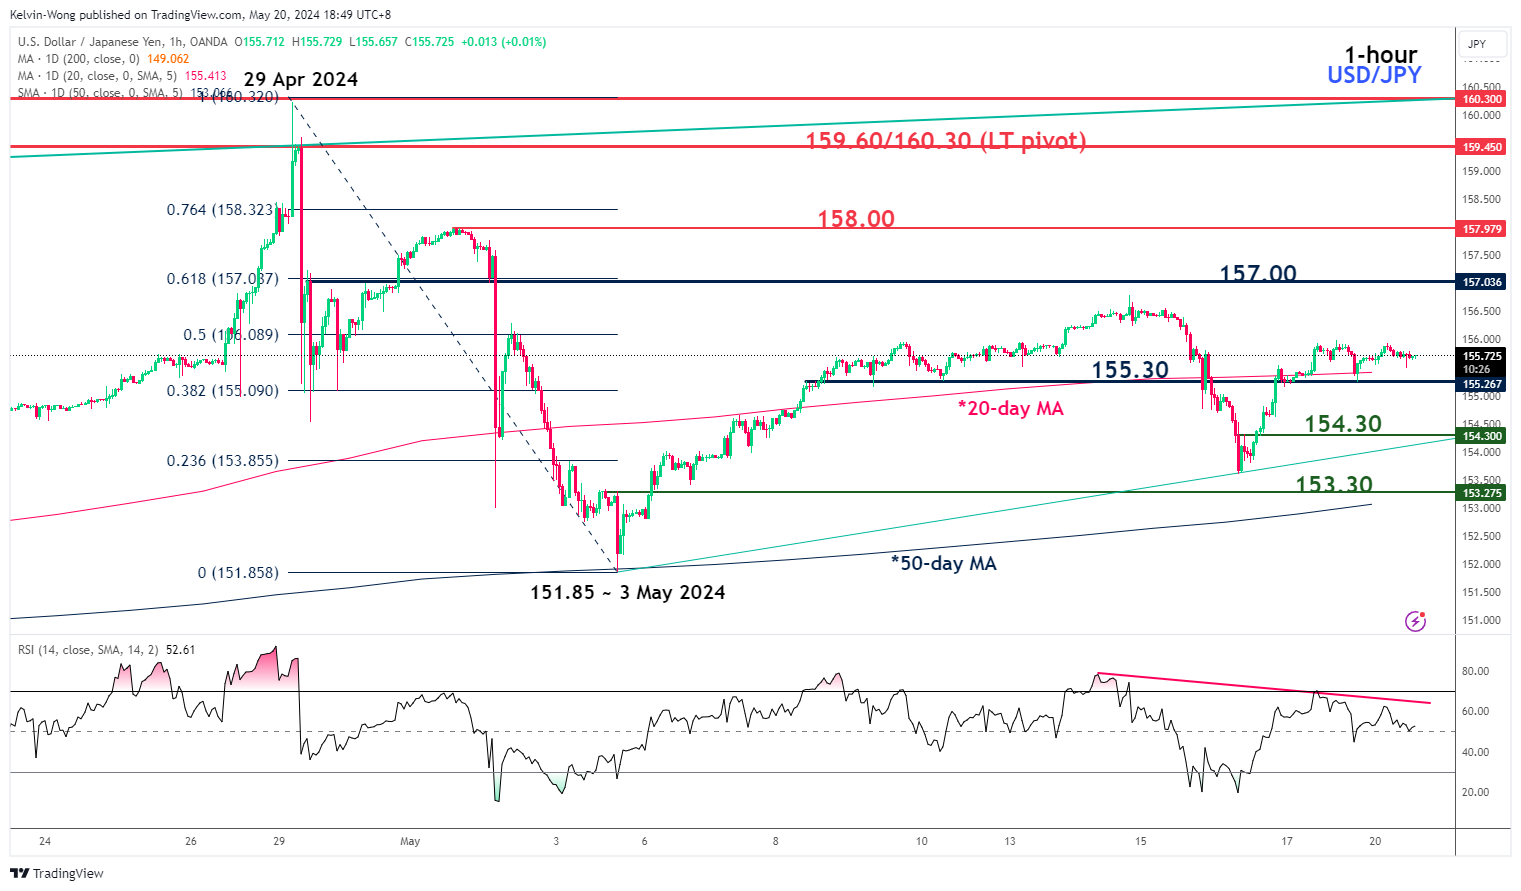
Fig 4: USD/JPY short-term trend as of 20 May 2024 (Source: TradingView, click to enlarge chart)
Based on the lens of technical analysis, the medium-term uptrend phase of the USD/JPY in place since the 28 December 2023 low of 140.25 remains intact as its price actions continued to oscillate within an ascending channel (see Fig 3).
In addition, its daily RSI momentum indicator is still being supported by a parallel ascending trendline at the 50 level which suggests no clear signs of bearish momentum at this juncture.
Short-term key technical elements are mixed as seen on the 1-hour chart of USD/JPY where the hourly RSI momentum indicator has printed a series of “lower highs” (see Fig 4).
Neutral between 157.00 and 155.30. Only a clearance above 157.00 may see the next near-term resistance coming in at 158.00 and above it exposes the 159.60/160.30 long-term pivotal resistance in the first step.
On the other hand, a break below 155.30 may see a slide towards the next near-term supports at 154.30 and 153.30 (also the upward-sloping 50-day moving average).


 to print a recent low of 151.85 on 3 May after it hit its long-term pivotal resistance of 159.30/160.20 on 29 April.)