
- Fed’s cautious stance drives WTI crude oil lower
- Commodity capped by bearish cross and 80.00 level in daily chart
- Prices consolidate in 4-hour timeframe
Oil prices continued to decrease on Tuesday due to the cautious stance of Fed officials despite the recent softening of inflation. This has raised concerns that US interest rates may remain elevated for an extended period. The prices of Brent crude and WTI futures have both decreased by almost 2% from yesterday, with Brent crude trading at $83.11 per barrel and WTI trading at $78.45 per barrel. Federal Reserve officials are still hesitant to declare that they have successfully controlled inflation. This indicates that they believe it is necessary to maintain a policy of restricting economic activity for some time.
Federal Reserve Vice Chair Philip Jefferson stated on Monday that it is currently premature to determine whether the deceleration in inflation will have a lasting impact. Meanwhile, Vice Chair Michael Barr expressed the view that a more cautious approach to policy implementation requires additional time. Raphael Bostic, the President of the Atlanta Federal Reserve, stated that it will require a significant amount of time for the central bank to have a high level of certainty over the durability of a deceleration in price growth.
Overall, the statements made by the Federal Reserve officials indicated that interest rates are likely to remain elevated for a longer duration than what is anticipated by the financial markets. This has consequences for the oil market, as increased borrowing costs restrict the availability of cash, thus impacting economic growth and the demand for crude oil.
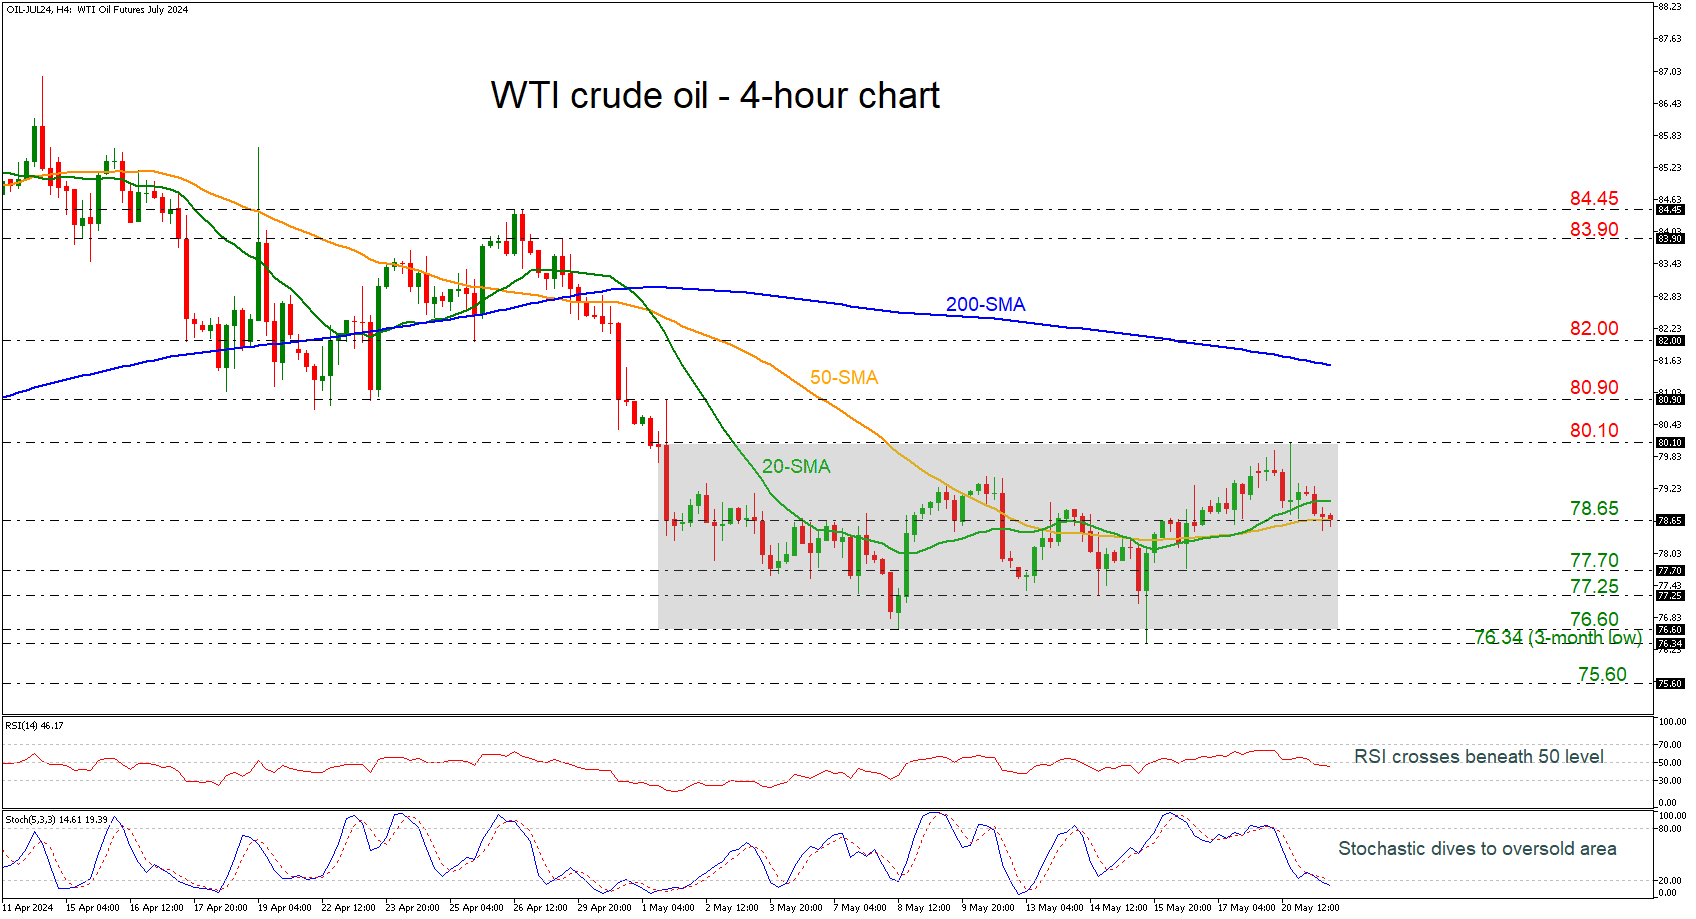
WTI crude oil – 4-hour chart
From a technical perspective, in the 4-hour chart, oil prices are consolidating within a three-week trading range, with upper boundary the 80.10 resistance and lower boundary the 76.60 support.
Currently, the price is moving slightly lower of the 20- and the 50-period simple moving averages (SMAs) with the next support level coming from the 77.70 barricade. Even lower, the 77.25 mark and the lower boundary of the channel at 76.60 could come next, before retreating below the range, testing the three-month low of 76.34 and the 75.60 support, taken from the lows on February 15. A dive towards the latter level could switch the outlook to a strongly bearish one.
The oscillators are confirming the recent descending movement with the RSI slipping below the neutral threshold of 50 and the stochastic oscillator easing in the oversold area, indicating more losses.
On the other hand, a successful jump above the SMAs could take the commodity towards the upper boundary of the range at 80.10. Surpassing this line, the 80.90 level and more importantly the 200-period SMA at 81.60 could act as strong resistance barriers. The outlook may turn to a more positive one only if there is a rise above the 82.00 round number.
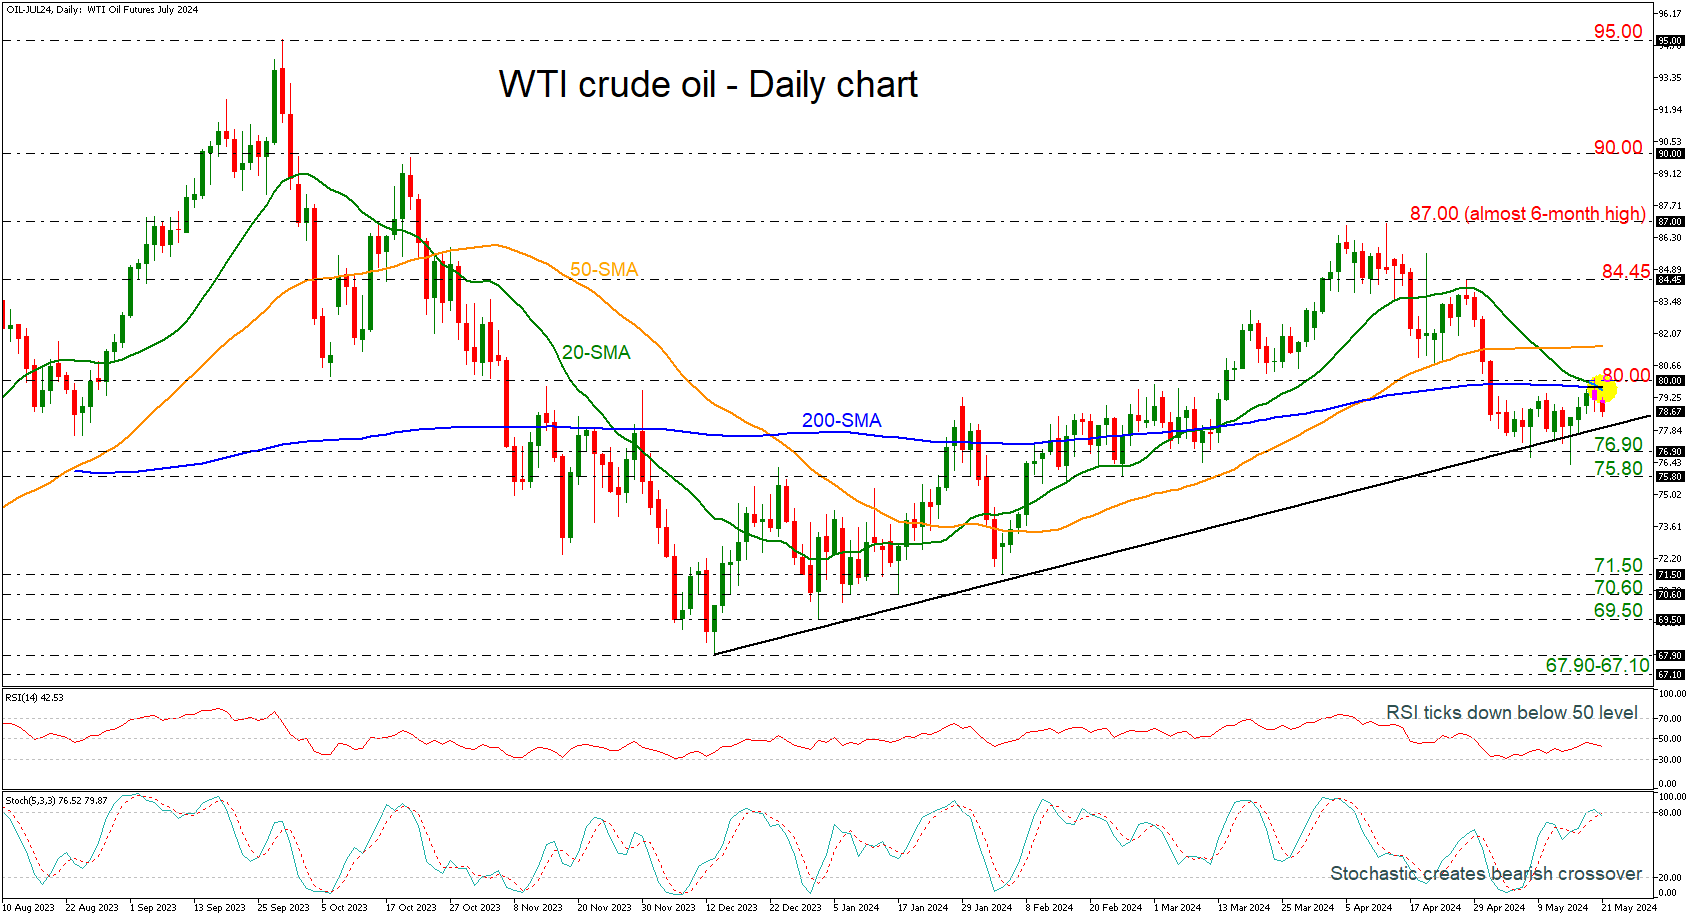
Bigger outlook on oil prices
Turning to the longer-term timeframe and the daily chart, oil prices are still developing above the ascending trend line, which has been drawn from December 13, but it is currently capped by a death crossover within the 20- and the 200-day SMAs around the 80.00 psychological number.
These obstacles may send the market for another challenge with the uptrend line before trying again to jump above the SMAs. A successful attempt above 80.00 could raise the positive scenario for a retest of the 50-day SMA at 81.50. If there’s more upside pressure, it could hit the 84.45 bar.
However, if the bears take the upper hand, the immediate support region could be at 75.80-76.90 before tumbling to 71.80, achieved on February 5.
The technical oscillators are suggesting a bearish retracement, with the RSI pointing down beneath the 50 level and the stochastic posted a negative crossover within its %K and %D lines in the oversold area.
To sum up, WTI crude oil is looking neutral in the 4-hour chart, while in the daily timeframe, it is remaining above the uptrend line. But the obstacle of the 80.00 level may prove to be tough for traders to surpass it anytime soon.


