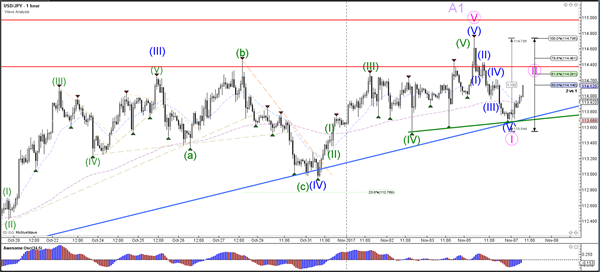
Currency pair USD/JPY
The USD/JPY is challenging the 114.50-115 resistance zone, which is a major break or bounce spot. Yesterday’s daily candle ended up bearish with a major wick on the top of the candle. A rising wedge reversal chart pattern could also be taking place but the confirmation of the pattern occurs when price breaks below the support.
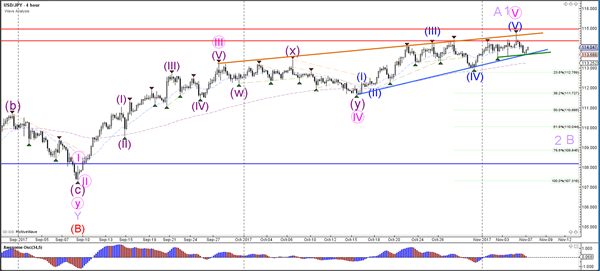
The trend is up at the moment but price seems to be losing steam and speed as it approaches resistance (red). The USD/JPY will need to break above resistance (red) or below support (blue) before the direction could be clear.
Currency pair EUR/USD
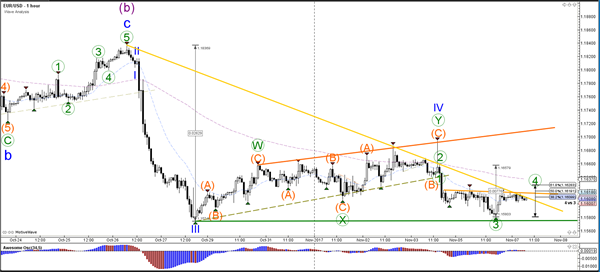
EUR/USD is still struggling to move lower as it failed yesterday to break below the low and bottom (green). The pattern however remains bearish but a new break below the bottom is needed before the wave 5 (blue) is able to continue.
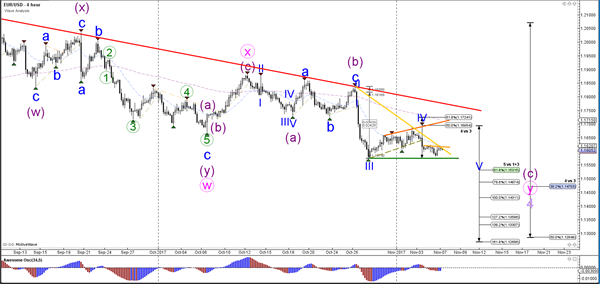
The EUR/USD seems to be building a wave 4 (green) correction and the Fibonacci levels could act as resistance. A break above the 61.8% Fibonacci level makes a wave 4 (green) less likely.
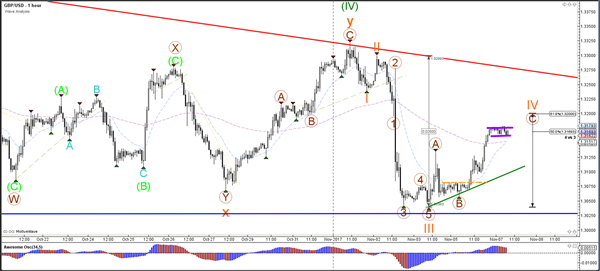
Currency pair GBP/USD
The GBP/USD is testing the Fibonacci levels of wave 4 (orange), which could act as resistance. A break above the 61.8% Fib makes a wave 4 (orange) less likely.
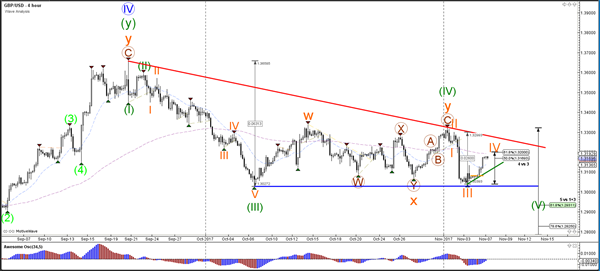
The GBP/USD is building a small flag. A break below or above it could indicate a small breakout.