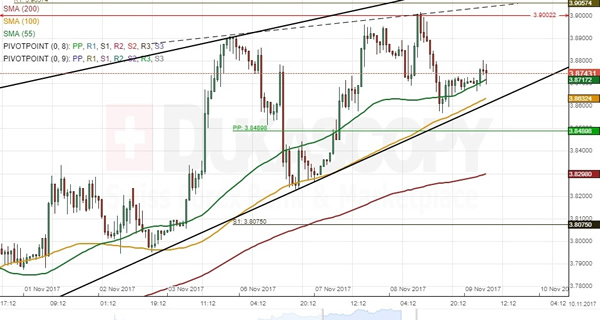
After reaching its ultimate high of 3.90 in January this year, USD/TRY was set for a price decline. This situation changed in early September when the pair reversed to the upside once again. Thus, an ascending wedge was formed. The rate reached its highest mark since January on Wednesday when it reversed from the 3.90 mark. During this movement, the pair failed to reach the upper line of the steep wedge. This might indicate that a downside breakout might be in sight. In case the current sentiment is to prevail, this breakout might occur late on Friday. However, given the minor potential until 3.9250, the Greenback might still push higher for a few sessions, possibly up to the monthly R1 at 3.9057. It is possible that the pair hinders near the bottom wedge boundary for several hours prior to breaching it. However, when breached, a quite significant fall should be expected.