
Currency pair GBP/USD
The GBP/USD is testing the Fibonacci levels of wave 4 (orange). A break above the 61.8% Fib makes a wave 4 (orange) less likely whereas a break below support could indicate a bearish breakout. Price is building a smaller triangle in a larger wedge pattern (red/blue lines).
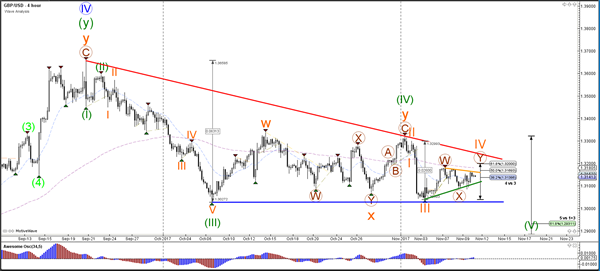
The GBP/USD is in a contracting triangle which is marked by clear support (green) and resistance (orange).

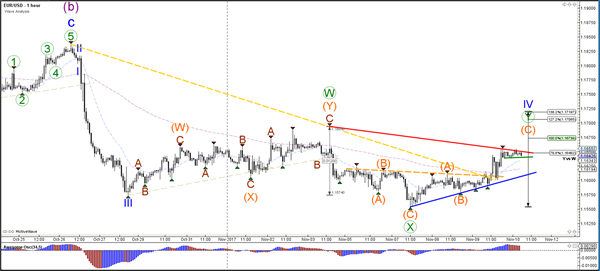
Currency pair EUR/USD
EUR/USD is making a larger bullish retracement within the downtrend. The Fibonacci levels of wave 4 (blue) could act as resistance if price breaks above the trend line (orange). A break below the support trend line (blue) could indicate a potential bearish breakout within wave 5 (blue).

The EUR/USD seems to be building an ABC (orange) within a wave 4 (green) correction.
Currency pair USD/JPY
The USD/JPY broke below the support trend line (dotted blue) but price action remains choppy. The failure to break the 114.50-115 resistance zone so far could be an early indication that wave 1 or A (light purple) has been completed.
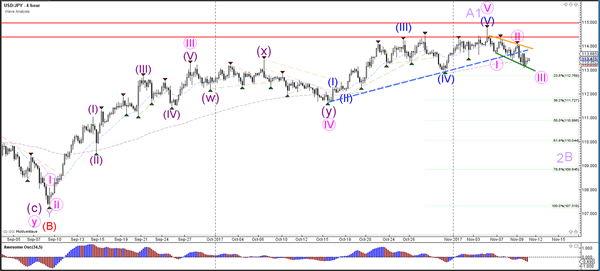
The USD/JPY is behaving choppily and building a corrective pattern on this 1-hour chart.


