
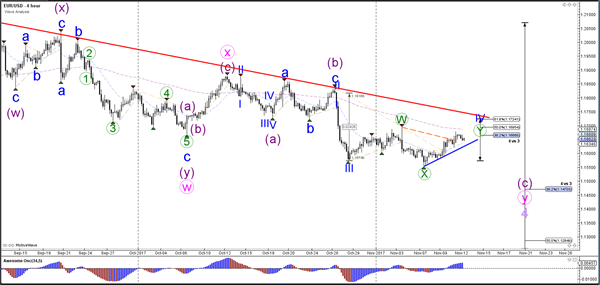
Currency pair EUR/USD
EUR/USD is in a wave 4 (blue) bullish retracement within a larger downtrend and therefore the Fibonacci levels of wave 4 (blue) could act as resistance. A break below the support trend line (blue) could indicate a potential bearish breakout within wave 5 (blue) of wave C (purple).
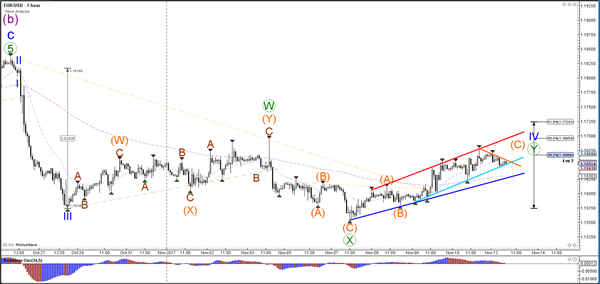
The EUR/USD seems to be building an ABC (orange) within a wave 4 (blue) correction. The wave C (orange) could extend to test higher Fibonacci levels if it breaks above the local resistance trend line (orange).
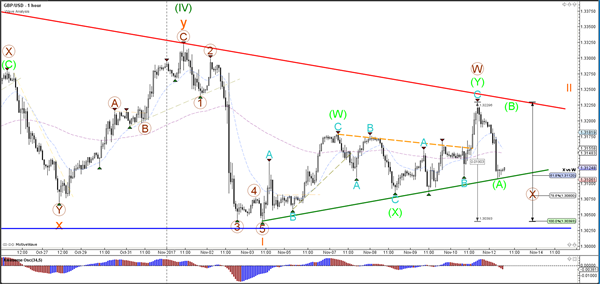
Currency pair GBP/USD
The GBP/USD is showing multiple corrective patterns and a break below support (blue) or resistance (red) is needed before a larger directional move can be expected.
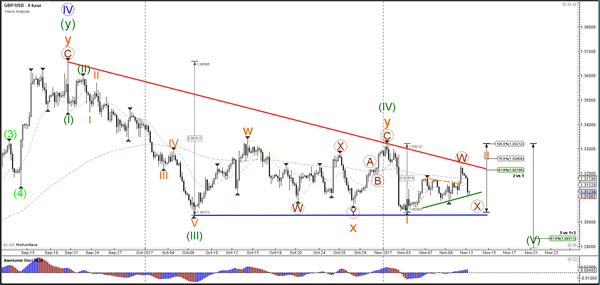
The GBP/USD is probably expanding the correction if price stays in between support and resistance trend lines.
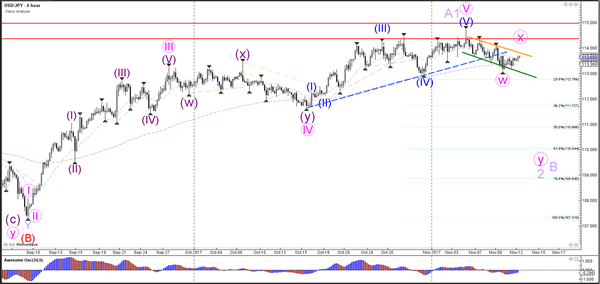
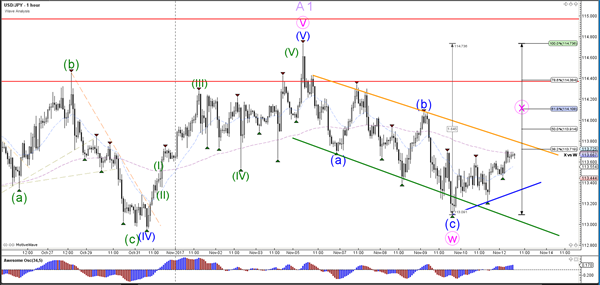
Currency pair USD/JPY
The USD/JPY is building a choppy bearish trend channel. The correction could go lower if price stays in the channel or breaks below the 23.6% Fibonacci level. In that case a wave 2 or wave B (light purple) could be developing.
The USD/JPY is building a bullish correction to the top of the bearish channel.


