
Key Highlights
- WTI Crude Oil price started a fresh decline from the $73.25 resistance.
- It traded below a key bullish trend line with support at $72.20 on the 4-hour chart.
- Gold started a downside correction from the $2,685 high.
- Bitcoin dipped after the bulls struggled above $66,000.
WTI Crude Oil Price Technical Analysis
WTI Crude Oil price recovery stalled near the $73.25 resistance zone. The price started a fresh decline and traded below the $72.00 level.
Looking at the 4-hour chart of XTI/USD, the price traded below a key bullish trend line with support at $72.20. It settled below the $72.00 level, the 100 simple moving average (red, 4-hour), and the 200 simple moving average (green, 4-hour).
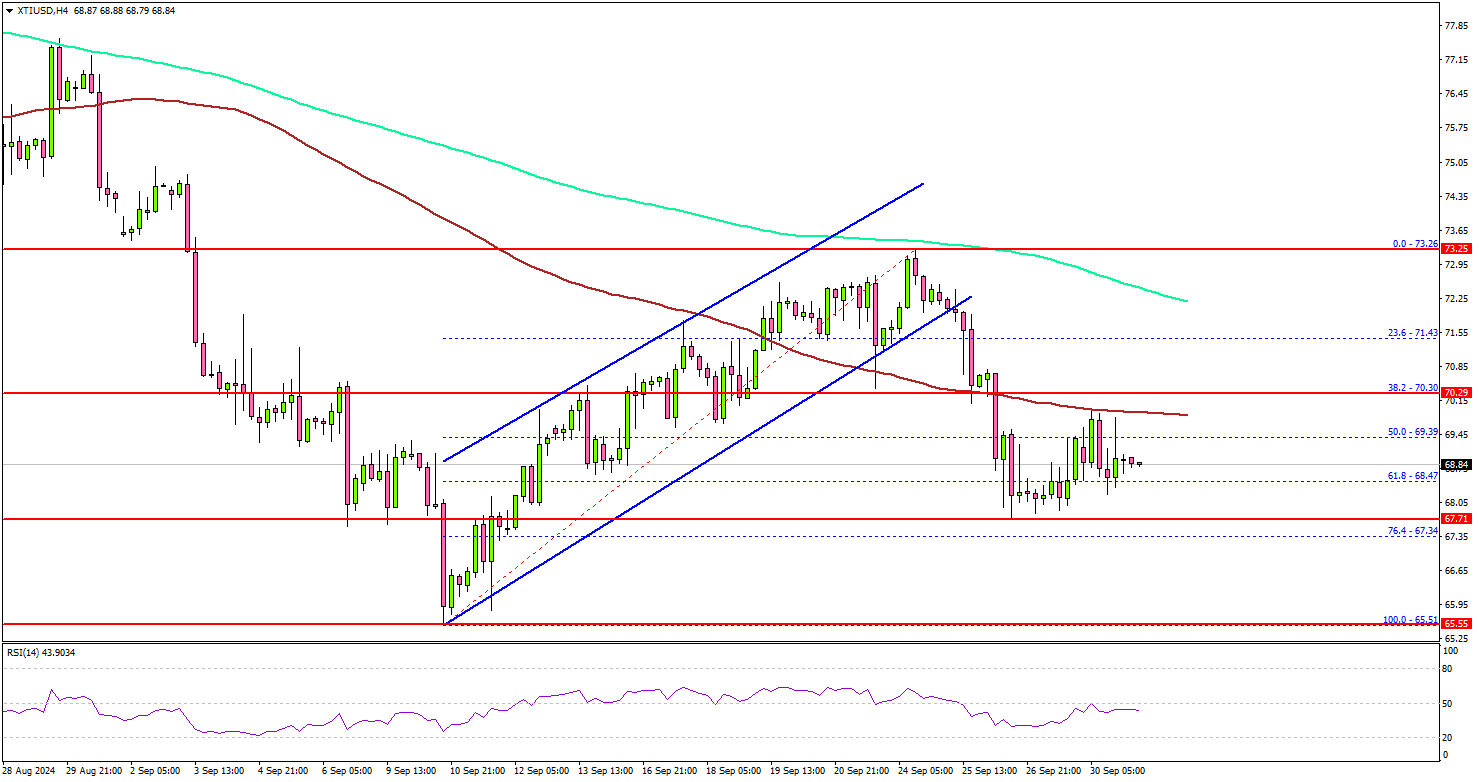
There was a clear move below the 61.8% Fib retracement level of the upward move from the $65.51 swing low to the $73.26 high. The bulls are now trying to protect the $67.65 support.
On the downside, the first major support sits near the $67.35 level. It is close to the 76.4% Fib retracement level of the upward move from the $65.51 swing low to the $73.26 high. A daily close below $67.35 could open the doors for a larger decline.
The next major support is $65.50. Any more losses might send oil prices toward $60.00 in the coming days. On the upside, the price might face resistance near the $70.00 level.
The next major resistance is near the $71.50 zone, above which the price may perhaps accelerate higher. In the stated case, it could even visit the $72.20 resistance. Any more gains might call for a test of $73.25.
Looking at Gold, the price formed a short-term top near $2,685 and recently started a downside correction below the $2,665 level.
Economic Releases to Watch Today
- Germany’s Manufacturing PMI for Sep 2024 – Forecast 40.3, versus 40.3 previous.
- Euro Zone Manufacturing PMI for Sep 2024 – Forecast 44.8, versus 44.8 previous.
- US ISM Manufacturing Index for Sep 2024 – Forecast 47.5, versus 47.2 previous.


