USDCAD, H4
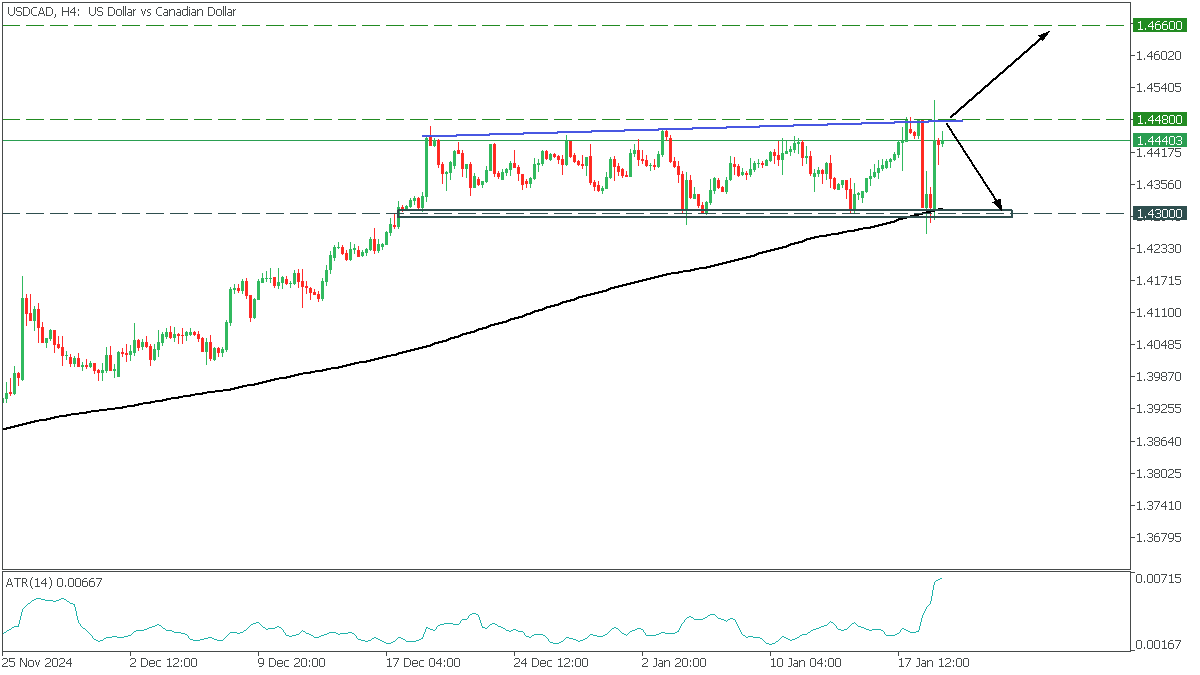
USDCAD chart on H4 shows a flat with a false breakdown of the upper boundary and a return to the expanding wedge and a bounce from MA200. Growing ATR indicates the growth of volatility and increasing probability of strong movement when key levels are broken.
- A break of the upper trendline above 1.4480 would open the way to 1.4660, corresponding to the 2019 high;
- A bounce off the trendline would drop USCAD to 1.4300;