
Oil and natural gas prices remain unstable as traders react to global tensions and trade uncertainties. Crude oil prices stayed steady as markets evaluated how new tariff measures might affect significant energy suppliers. Meanwhile, U.S. oil stockpiles grew by 3.46 million barrels, likely due to lower demand after recent weather disruptions.
Oil (XTIUSD) is trading at $72.51, down 0.61%, struggling to rise above the key level of $73.49. If prices break above this point, they could climb toward $74.93 or even $75.95, but if they fail to do so, oil may drop to $72.32 or $71.25.
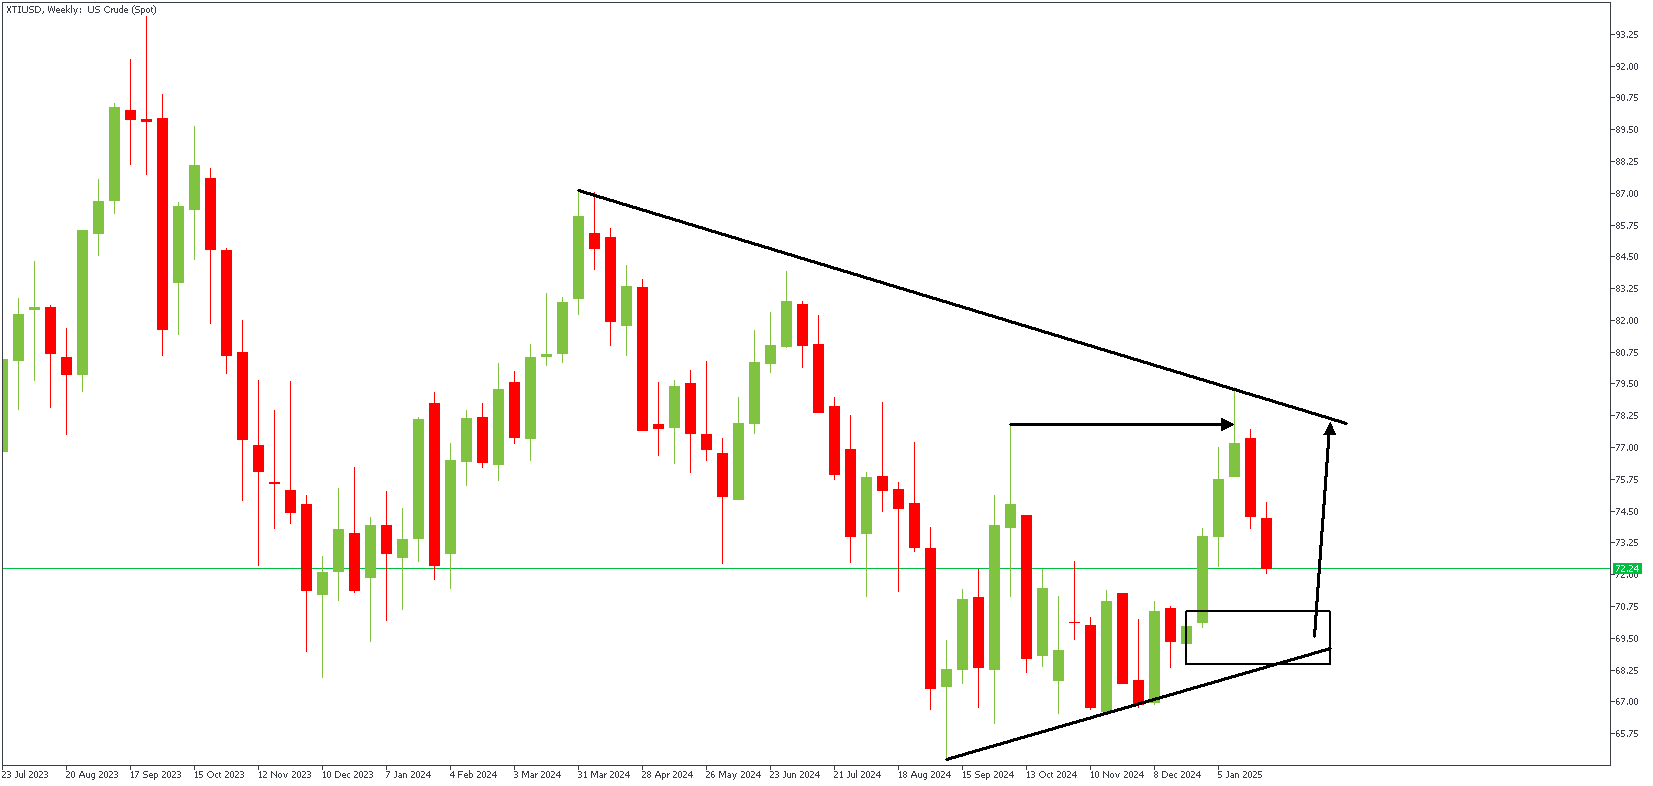
XTIUSD – W1 Timeframe
The weekly timeframe chart of XTIUSD shows a recent break above the previous high. The price is currently trading near the FVG (Fair Value Gap) created by the impulse move. The highlighted zone is the expected area of interest to watch for a bullish confirmation. The lower timeframe lends clarity to the area.
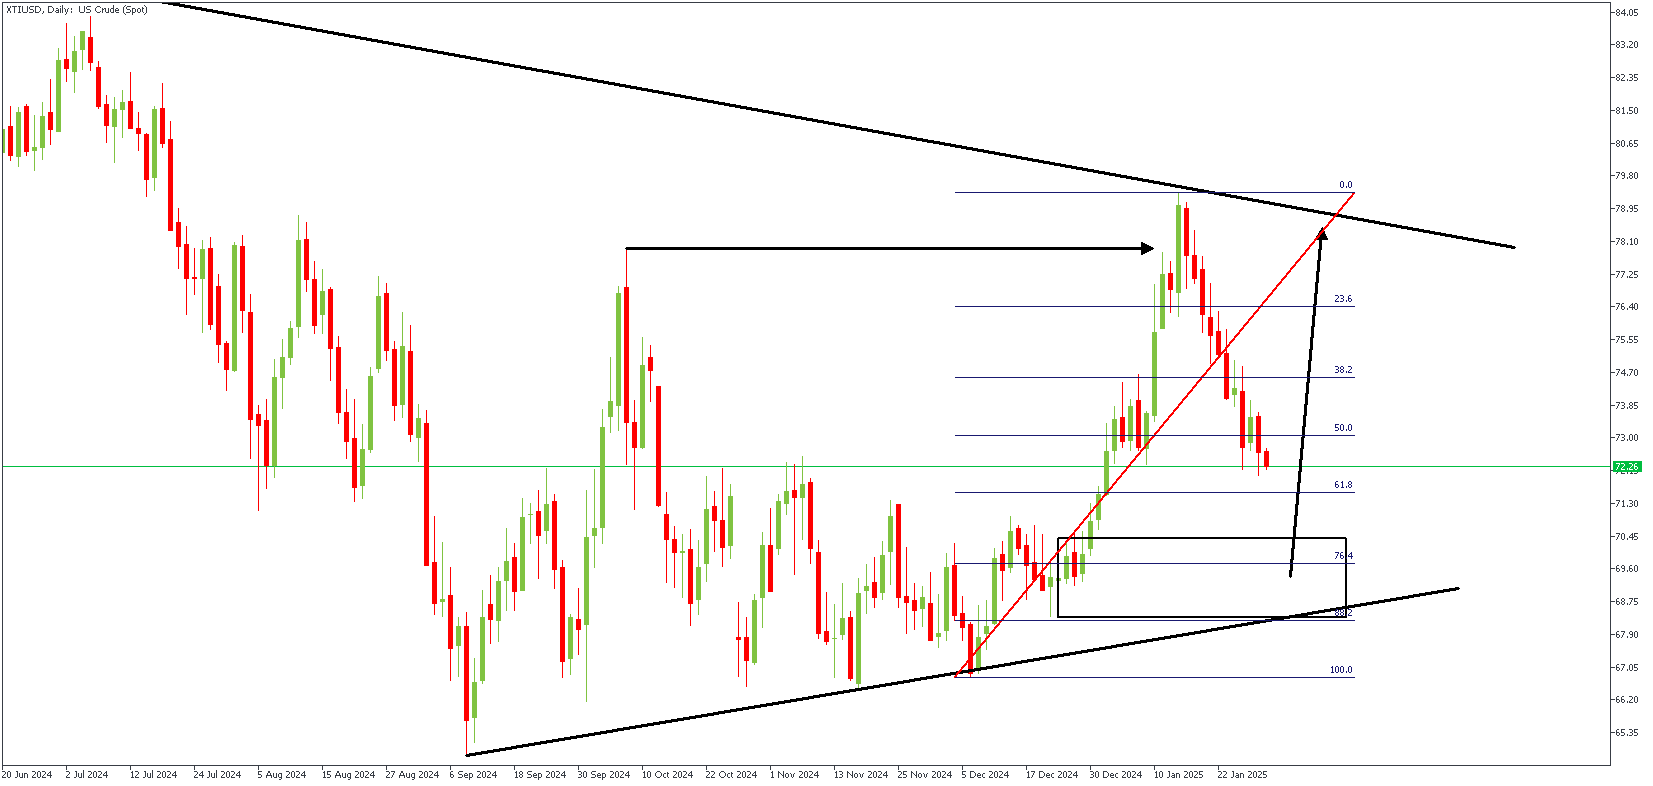
XTIUSD – D1 Timeframe
On the daily timeframe chart of XTIUSD, we see the price sliding towards the drop-base-rally demand zone at the origin of the impulse move. The demand zone also features an SBR (Sweep-Break-Retest) pattern and overlaps the 76% Fibonacci retracement level – powerful confluences favoring the bullish sentiment.
Analyst’s Expectations:
- Direction: Bullish
- Target: 77.94
- Invalidation: 66.50


 created by the impulse move. The highlighted zone is the expected area of interest to watch for a bullish confirmation. The lower timeframe lends clarity to the area.)